


Features
- 30 Unique slides
- Fully editable and easy to edit in Microsoft Powerpoint, Keynote and Google Slides
- 16:9 widescreen layout
- Clean and professional designs
- Export to JPG, PDF or send by email


Do you have any questions?
Recommend


20 slides
Valkyrie Design Strategy Proposal Presentation
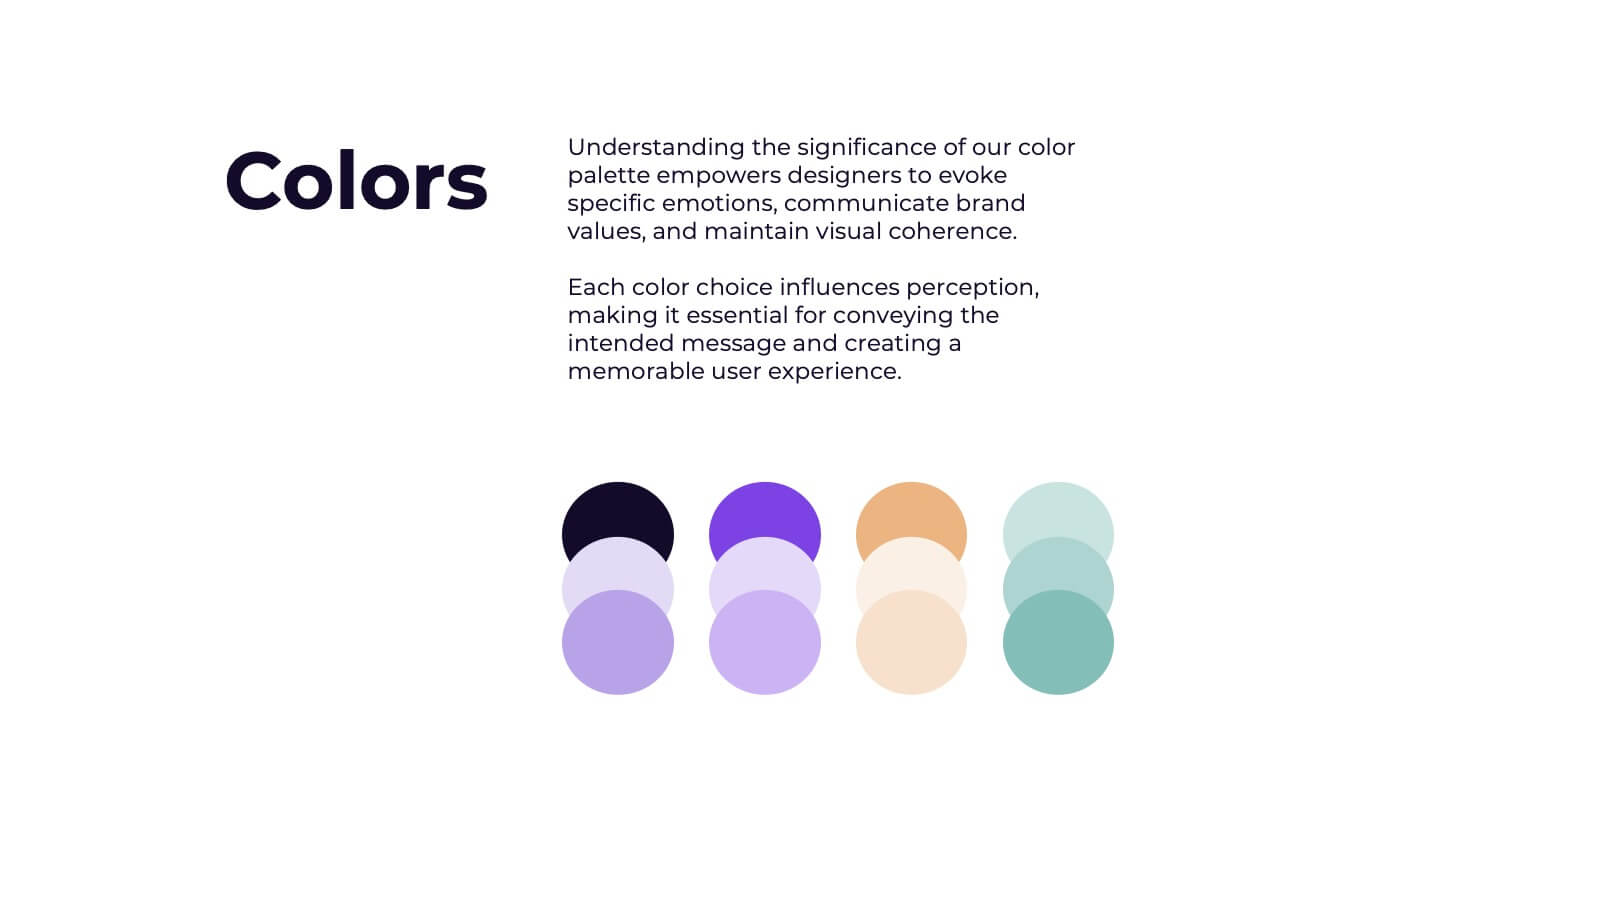
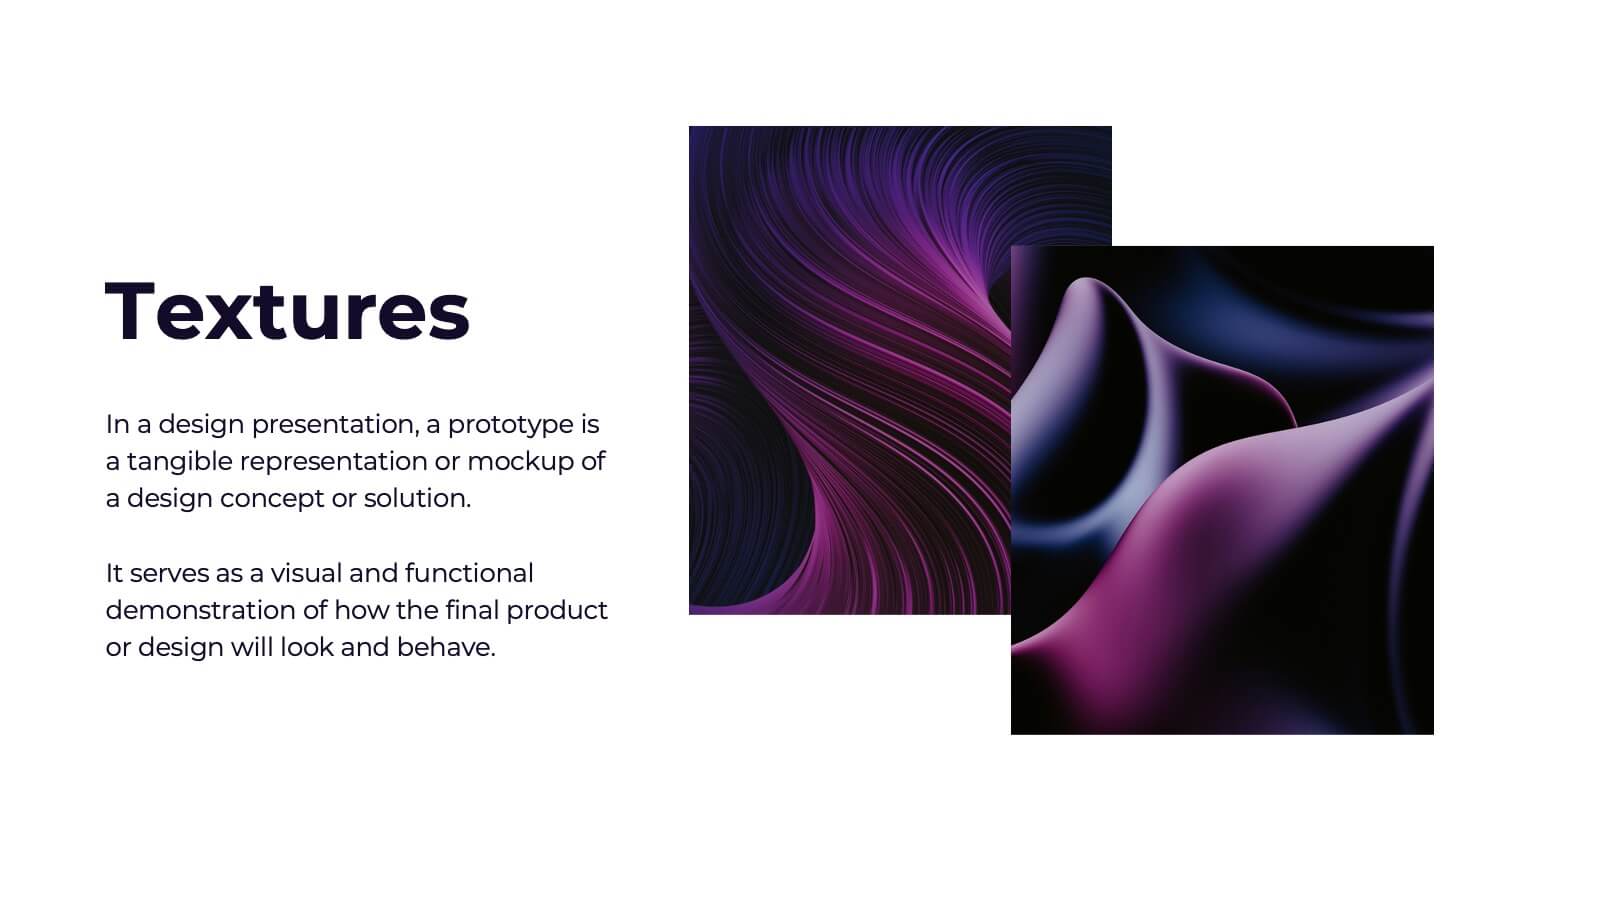
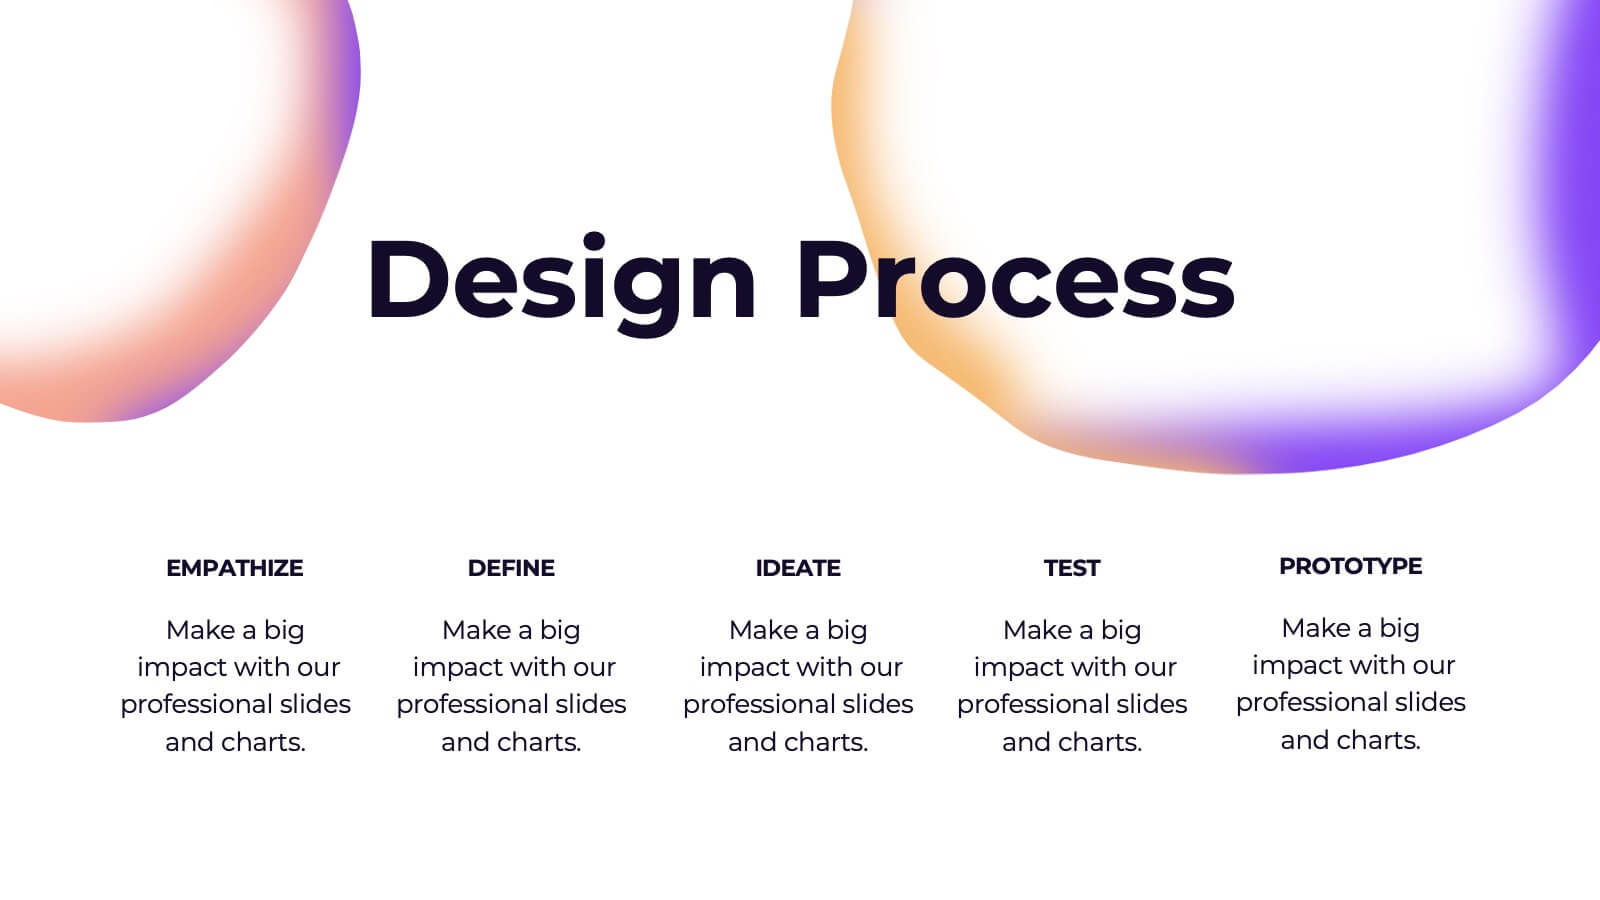
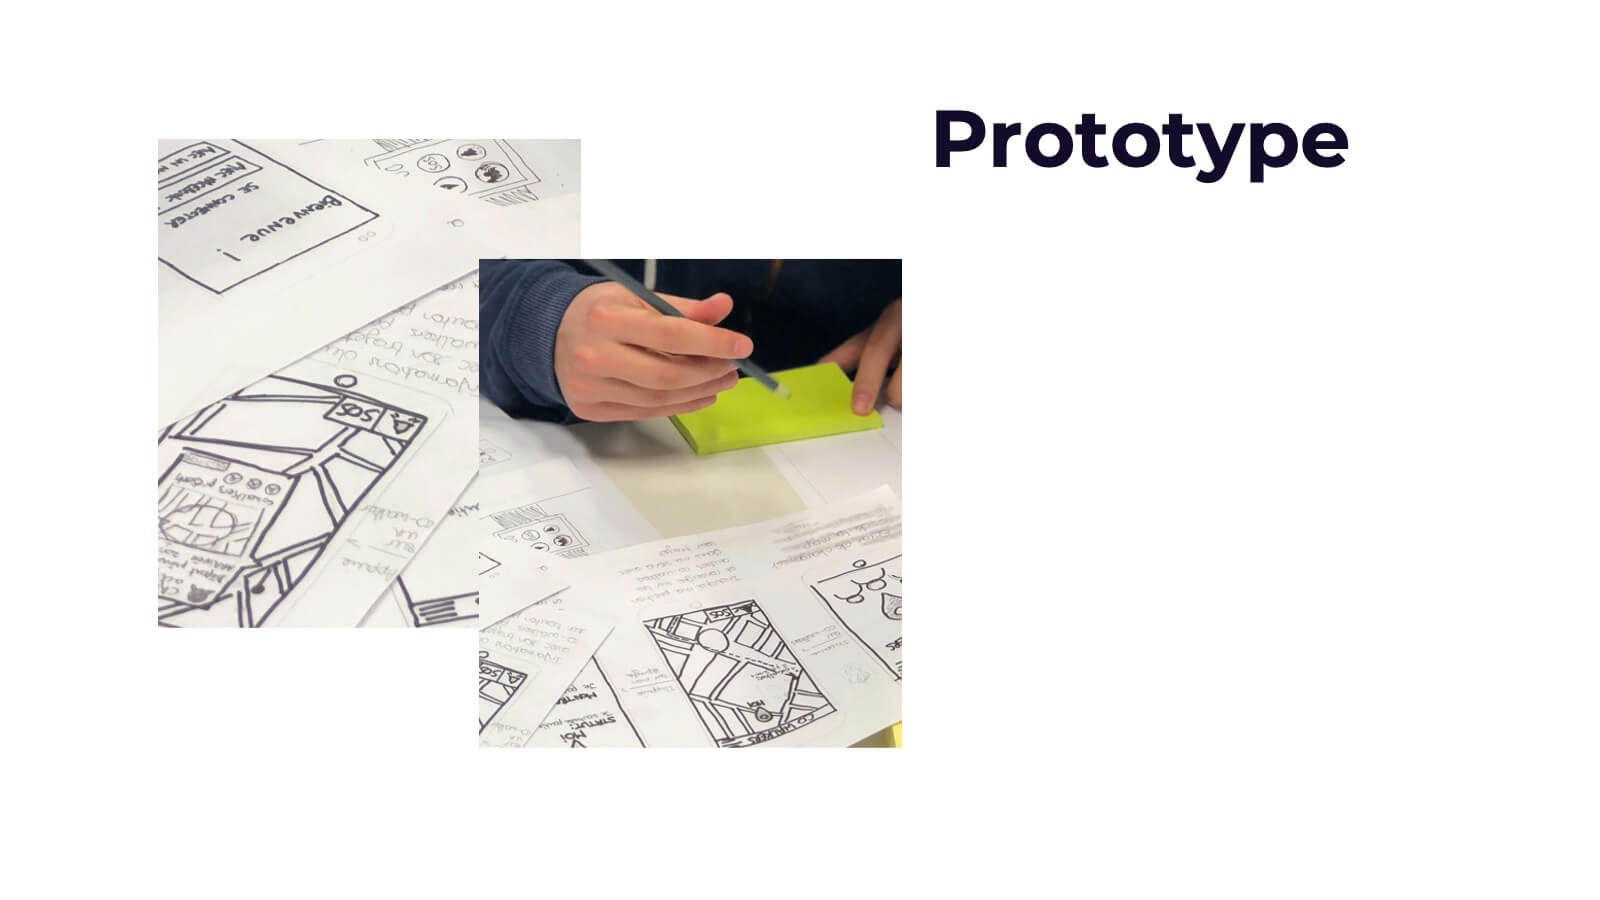
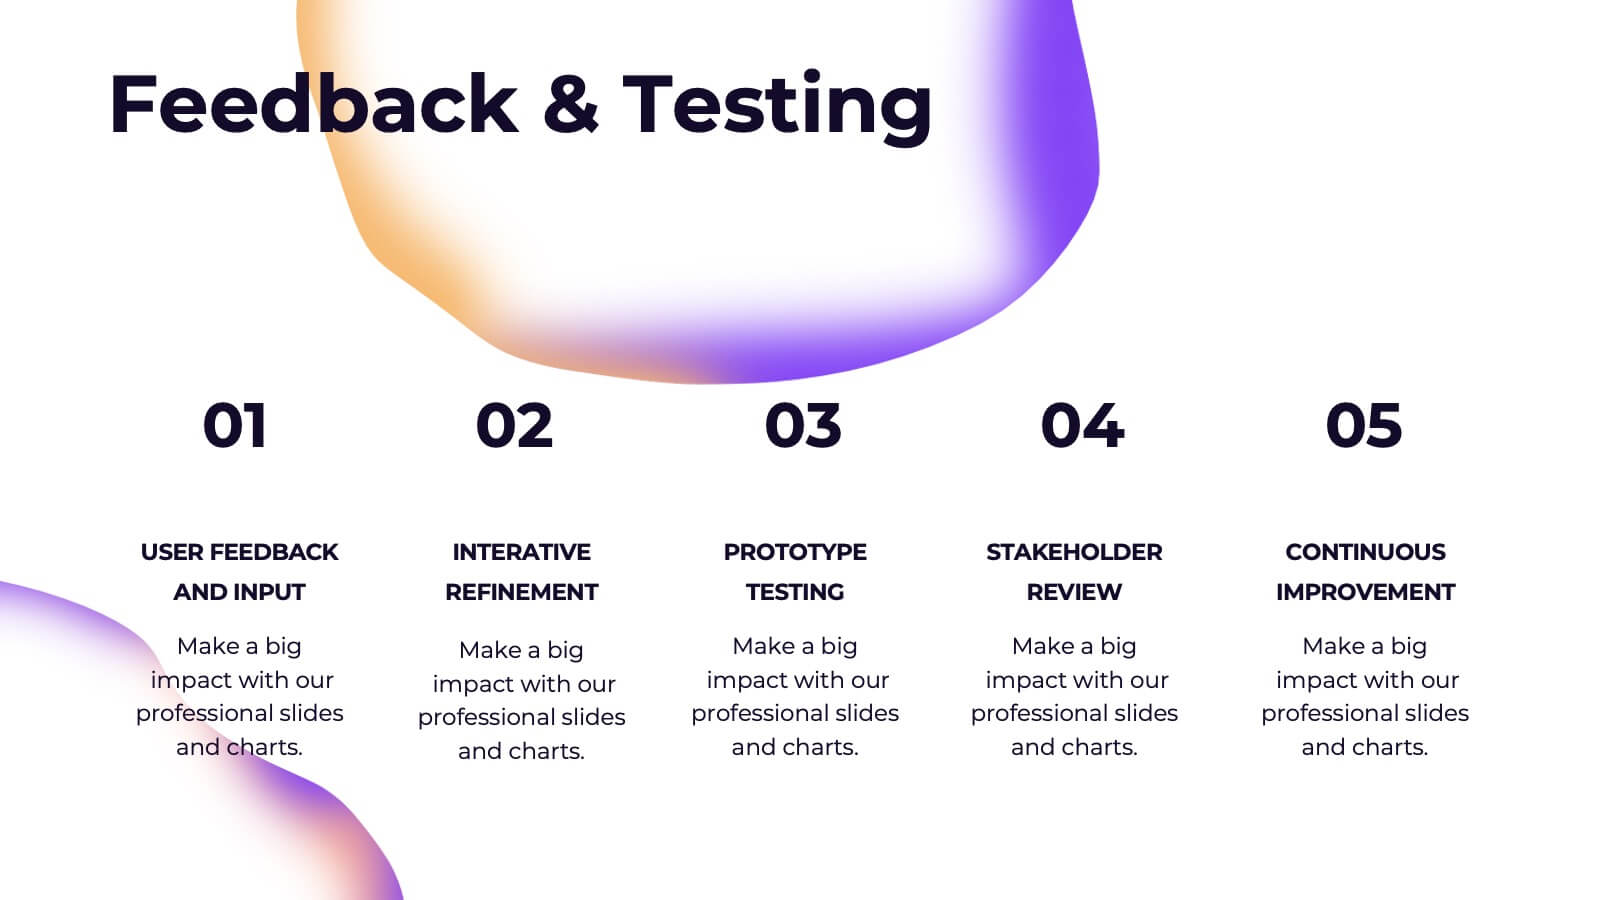
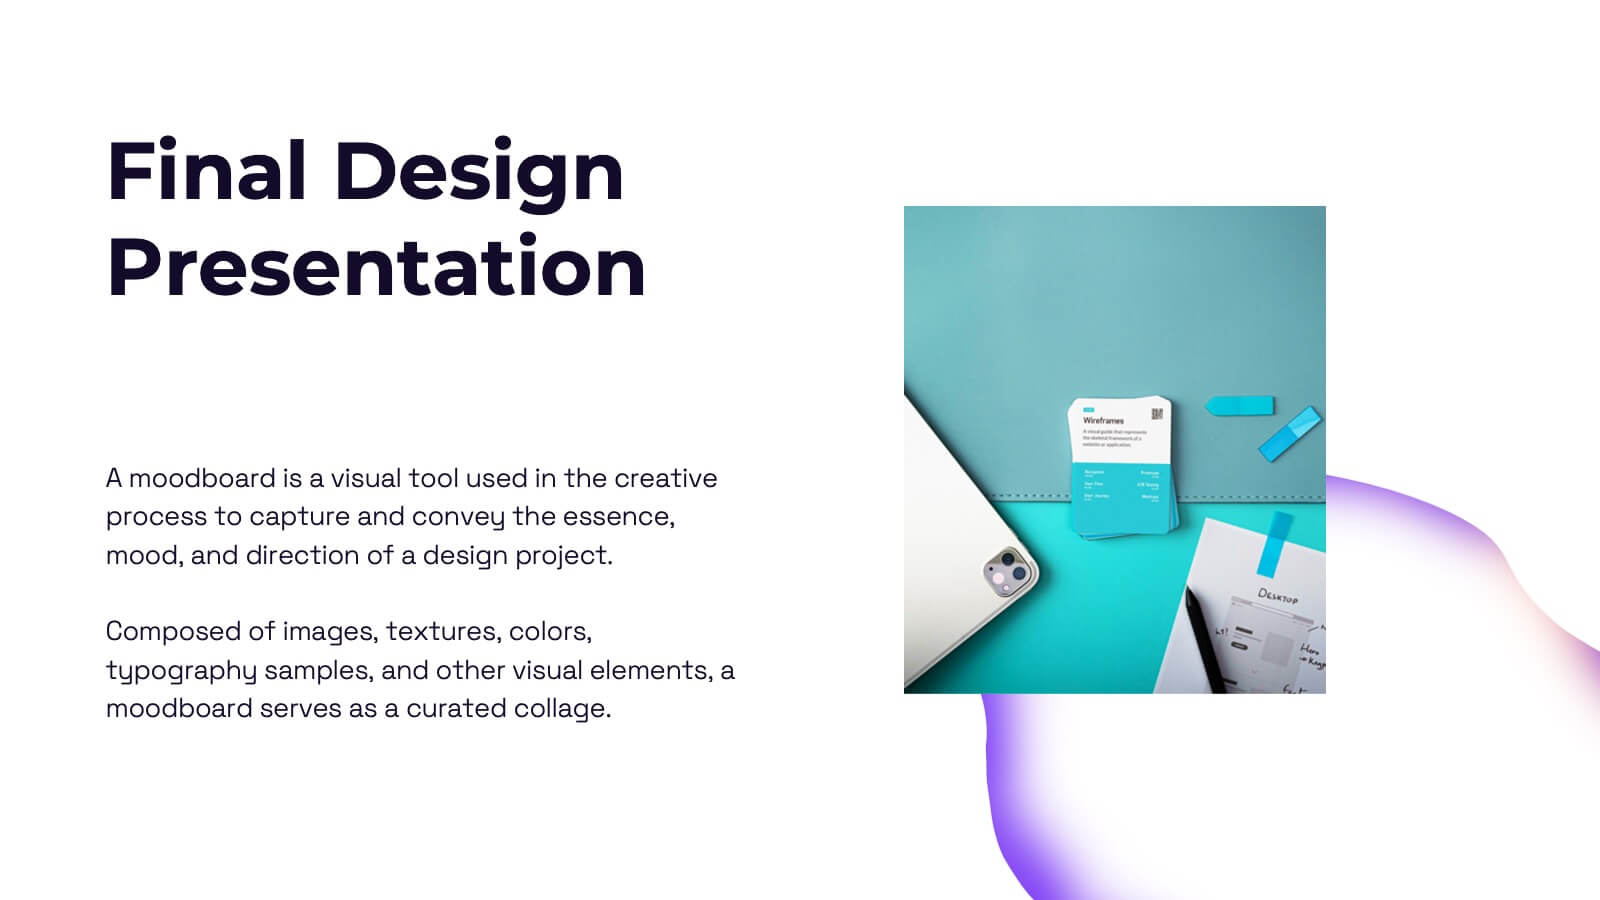
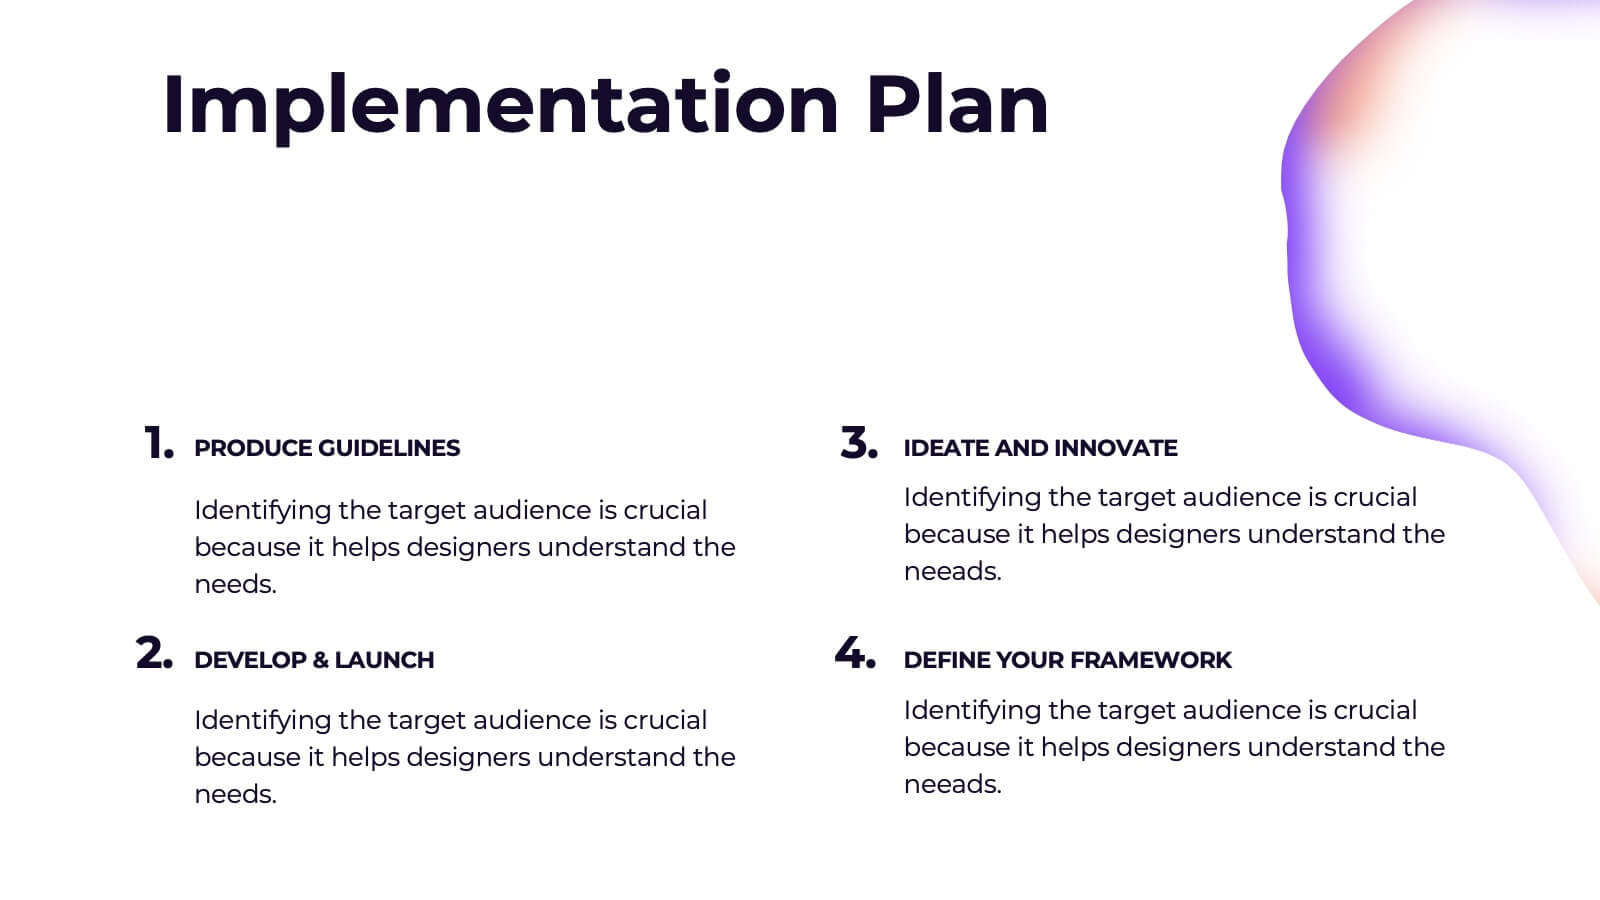
Elevate your design strategy presentations with this visually captivating and modern template! It covers every step of the design process, from concept development and mood boards to prototype iterations and feedback. Ideal for showcasing design elements, textures, and assets, this template is perfect for creative professionals. Compatible with PowerPoint, Keynote, and Google Slides for easy, polished presentations.


5 slides
Corporate Strategic Planning Presentation
Create a winning strategy with this corporate strategic planning template. Designed for business leaders, it helps structure goals, initiatives, and key performance areas in a clear, visual format. Ideal for strategic decision-making and long-term planning. Fully customizable and compatible with PowerPoint, Keynote, and Google Slides for seamless editing and presentation.


5 slides
Business Insights Through Dashboard Visualization Presentation
Visualize key metrics with this Business Insights Through Dashboard Visualization presentation. The funnel chart layout is ideal for showcasing conversion rates, customer journeys, or sales processes. Each section includes clear labels and percentage indicators. Fully editable in Canva, PowerPoint, and Google Slides to suit your business reporting needs.


22 slides
Starlit Agency Portfolio Presentation
The Starlit Agency Portfolio template is a sophisticated way to highlight your agency's expertise, achievements, and creative vision! Perfect for presenting to potential clients or partners, this template starts with a polished introduction and an "About Us" section that clearly defines your agency's mission and vision. Showcase your team's skills and services in an organized manner, making it easy for clients to understand what you offer. With slides dedicated to client success stories, case studies, and market analysis, you can build trust by displaying your proven track record. Highlight industry trends and your agency's approach to creative processes to demonstrate your strategic thinking. The template also includes sections for strategy development, campaign execution, and measurement analytics, ensuring you cover all aspects of your services. Close with client testimonials, partnership opportunities, and a future outlook, leaving your audience impressed. This template is fully compatible with PowerPoint, Keynote, and Google Slides, making it versatile and easy to use for any presentation.


4 slides
Leadership and Team Challenges Presentation
Illustrate your team’s journey with this engaging visual that highlights progress, obstacles, and achievements. Featuring a dynamic leader figure ascending an arrow-shaped path, this template is ideal for showcasing leadership development, team-building stages, or challenge-resolution frameworks. Fully editable and compatible with PowerPoint, Keynote, and Google Slides.


5 slides
Rental Business Milestone Timeline Presentation
Showcase your company's growth journey with this clean Rental Business Milestone Timeline layout. Designed for tracking key achievements, it features a horizontal timeline with icons and customizable date markers. Perfect for business reviews or investor updates, it’s fully editable in PowerPoint, Keynote, and Google Slides for a professional presentation


21 slides
Shadowrise Product Roadmap Presentation
Plan and present your product journey effectively with this detailed roadmap presentation! It covers key areas like market analysis, product features, use cases, pricing strategies, and distribution channels, ensuring a clear path to success. Perfect for product teams, stakeholders, or investor meetings, this template is fully compatible with PowerPoint, Keynote, and Google Slides.


34 slides
Incubator Pitch Deck
An Incubator Pitch Deck is used by startups or entrepreneurs to pitch their business idea to an incubator or accelerator program, which are organizations that provide support, resources, and mentorship to early-stage startups to help them grow and succeed. This incubator pitch deck template is specifically tailored to the needs and requirements of the incubator or accelerator program. This template is designed with a professional and striking blue color palette, that adds a sense of sophistication and professionalism to your presentation. It also features a range of customizable slides that are specifically tailored for pitch presentations.


6 slides
Demographic and Behavioral Customer Profile Presentation
Understand your audience better with the Demographic and Behavioral Customer Profile Presentation. This visually engaging template separates key demographic details from behavior-based insights to help you build more effective marketing strategies. Fully customizable in Canva, PowerPoint, or Google Slides—perfect for marketers, strategists, and sales teams targeting customer segmentation.


8 slides
Business Strategy Alternatives
Present multiple strategic paths with this creative 4-way arrow infographic. Designed to clearly display four different options or directions, it’s ideal for scenario analysis, strategic planning, or decision-making meetings. Each path is paired with an icon and description for easy interpretation. Fully editable in PowerPoint, Keynote, and Google Slides.


4 slides
Project Development Progress Report Presentation
Track milestones with precision using this clean, data-driven slide designed for showcasing project completion percentages. Circular progress visuals paired with text blocks allow you to highlight achievements, issues, or next steps at a glance. Perfect for project managers, teams, and stakeholders. Fully editable in PowerPoint, Keynote, and Google Slides.


20 slides
Egeria Artist Portfolio Presentation
Showcase your artistry with this vibrant portfolio template, featuring sections for project displays, creative process, awards, and testimonials. Perfect for artists seeking a polished presentation of their work. Customizable and suitable for PowerPoint, Keynote, and Google Slides, this template highlights your unique style and professional journey.


4 slides
Asia Market Distribution Map Presentation
Highlight your business reach with the Asia Market Distribution Map Presentation. This dynamic layout features a regional color-coded map paired with labeled icons for clear segmentation by country or territory. Ideal for marketing teams, sales updates, and geographic performance reviews. Fully customizable in PowerPoint, Keynote, Google Slides, and Canva.


5 slides
Business Model Canvas and Strategy Presentation
Visualize your entire business model in one clean, structured slide. This presentation template breaks down key areas—Partners, Activities, Value Propositions, Customers, Channels, Costs, and Revenue—into a color-coded layout for strategic clarity. Perfect for startups, consultants, or internal strategy teams. Fully editable in PowerPoint, Keynote, and Google Slides.


6 slides
3D Diagram Slide Presentation
Bring your ideas to life with this modern 3D visual layout that adds depth and clarity to any concept. Ideal for breaking down complex information into four connected sections, it enhances understanding through visual hierarchy. Fully customizable and compatible with PowerPoint, Keynote, and Google Slides for effortless use.


5 slides
Workflow Management Diagram Presentation
Simplify your process visuals with a clean, modern layout designed to clarify every step. This presentation helps you map workflows, define responsibilities, and streamline communication across teams. Perfect for project planning and operations, it’s fully compatible with PowerPoint, Keynote, and Google Slides for effortless customization and professional presentation delivery.


6 slides
1-Page Executive Summary Slide Presentation
Bring clarity to complex updates in a single, colorful layout designed to keep your audience engaged from start to finish. This clean and modern slide breaks down key messages into six distinct points, making it easy to showcase progress, milestones, or strategies. Fully compatible with PowerPoint, Keynote, and Google Slides.