


Features
- 5 Unique slides
- Fully editable and easy to edit in Microsoft Powerpoint, Keynote and Google Slides
- 16:9 widescreen layout
- Clean and professional designs
- Export to JPG, PDF or send by email


Do you have any questions?
Recommend


21 slides
Mistrain Marketing Research Report Presentation
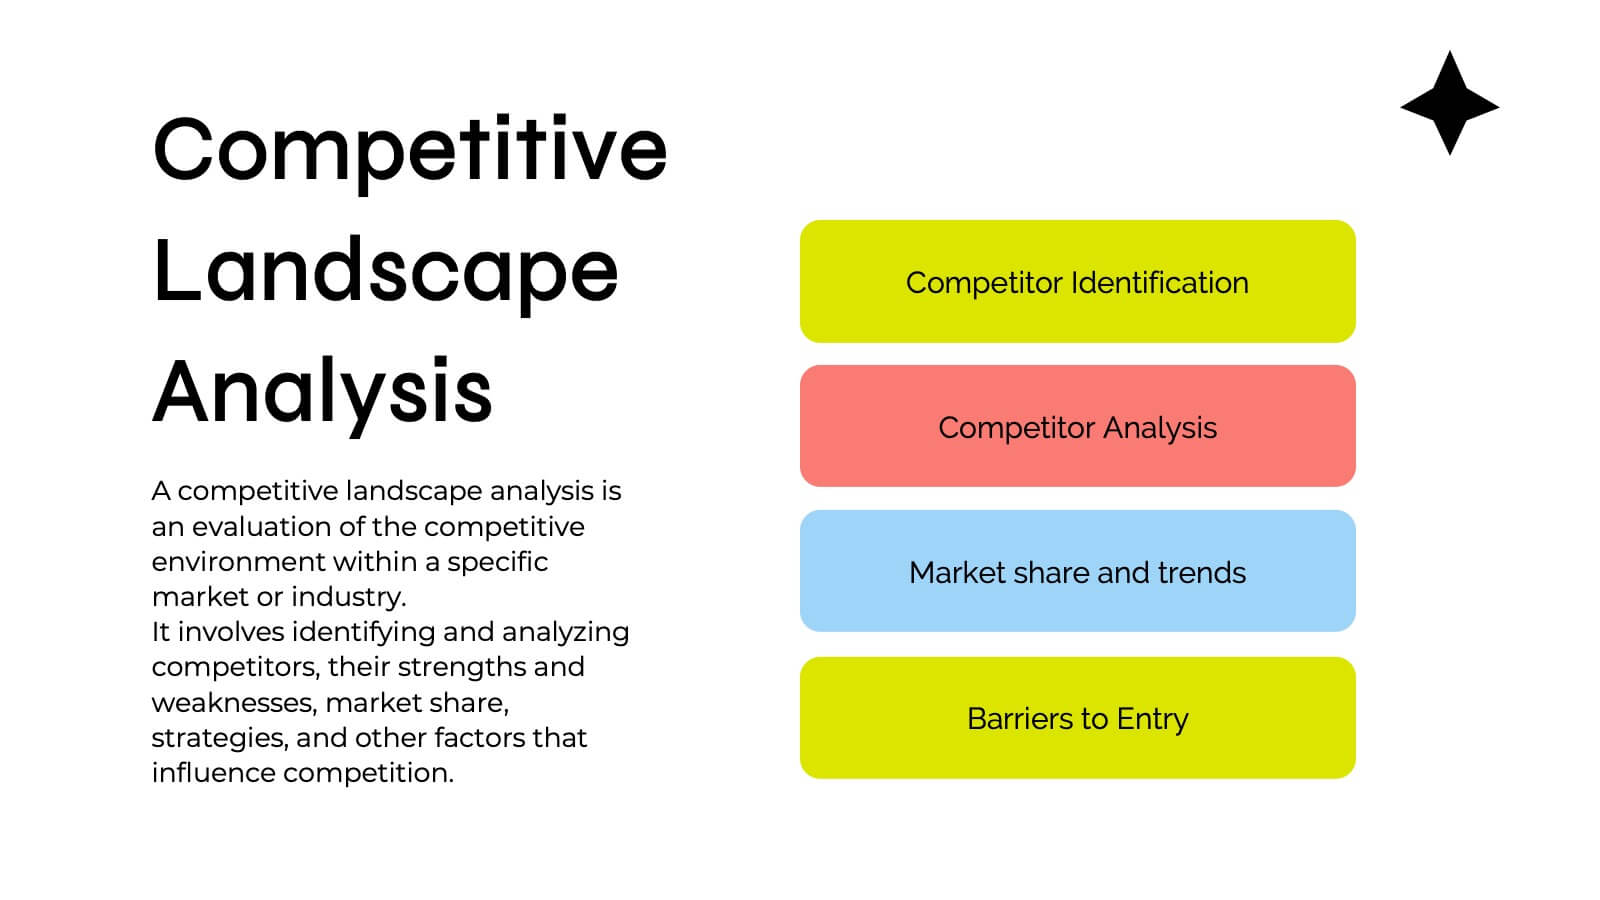
Present complex marketing research data with a visually engaging and structured template. This presentation design simplifies the process of showcasing company history, market presence, target audience insights, and competitive landscape analysis. With sections for financial highlights, growth plans, and client testimonials, it supports a comprehensive storytelling approach. Featuring clean layouts and aesthetic visuals, this template is ideal for presenting research findings, marketing plans, or audience insights to stakeholders. Fully customizable and compatible with PowerPoint, Google Slides, and Keynote, it ensures a seamless and professional presentation experience. Perfect for businesses, agencies, and professionals aiming to make impactful impressions.


10 slides
Professional Table of Content Slide Presentation
Give your presentation a polished and organized introduction with this Professional Table of Content slide. Designed for clarity and navigation, it features four sleek, color-coded content banners—perfect for outlining major sections or chapters. Each icon and title can be customized to reflect your topic structure. Ideal for business plans, proposals, or reports. Fully editable in PowerPoint, Keynote, and Google Slides.


6 slides
Social Relationship Infographics
Revitalize your presentations on social dynamics with our Social Relationship infographic, seamlessly compatible with Powerpoint, Keynote, and Google Slides. This infographic is a perfect addition for sociologists, relationship coaches, and educators who aim to discuss the complexities and interconnectedness of social relationships. The infographic offers a visual breakdown of different social relationship types, the dynamics within those relationships, and the factors influencing social interactions. It's designed to help audiences understand the different layers and nuances that make up social connections, whether in personal networks, communities, or professional environments. Incorporating this infographic into your presentations will assist in illustrating how relationships are formed, maintained, and evolved. It serves as an educational tool that can lead to deeper discussions about social bonds, communication patterns, and relationship management. Utilize this infographic to provide a clear and impactful visual representation of the fundamental concepts in social relationship studies.

22 slides
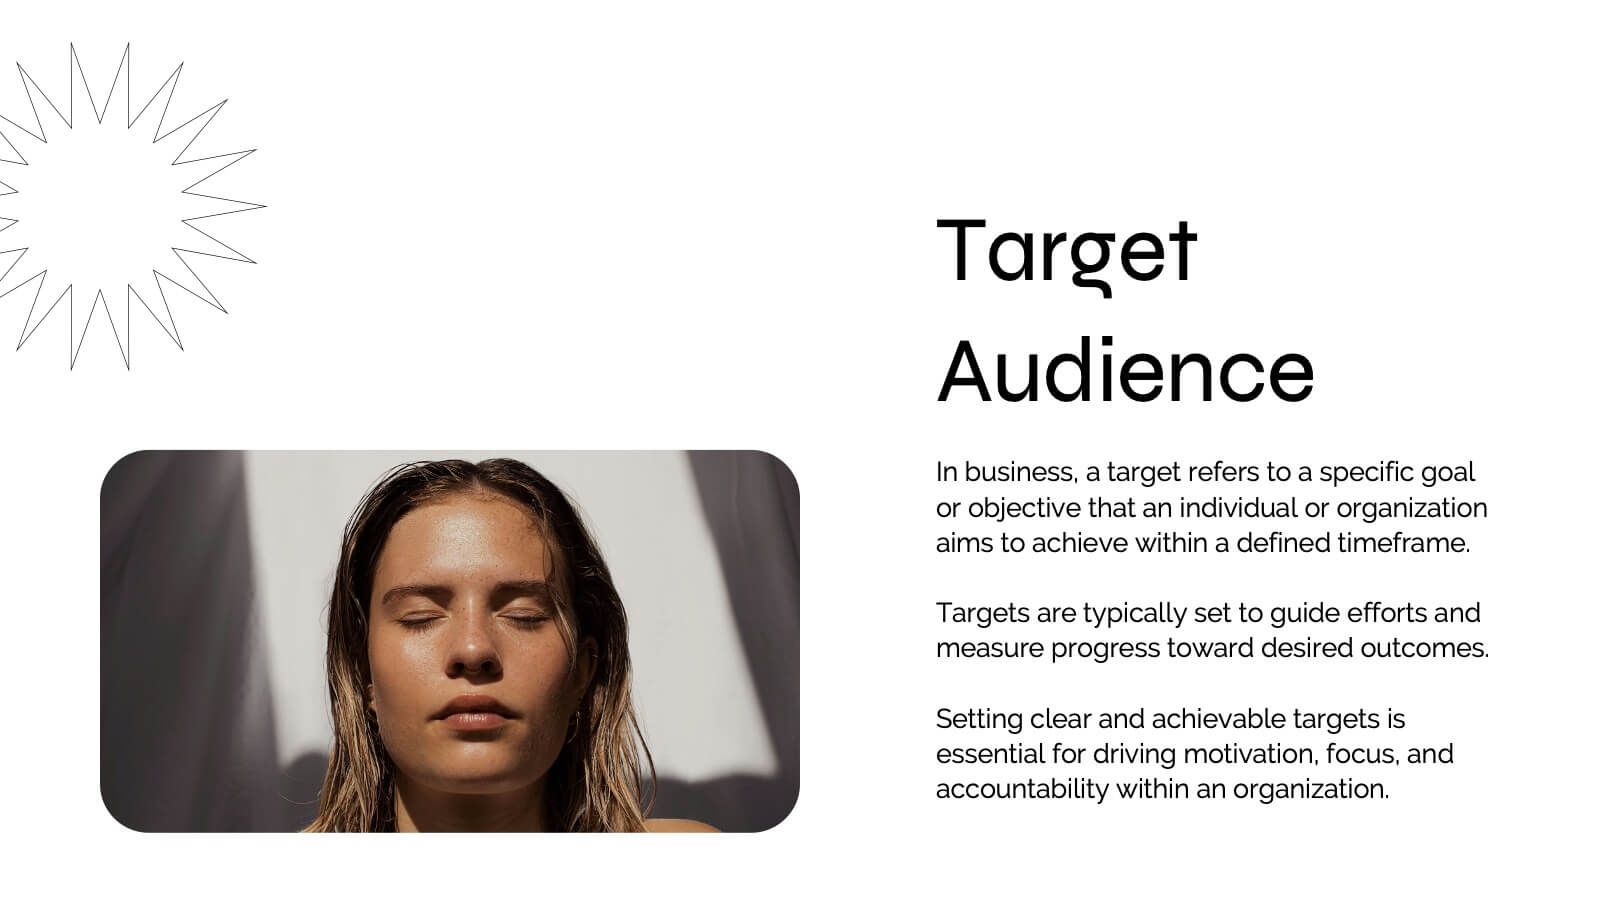
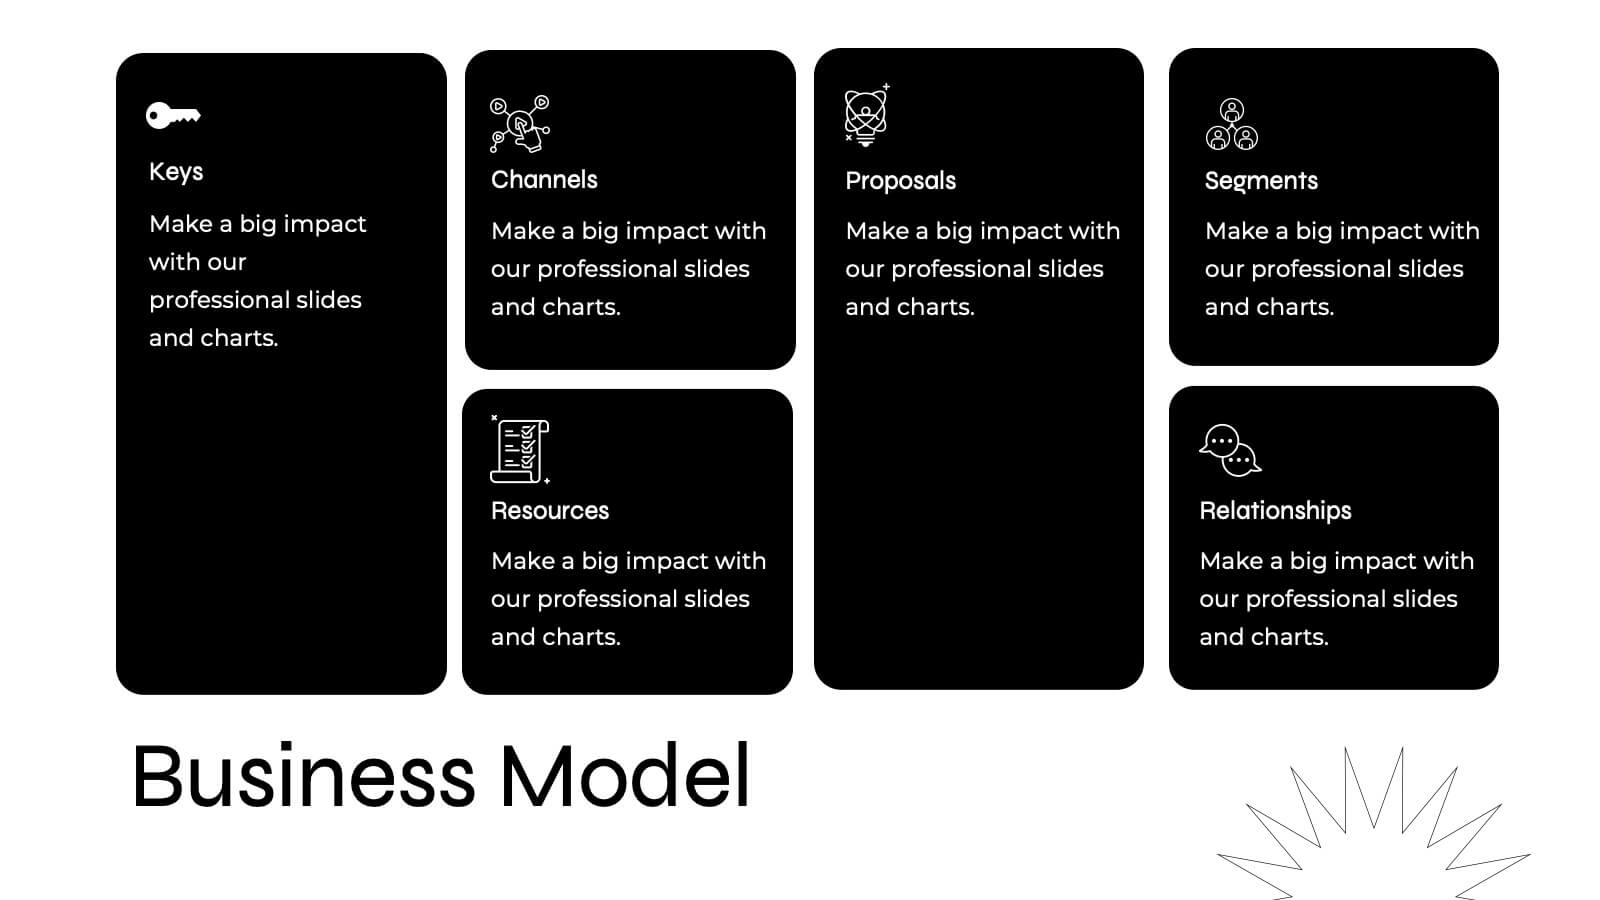
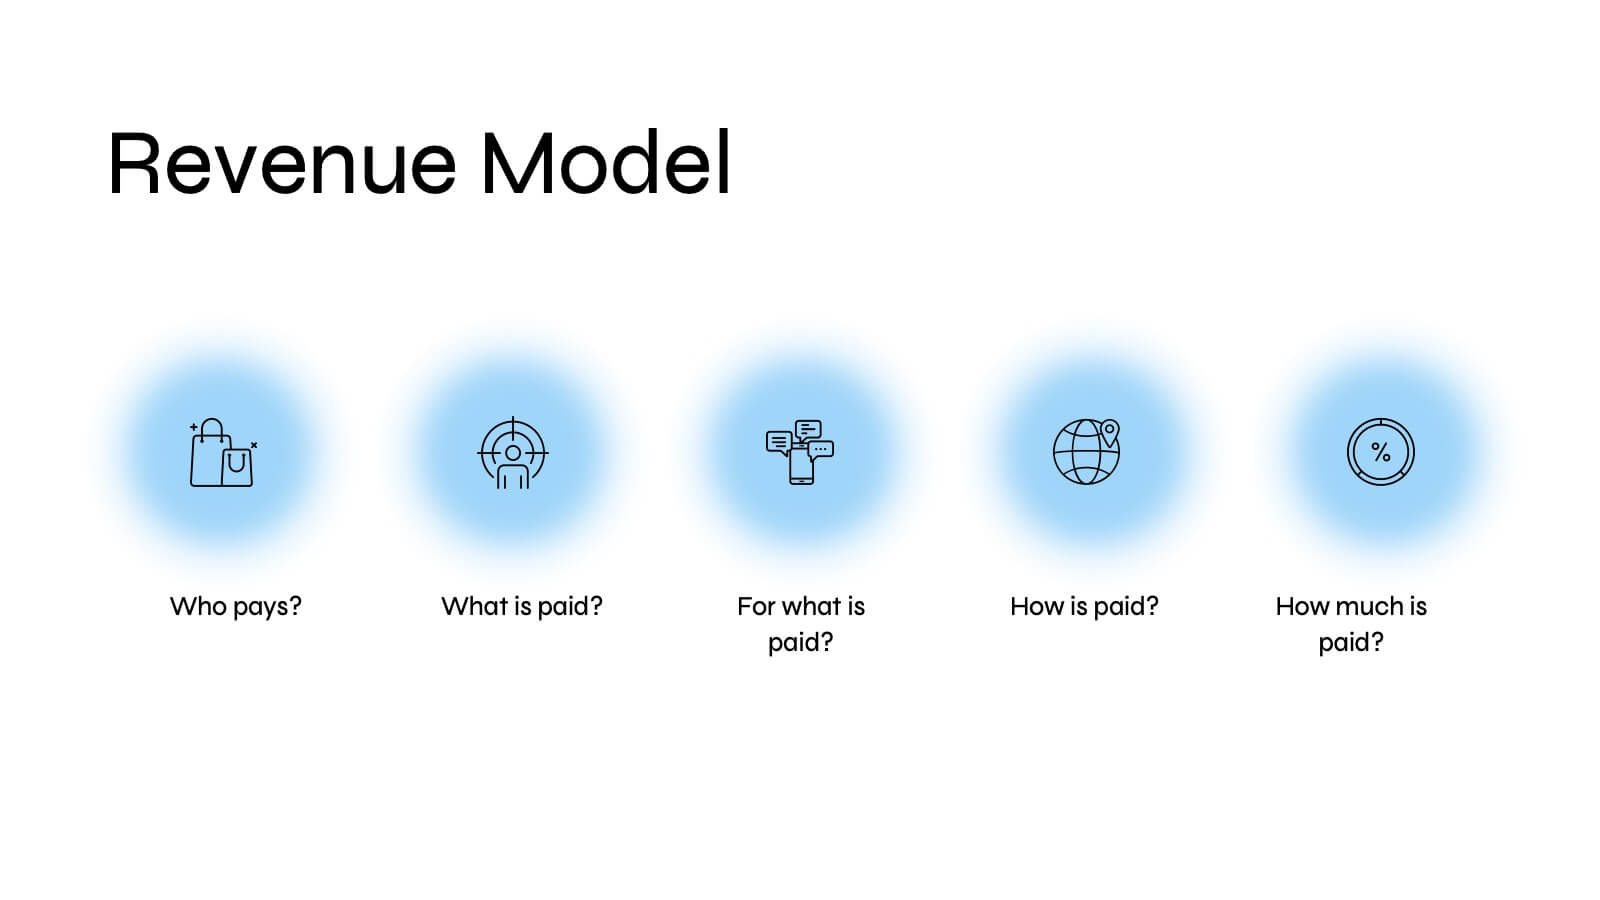
Quirinus Investor Pitch Presentation
Ready to impress investors and stakeholders? This sleek and modern pitch deck template covers all the essentials, from problem statements and market opportunities to revenue models and growth projections. Each slide is designed to convey clear and compelling information for maximum impact. Fully compatible with PowerPoint, Keynote, and Google Slides, making it the perfect tool for your next product launch!


7 slides
Digital Marketing Course Infographic
Dive into the dynamic realm of digital marketing with our Digital Marketing Course Infographic. Bathed in a clean white canvas, accentuated with the depth of blue, the optimism of yellow, and the innovation of green, our template captures the multifaceted nature of online marketing. Equipped with sharp infographics, relevant icons, and customizable image placeholders, it provides a comprehensive overview of digital marketing modules and strategies. Perfectly tailored for Powerpoint, Keynote, or Google Slides. An invaluable resource for marketing trainers, course instructors, students, or any organization aiming to upskill in the digital domain.


5 slides
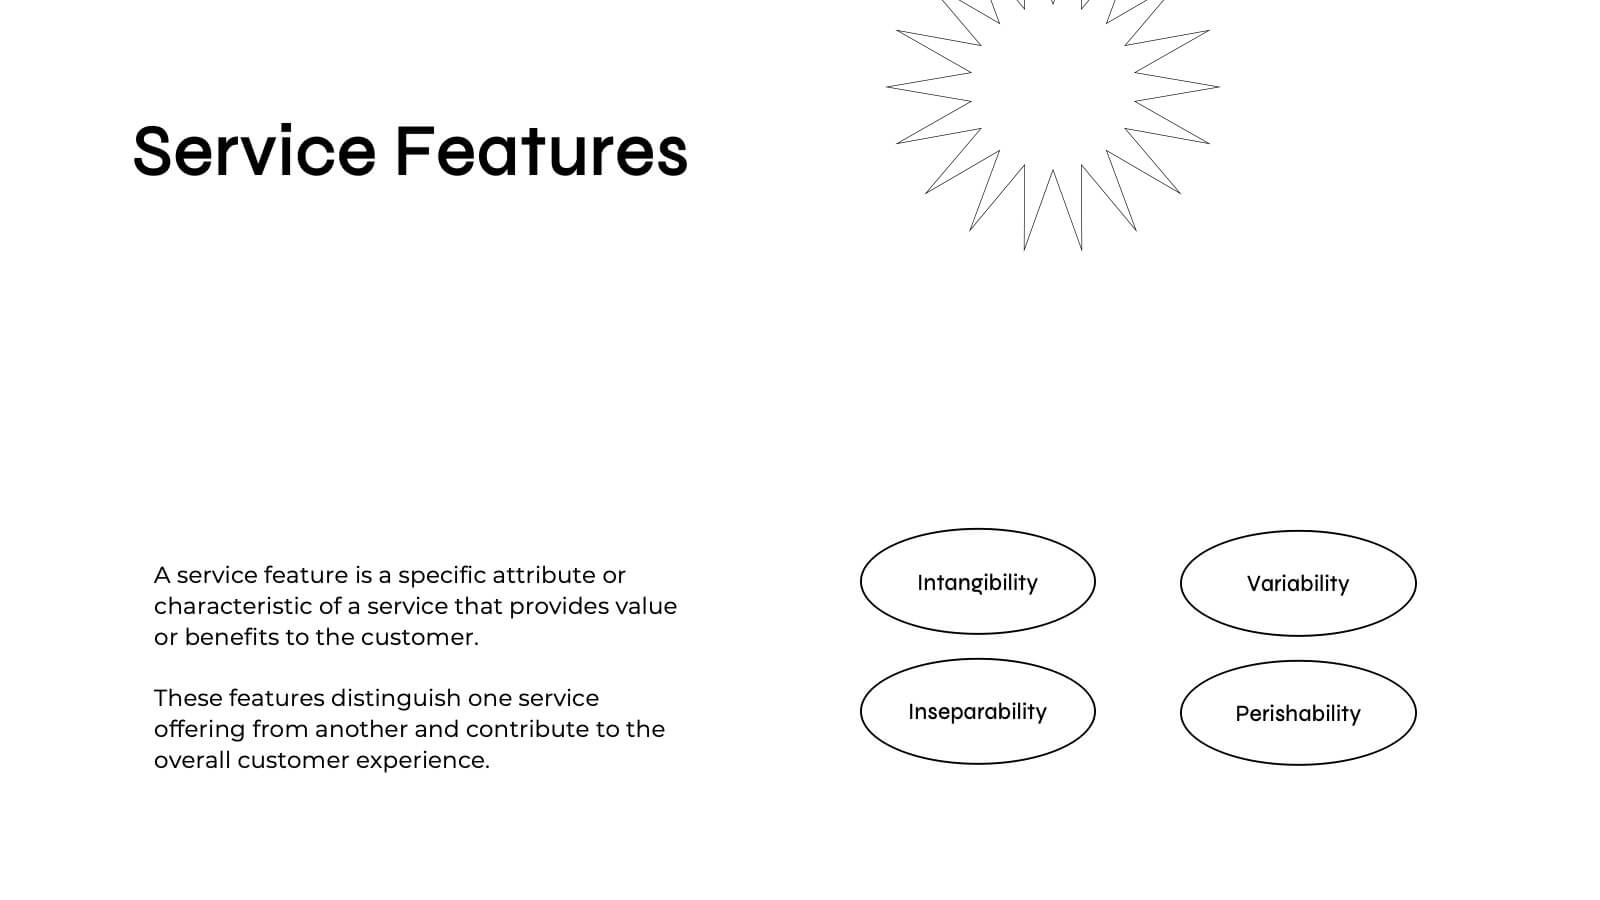
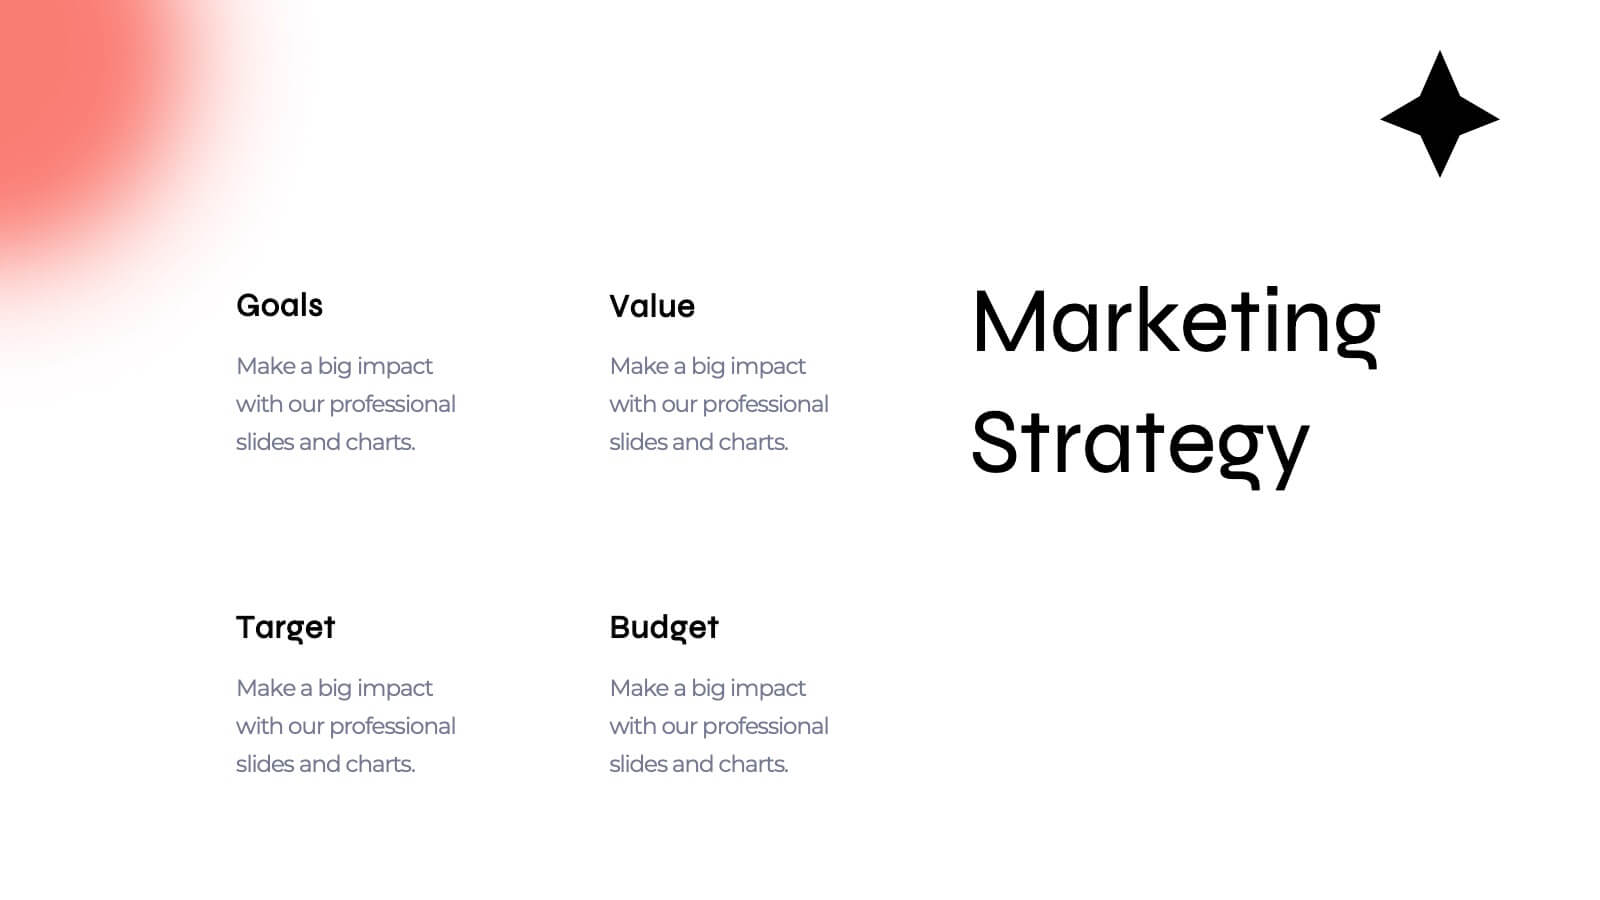
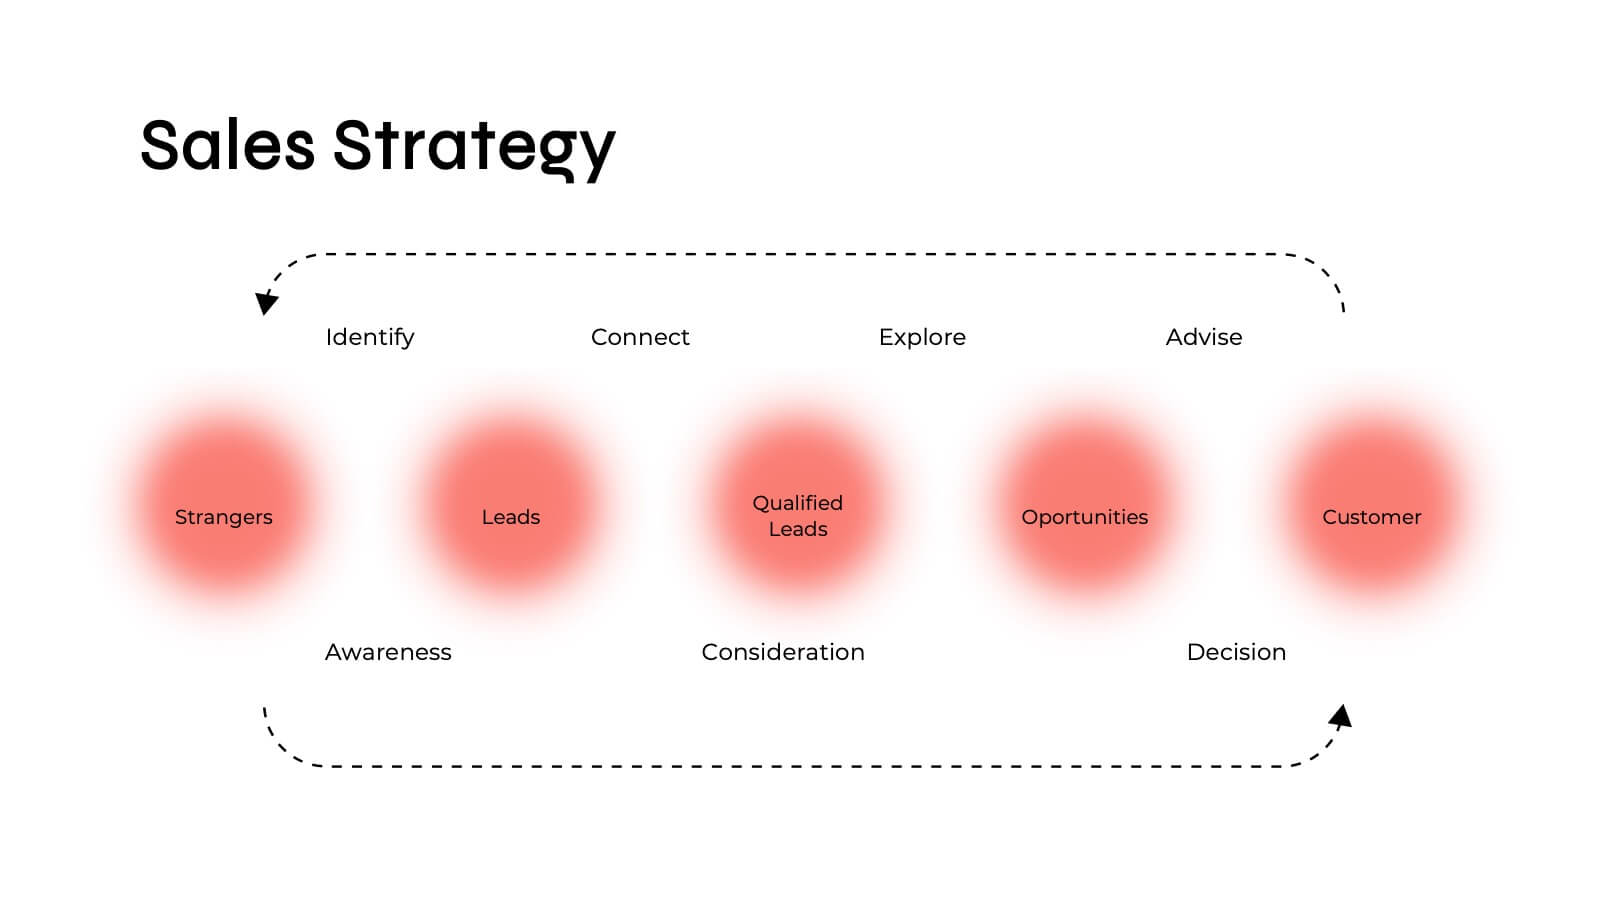
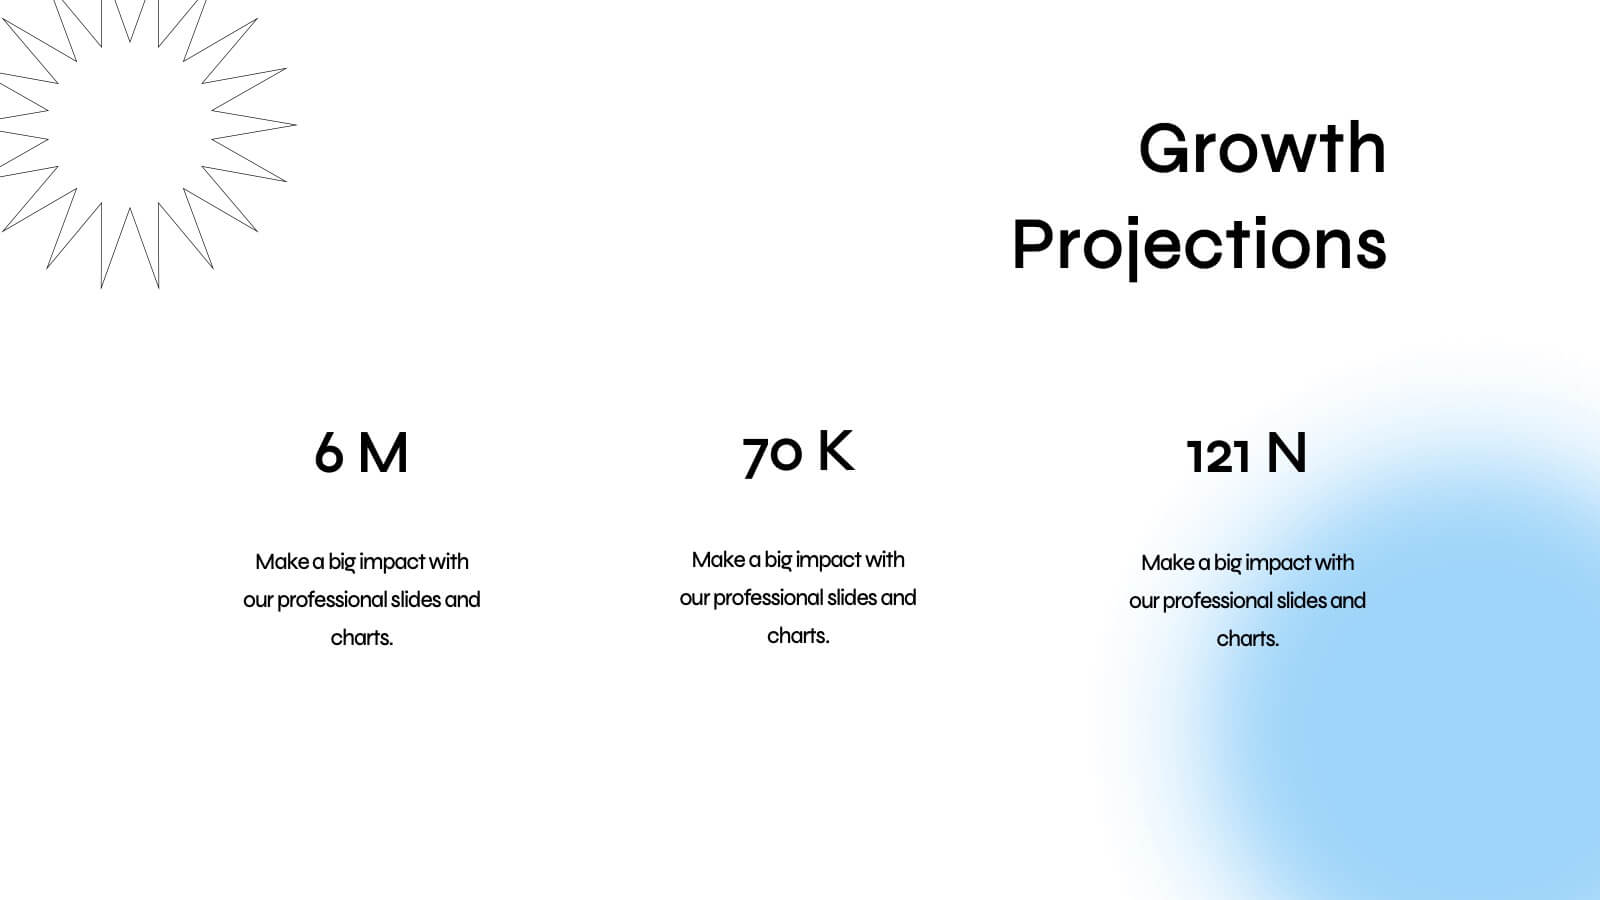
Strategic Vision for Long-Term Growth
Turn big goals into clear milestones with this upward path-style layout—perfect for illustrating your company’s strategic vision and long-term growth plan. Use each step to highlight priorities, phases, or guiding principles along the journey. Fully compatible with PowerPoint, Keynote, and Google Slides.
8 slides
Performance Tracking Using OKRs Presentation
Track success effectively with the Performance Tracking Using OKRs presentation. This sleek infinity loop design showcases key metrics across People, Products, and Processes, making it ideal for business performance reviews, goal alignment, and strategic planning. Fully editable and compatible with PowerPoint, Keynote, and Google Slides for seamless customization.


21 slides
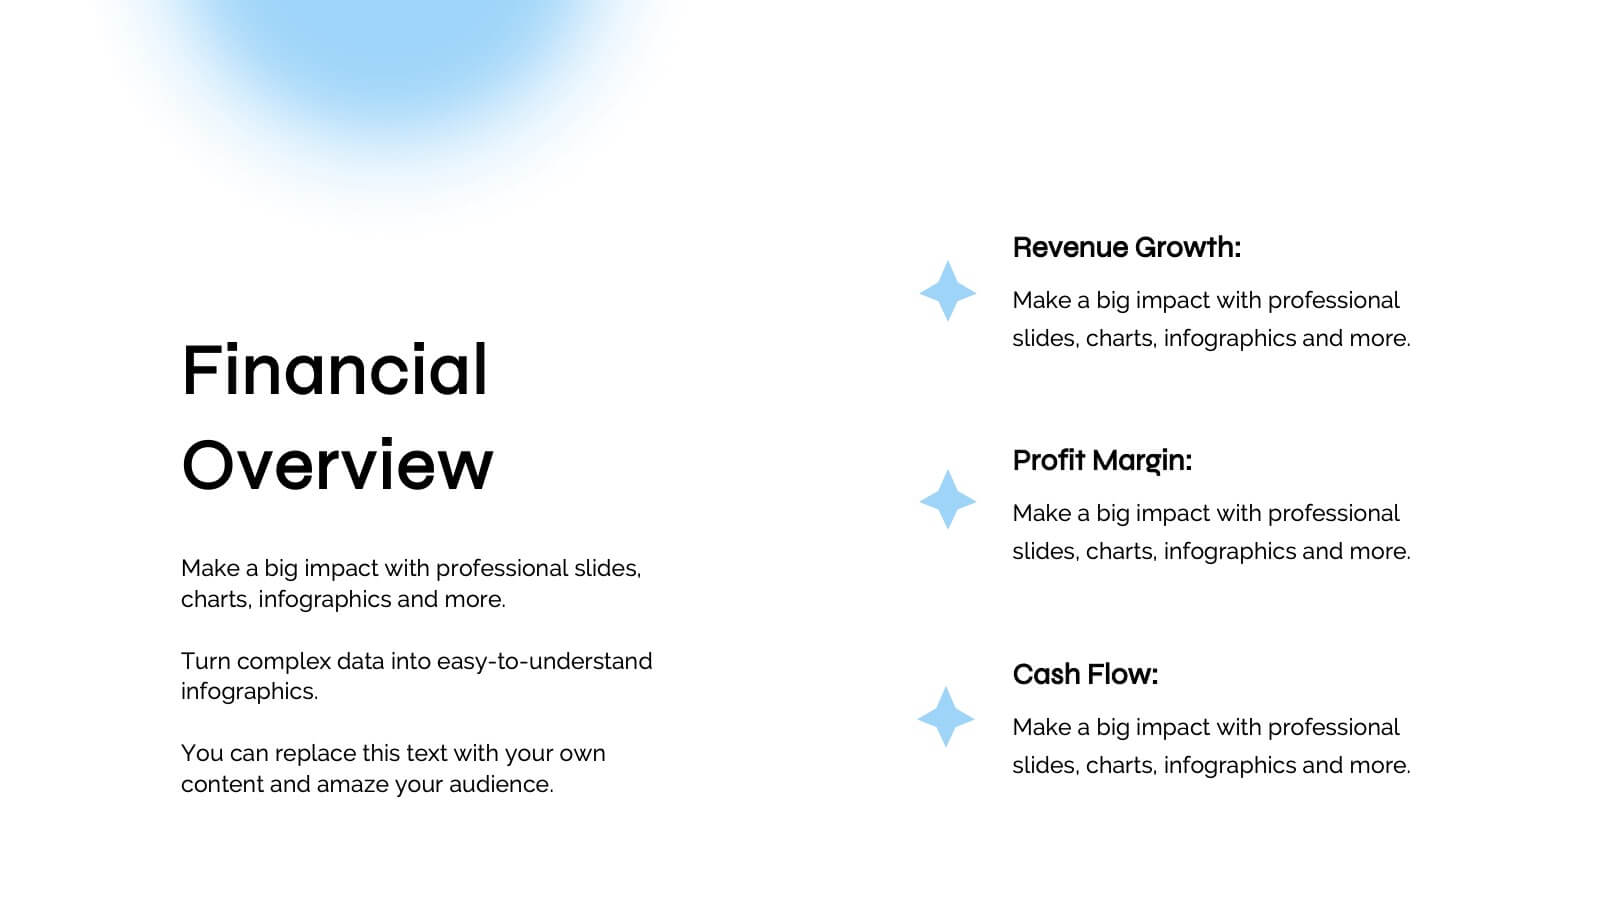
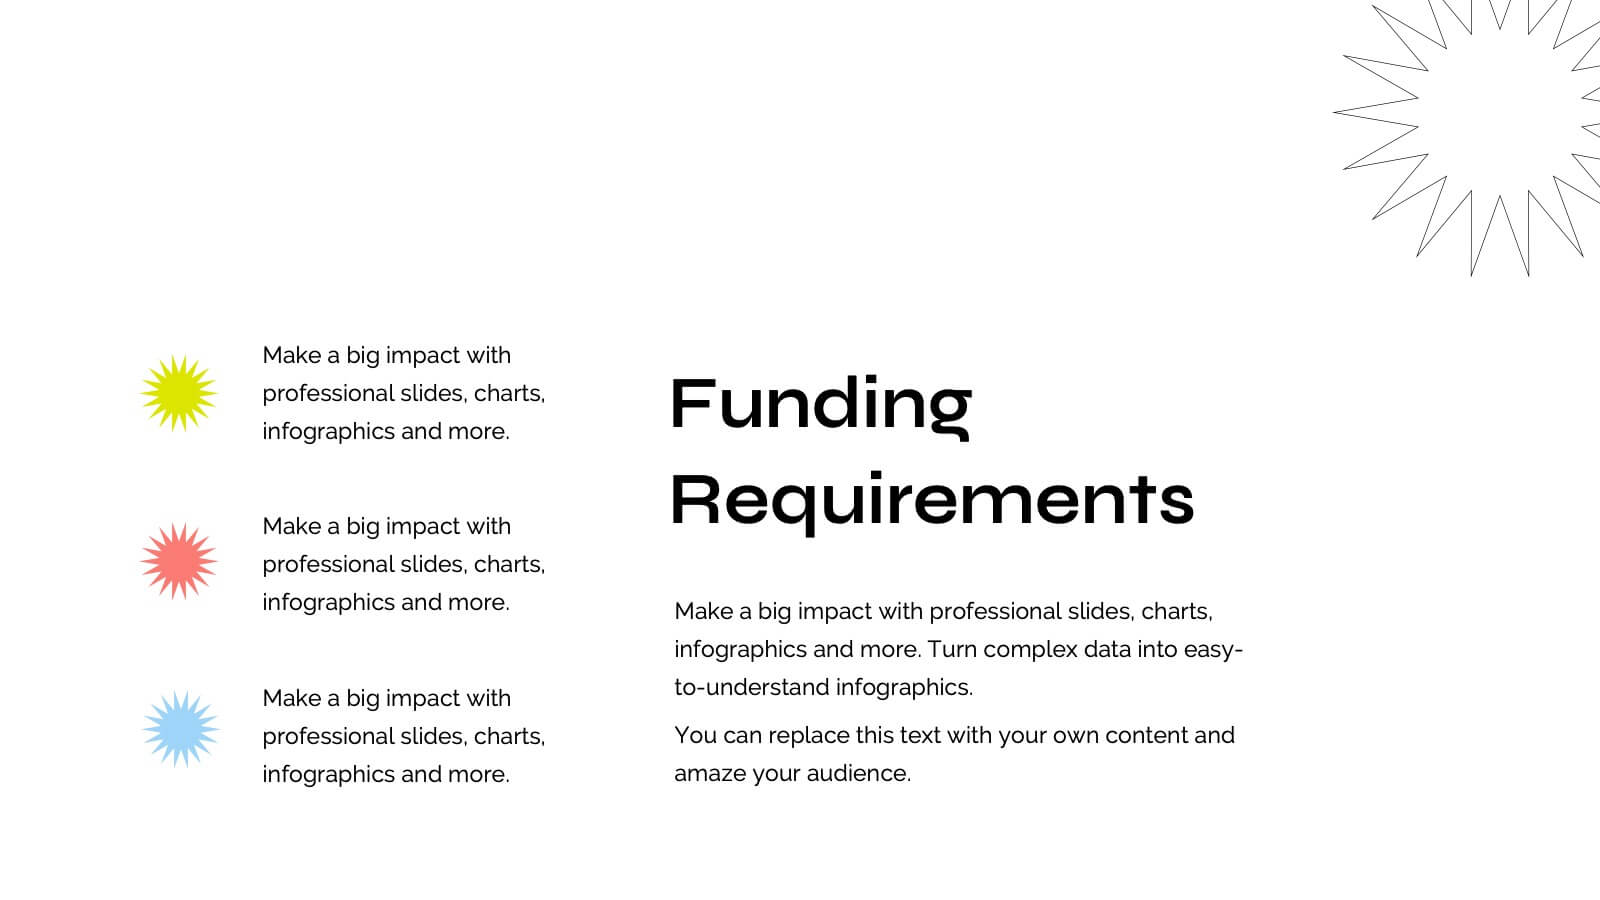
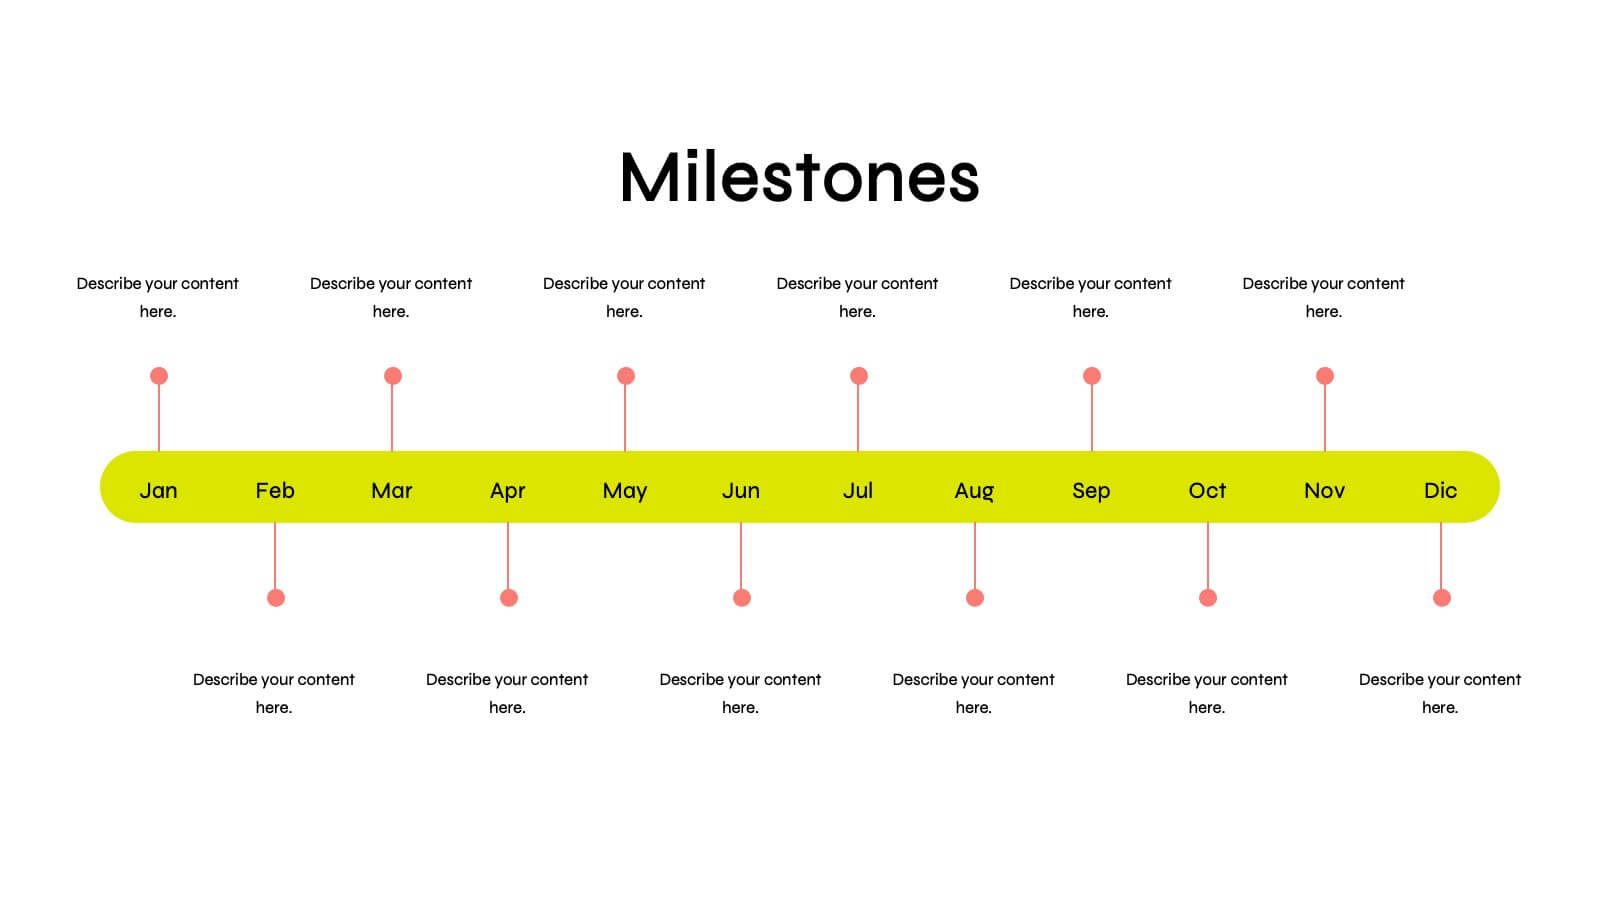
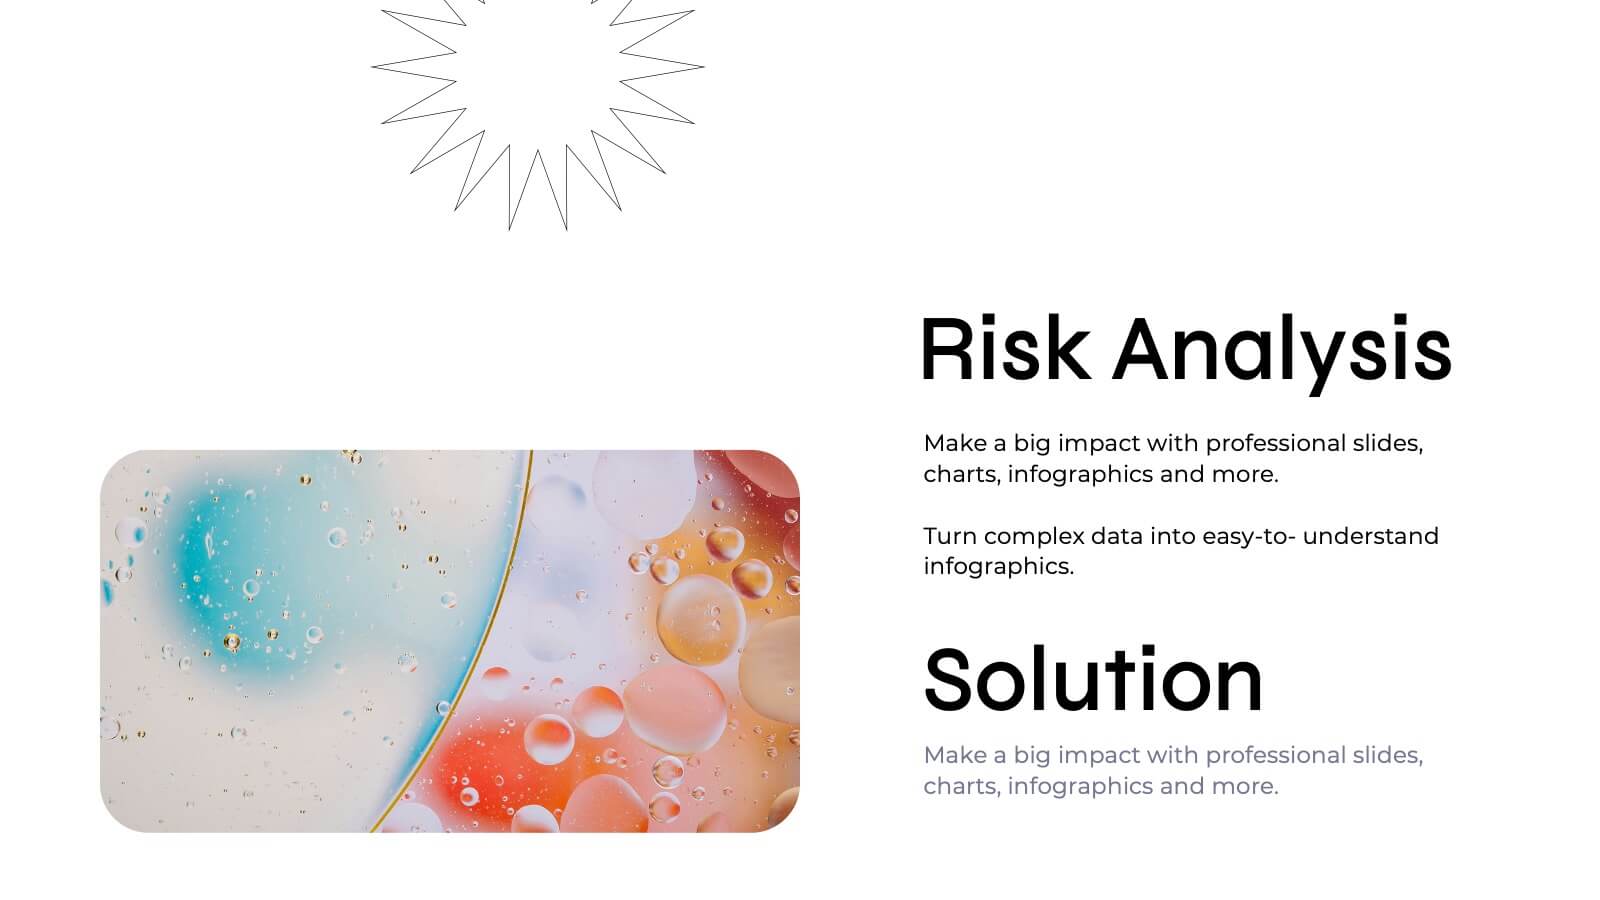
Quaver Annual Report Presentation
Deliver impactful annual reports with this professional presentation template, designed to showcase your company's progress and achievements with precision and clarity. This template is ideal for presenting financial summaries, performance metrics, strategic goals, and operational updates. The layout includes customizable slides for key highlights, risk assessments, project progress, and customer feedback summaries. Infographic elements and visual aids ensure complex data is easily understood, while dedicated sections for challenges, solutions, and recommendations facilitate meaningful discussions. Engage your audience with a clean design and logical structure that reflects professionalism. Compatible with PowerPoint, Google Slides, and Keynote, this template offers full customization to adapt to your branding and specific needs. Whether you're addressing stakeholders, team members, or external audiences, this presentation helps you communicate your accomplishments effectively. Save time and make a lasting impression with a polished and versatile design that aligns with your company’s vision.


8 slides
Cognitive Psychology and Decision Making
Unlock the logic behind human choices with this eye-catching presentation template that puts cognitive puzzles into perspective—literally. Dive into how thought patterns, mental shortcuts, and biases influence decision making, all illustrated through clean visuals and digestible layouts. Easily customizable for PowerPoint, Keynote, and Google Slides.


4 slides
Mind Mapping for Idea Expansion Presentation
Visualize your concepts clearly with this Mind Mapping for Idea Expansion presentation. Designed to help structure brainstorming sessions or strategic planning, this template organizes ideas around a central theme with clean, radial layouts. Ideal for creative teams and professionals. Fully editable in Canva, PowerPoint, and Google Slides.


10 slides
Water Cycle and Hydrological Study Presentation
Break down complex water cycle processes with this engaging diagram layout. Featuring a bottle-shaped center graphic with directional arrows, it’s perfect for illustrating hydrological stages or sustainability concepts. Fully editable in PowerPoint, Keynote, and Google Slides, making it ideal for educational, environmental, or scientific presentations. Clear, modern, and easy to use.


4 slides
Creative Title Slide Templates Presentation
Make a bold first impression with the Creative Title Slide Templates Presentation. Featuring a sleek, split-layout design with glowing blue abstract waves, this template combines modern aesthetics with functional clarity. Circular icons on the side offer quick visual cues for business categories or departments. Ideal for keynote introductions or professional project kickoffs. Compatible with PowerPoint, Keynote, and Google Slides.


5 slides
Workout Importance Infographics
Energize your audience with our dynamic workout importance infographics template. Bathed in the motivating shades of cream, blue, and orange, this collection is a powerhouse of fitness inspiration, perfect for personal trainers, fitness bloggers, health educators, and gym establishments. Compatible with Powerpoint, Keynote, and Google Slides. Its creative, fitness-oriented design showcases compelling graphics, icons, and image placeholders that vividly illustrate exercise routines, health stats, and motivational quotes. It's not just an infographic; it's your ally in promoting a healthy lifestyle, emphasizing the transformative power of physical activity.


6 slides
Asia Market Map Infographic
Asia is the largest and most populous continent on Earth, covering a vast area that includes diverse landscapes, cultures, and countries. This map infographic displays the countries, capitals, major cities, rivers, mountain ranges, and other Asia geographical features. This template can be used for various purposes, such as market research presentations, business reports, and marketing materials. This template showcases the business and economic landscape in the Asian market. This provides valuable insights into the economic landscape of various Asian countries and help businesses make informed decisions for market expansion and opportunities in the region.


6 slides
Business People Services Infographic
"Business People Services" refers to a range of professional services and solutions offered to individuals and organizations to help them succeed in the business world. This infographic template is a visual representation of various services tailored to meet the needs of business professionals. This template aims to provide a quick overview of these services and their benefits. The purpose of this infographic is to convey important information in an engaging format. Use concise text, relevant visuals, and a logical structure to make it easy for business professionals to understand and benefit from your data presented.


7 slides
5G Infographic Presentation Template
A 5G infographic is data related to the 5th generation of mobile telecommunications technology. This infographic template is an engaging way to display facts and figures, and attract attention from a wide audience. The main purpose of our 5G infographic template is to help you educate others about the new technology and its capabilities, and to help promote understanding of 5G. The information presented in this infographic can range from details, such as the differences between 5G and previous generations of mobile networks, and the benefits and potential applications of 5G.


5 slides
Energy Sources in The United States Infographics
Energy Sources in The United States Infographics is a bold, colorful, and modern presentation