


Features
- 6 Unique slides
- Fully editable and easy to edit in Microsoft Powerpoint, Keynote and Google Slides
- 16:9 widescreen layout
- Clean and professional designs
- Export to JPG, PDF or send by email


Do you have any questions?
Recommend


4 slides
Organic Farming Overview Presentation
Present your sustainable agriculture strategies with this organic farming overview template, featuring vibrant icons and clean layouts. Perfect for eco-friendly initiatives, farm project plans, and environmental reports. Fully editable in Canva, PowerPoint, and Google Slides, allowing you to adjust colors, icons, and text to align with your branding and goals.


7 slides
Africa Map Infographic Presentation Template
The African continent is home to a great deal of linguistic and cultural diversity. Africa has approximately one-third of the world's languages. There are at least seventy-five African languages with more than one million speakers. The diversity of Africa's languages is evidenced by their populations. This template features fully editable vector shapes of countries, national flags and lines to highlight routes across this diverse continent. Use this Africa map template to illustrate the countries of Africa and their borders. You can easily add information, such as other icons in the blank spaces.


6 slides
Gantt Chart Planner Infographic
A Gantt chart is a visual representation of a project schedule that helps in planning, scheduling, and tracking tasks over time. This infographic template is designed to display the timeline of a project, including the start and end dates of tasks, as well as their dependencies and progress. This infographic is ideal for project managers, teams, or individuals who need to communicate project timelines, tasks, and progress in a clear and organized manner. Choose a color scheme that aligns with the project or company's brand identity for a professional look. This is fully customizable and compatible with Powerpoint, Keynote, and Google Slides.


2 slides
Online Course Structure and Syllabus Deck Presentation
Welcome students with a vibrant and modern course intro slide. This template is perfect for online educators outlining course objectives and syllabus details. Features an image placeholder and text sections for clear communication. Fully editable in PowerPoint, Keynote, and Google Slides—ideal for virtual learning environments and eLearning programs.


5 slides
Business Comparison Infographics
Elevate your business presentations with our business comparison infographics, the perfect tool for showcasing competitive analysis. In a striking array of orange and red tones, these infographics are designed to command attention. Entrepreneurs, business analysts, and students of business studies can leverage this template. Compatible with Powerpoint, Keynote, and Google Slides. Its creative style integrates compelling graphics and icons, simplifying complex data into digestible, engaging visuals. Ideal for meetings, or educational content, these infographics offer a clear, comparative insight, empowering informed business decisions.


5 slides
Data Density Visualization via Heat Mapping Presentation
Turn complex datasets into clear insights with the Data Density Visualization via Heat Mapping Presentation. This layered area chart template is perfect for showcasing data intensity over time—ideal for monthly trends, usage spikes, or multi-variable performance analysis. Fully customizable in Canva, PowerPoint, Keynote, and Google Slides.


12 slides
Corporate Hierarchy Structure Presentation
Showcase your Corporate Hierarchy Structure with a sleek and professional design. This template helps visualize organizational roles, reporting relationships, and team structures for clear communication. Perfect for HR teams, business leaders, and project managers, it’s fully customizable and compatible with PowerPoint, Keynote, and Google Slides for easy editing.


7 slides
Union Venn Diagram Infographic
Venn Diagrams are a great way to display your data in an organized, aesthetically pleasing way. This infographic template is perfect for any presentation that requires a Venn Diagram. This template is designed to visually demonstrate the impact of your company's efforts. Use this to show how different teams work to achieve goals, or how different departments work together to create something new. Compatible with Powerpoint, Keynote, and Google Slides. This infographic uses a cool, bold color scheme and fun imagery to show the relationship between two or more sets of data in a way that will help you easily explain it to your target audience.


7 slides
Relationship Polices Infographic
Navigate the intricacies of interpersonal dynamics with our relationship policies infographic. Adorned in the purity of white, complemented by shades of understanding blue and harmonious green, this template elucidates the principles and boundaries that shape healthy relationships. Detailed with relevant infographics, symbolic icons, and illustrative image placeholders, it provides a visual roadmap to successful connections and interactions. Impeccably designed for Powerpoint, Keynote, or Google Slides. An essential tool for HR professionals, relationship counselors, team leaders, or any organization emphasizing healthy interpersonal dynamics. Foster connections; let each slide guide the way to relationship excellence.


4 slides
Social Media Content Strategy Presentation
Engage your audience with this Social Media Content Strategy Presentation. Featuring side-by-side thumbs-up icons, this template visually contrasts two key focus areas—ideal for comparing campaign goals, content pillars, or platform strategies. Each section includes editable text blocks to outline insights clearly. Fully customizable and compatible with PowerPoint, Keynote, and Google Slides.


22 slides
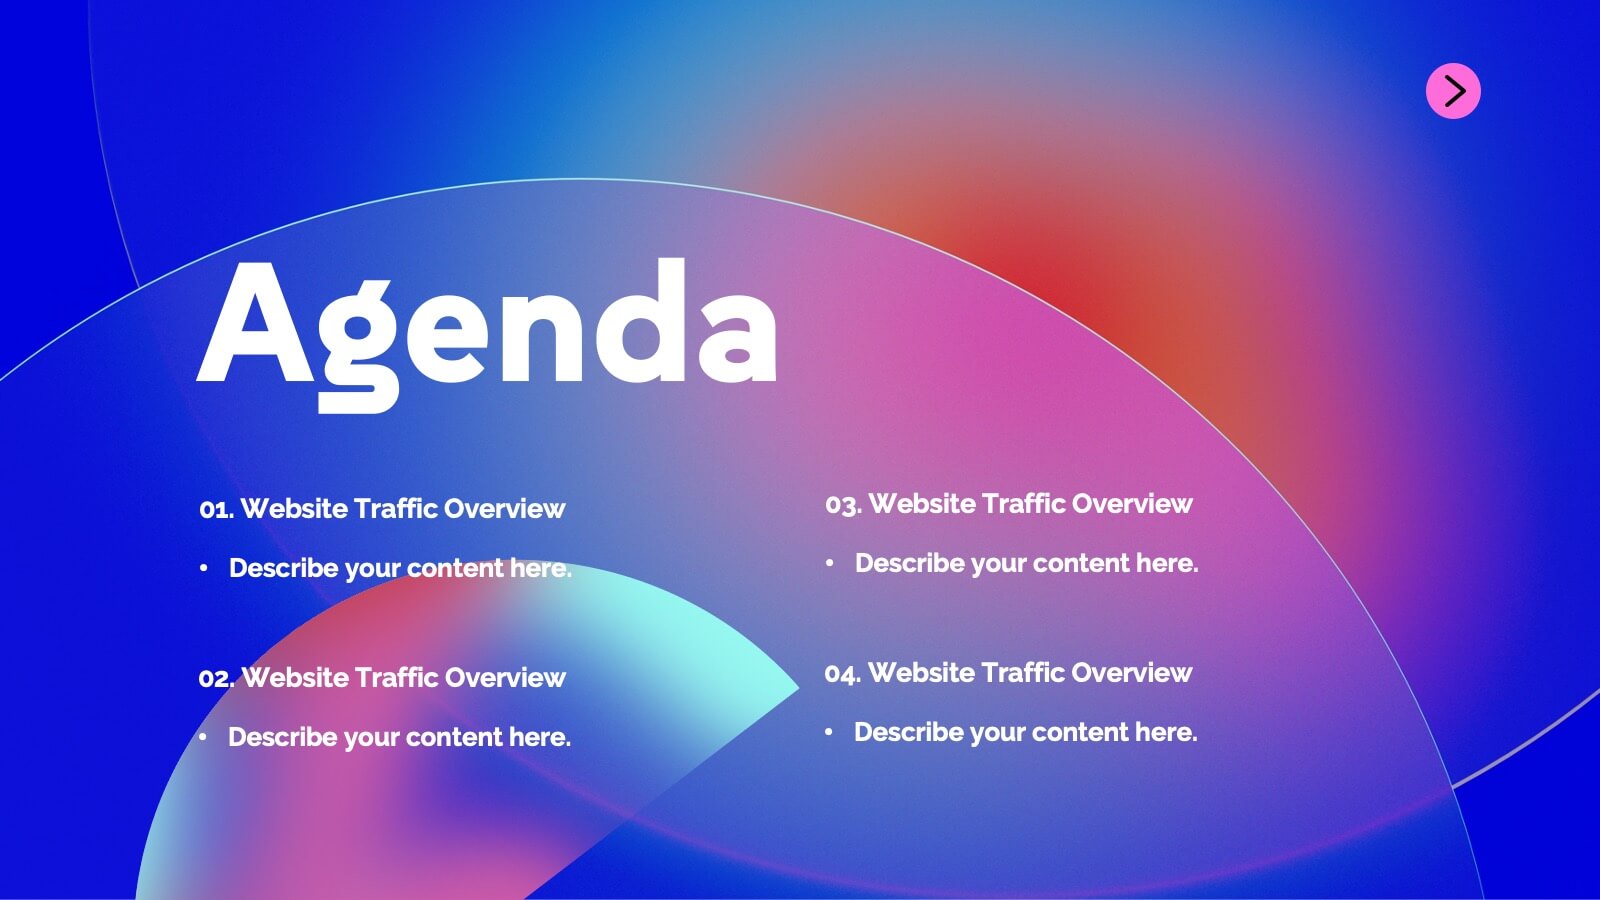
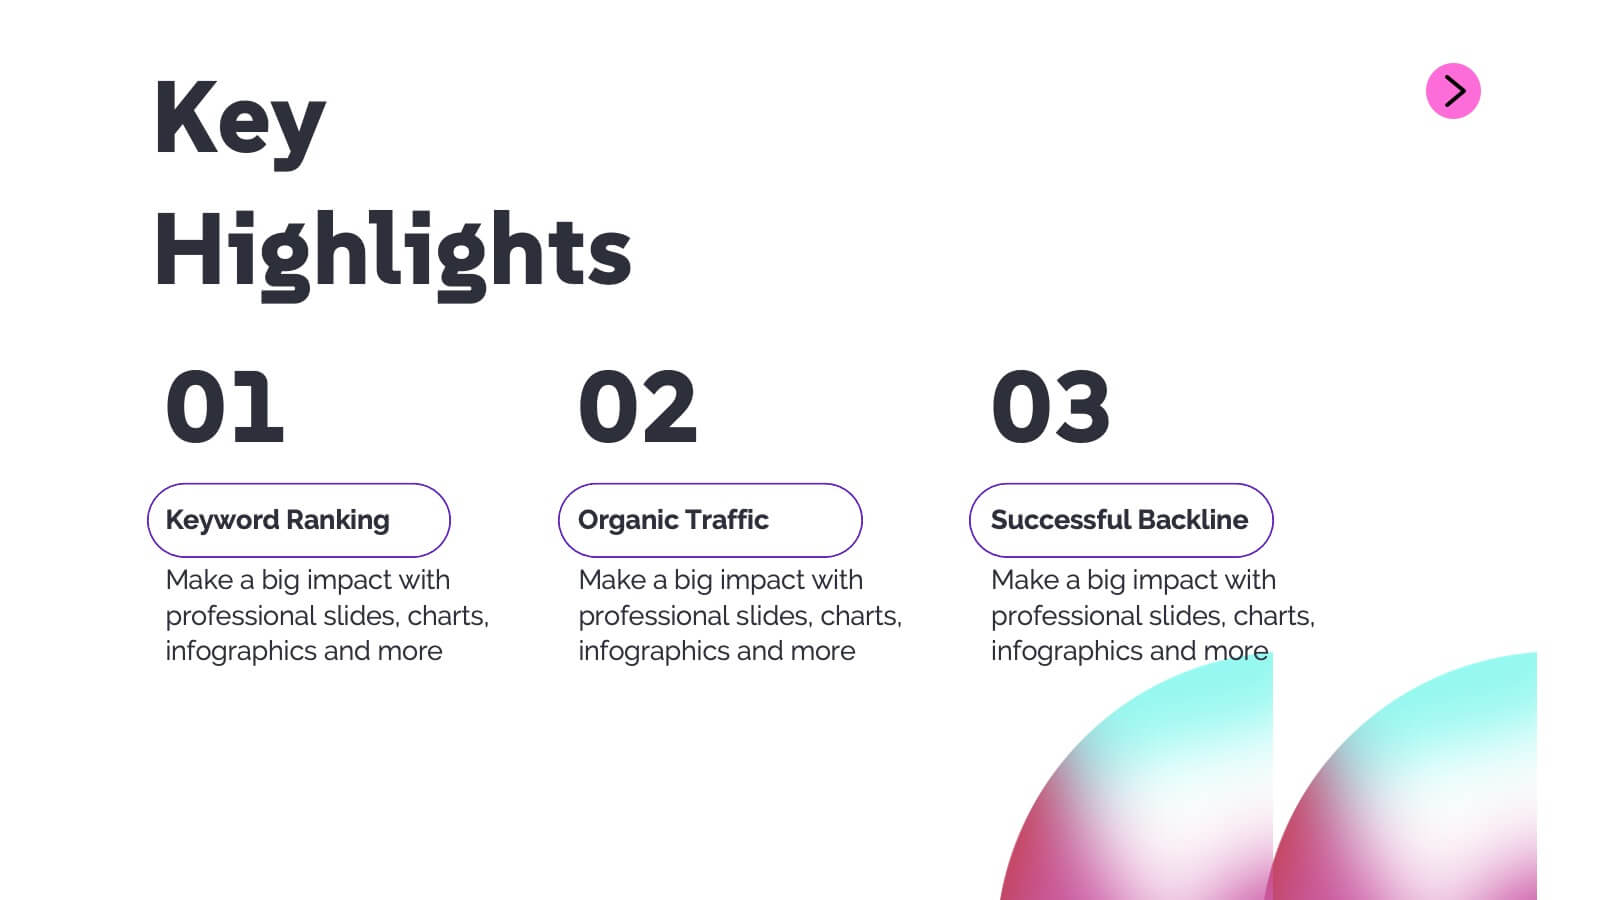
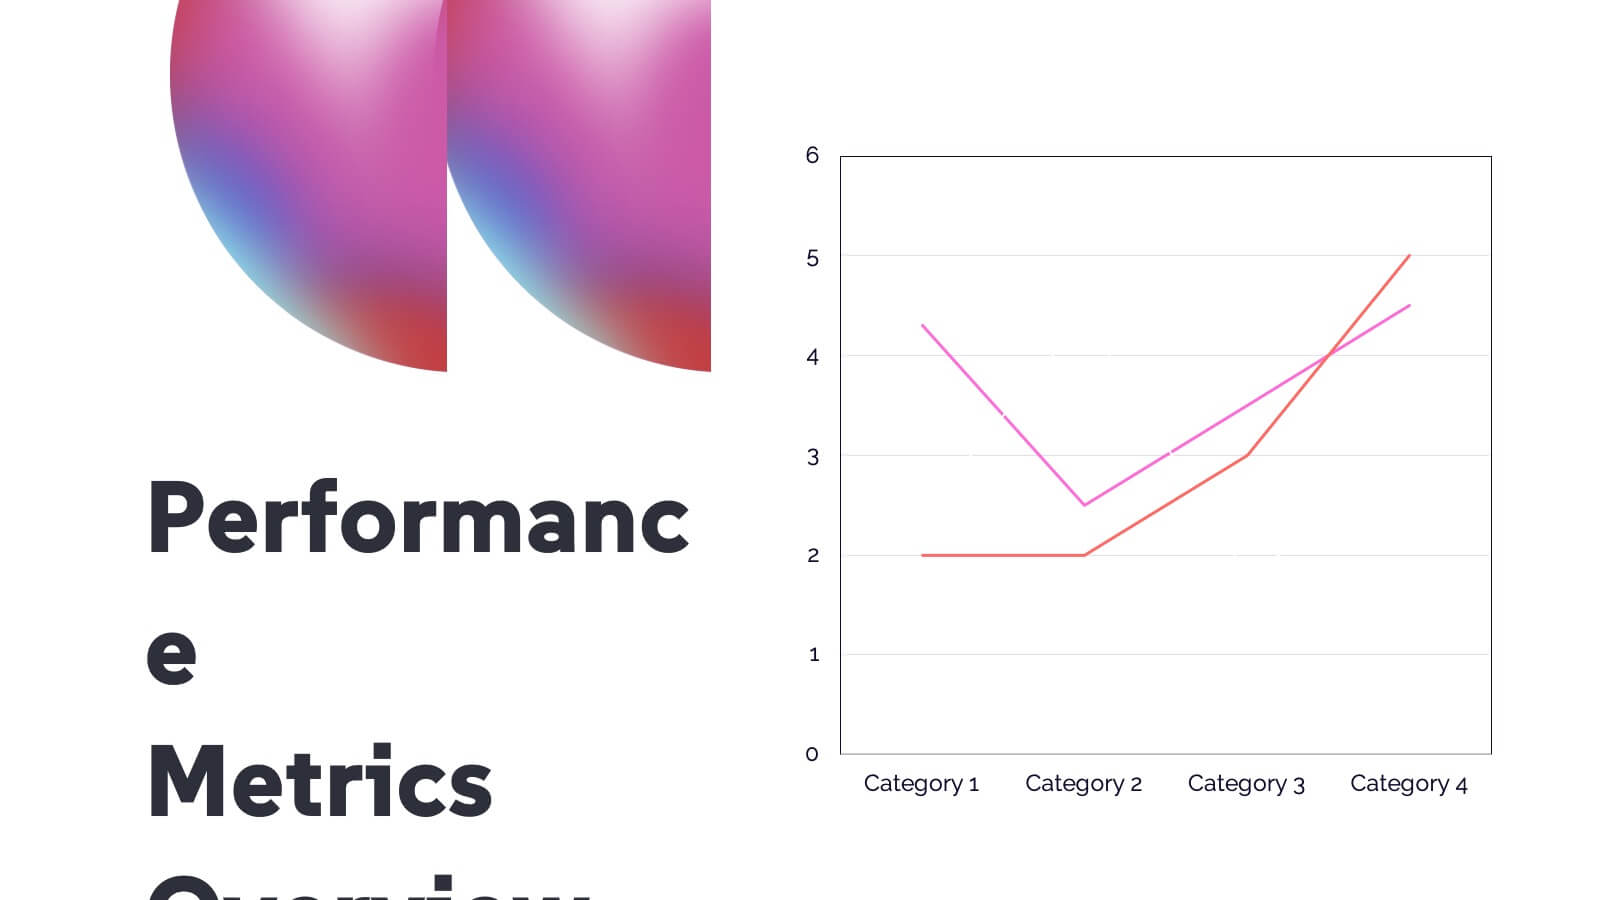
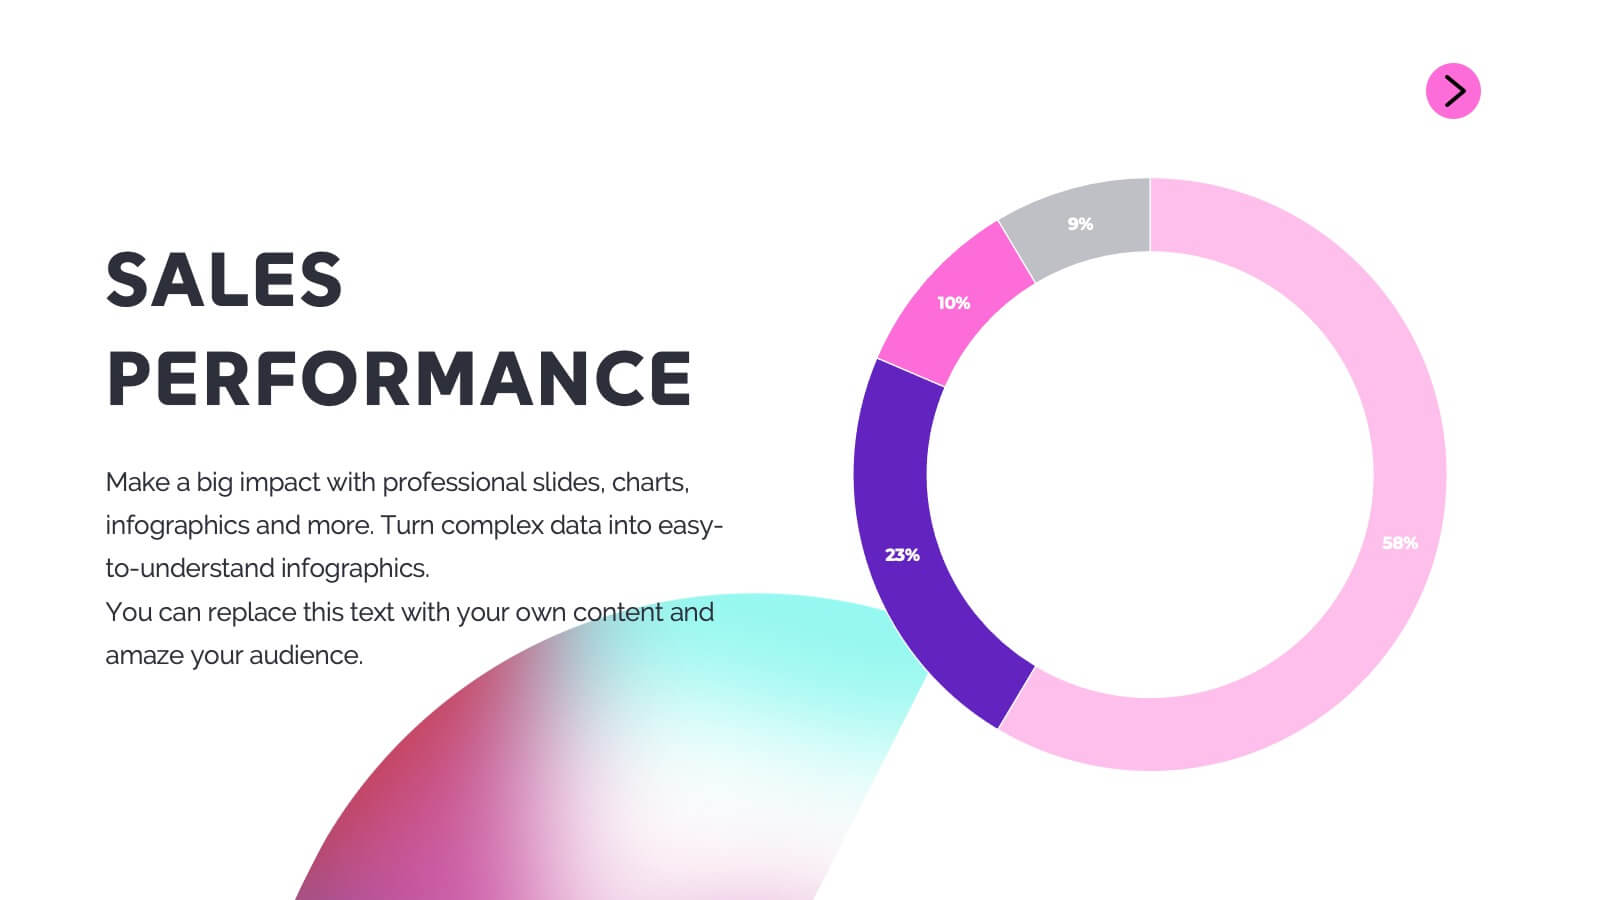
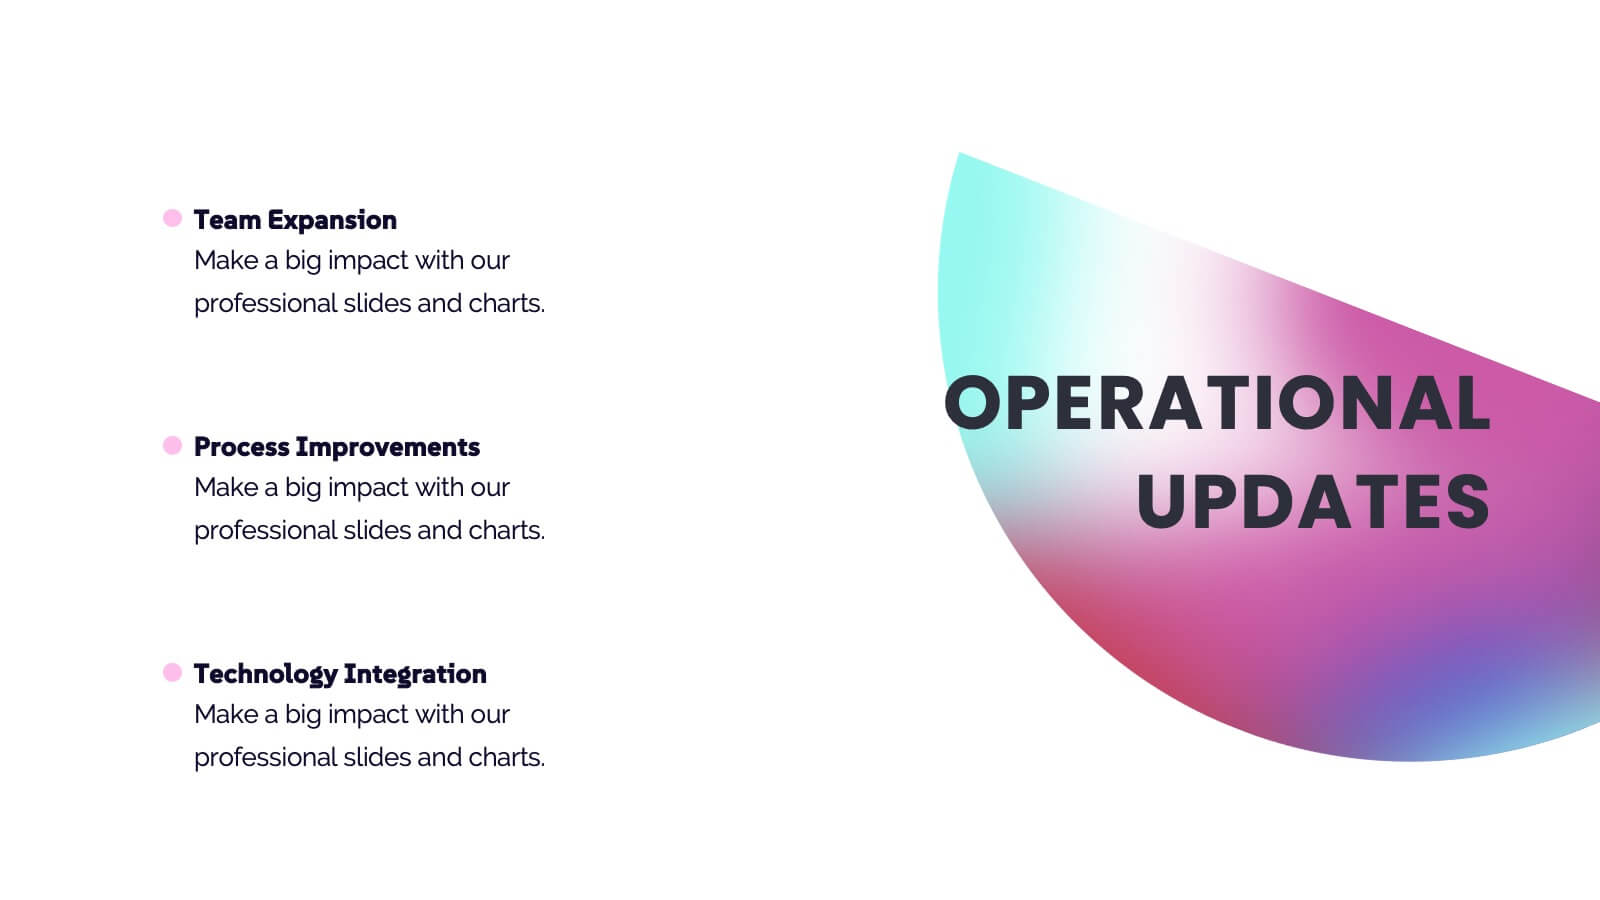
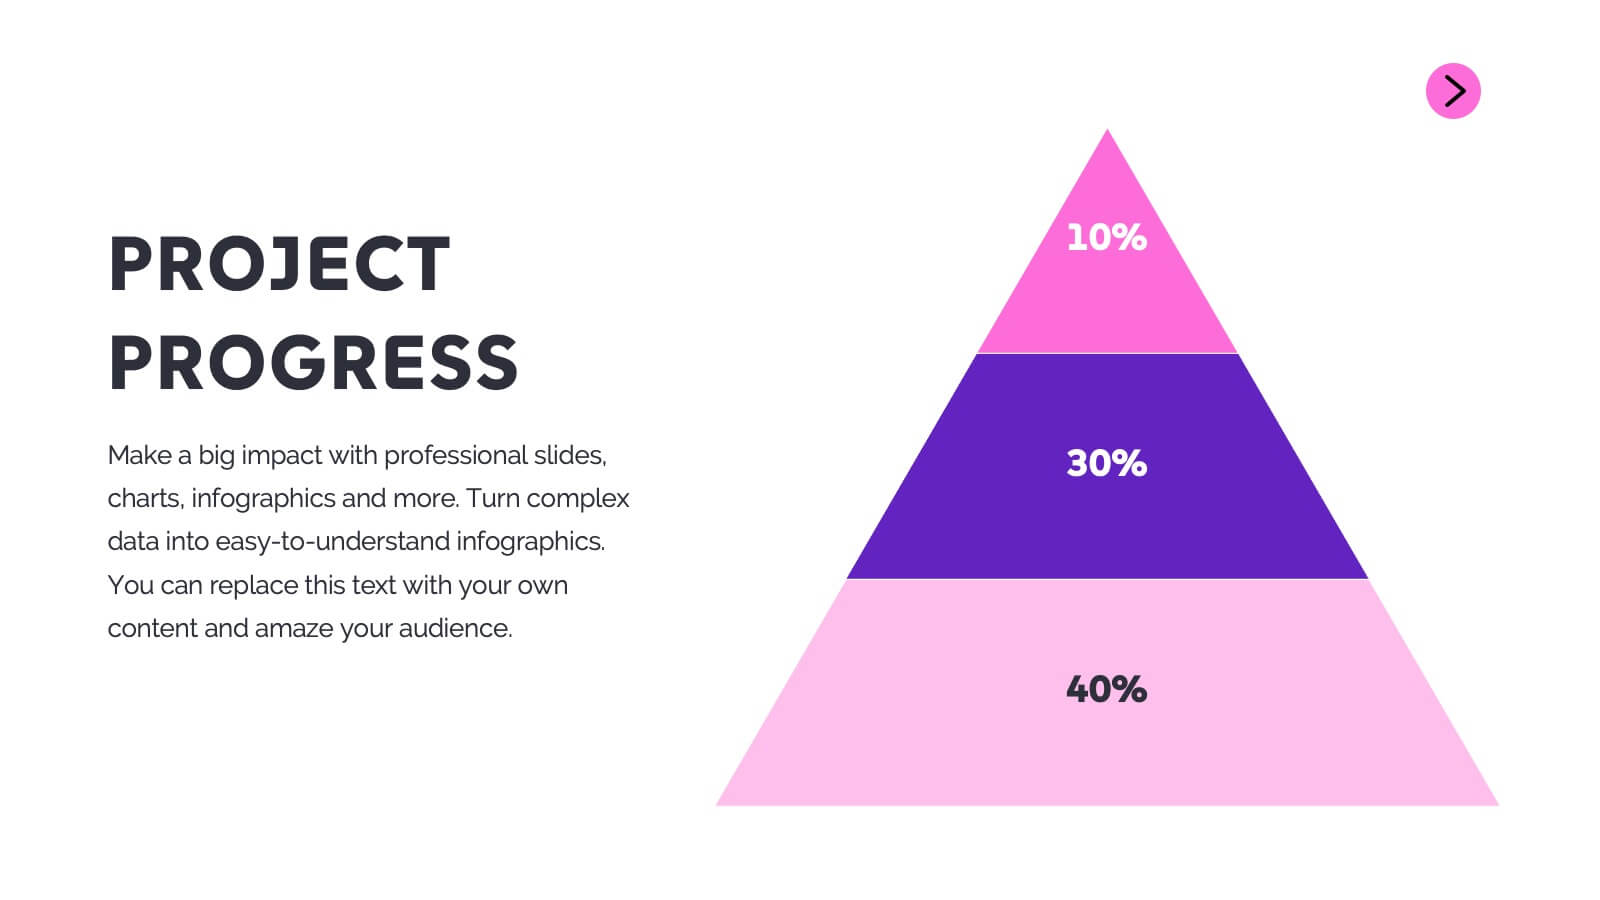
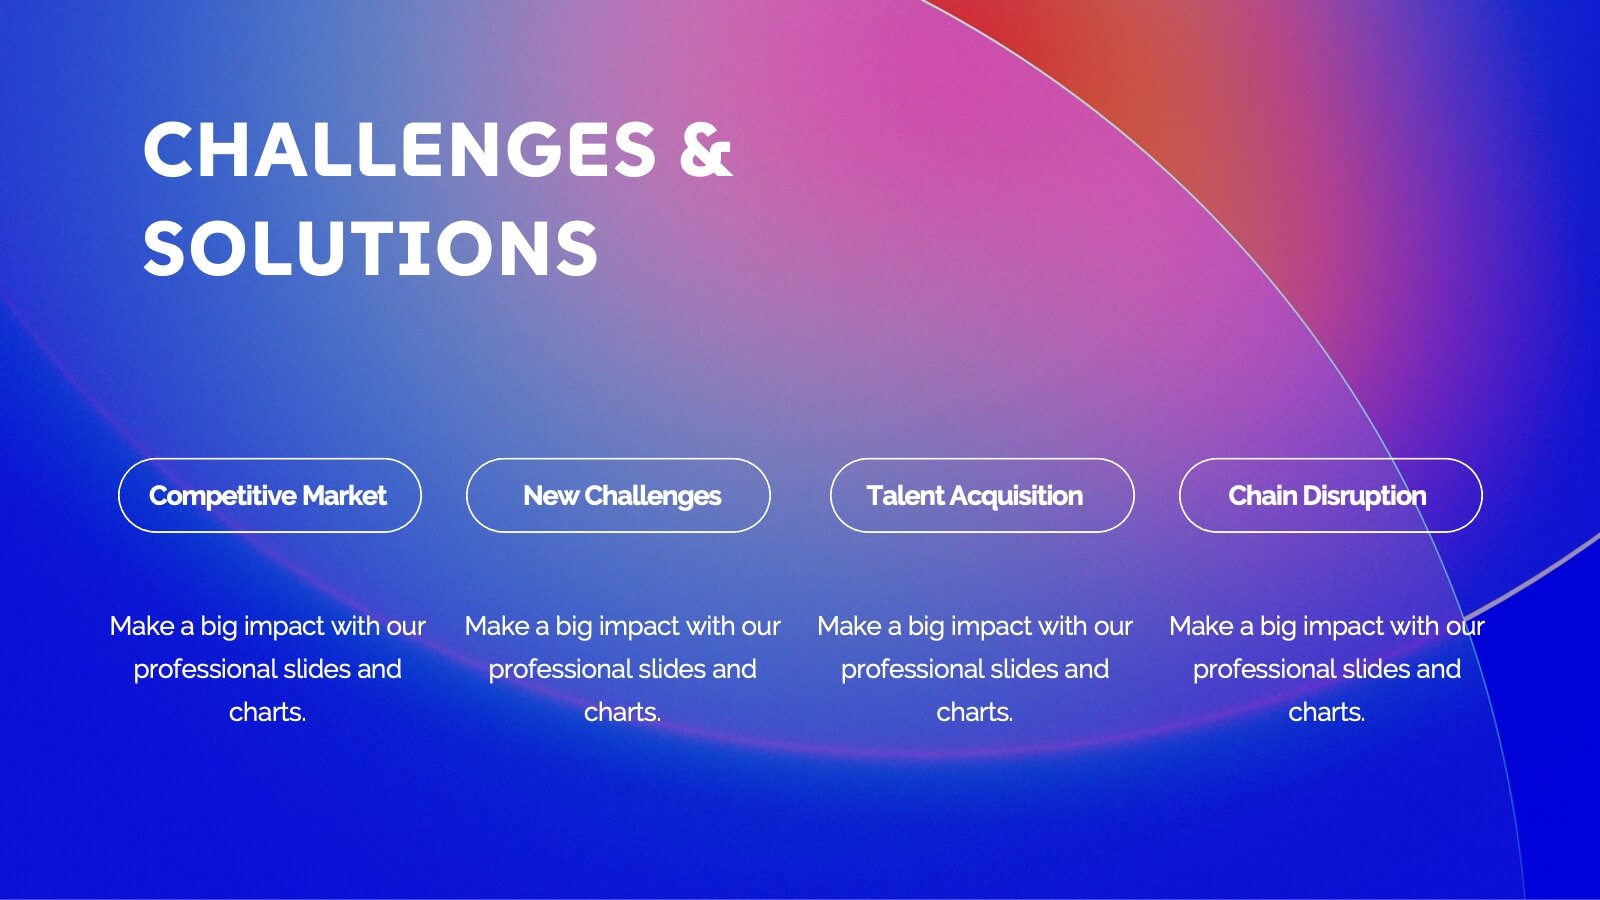
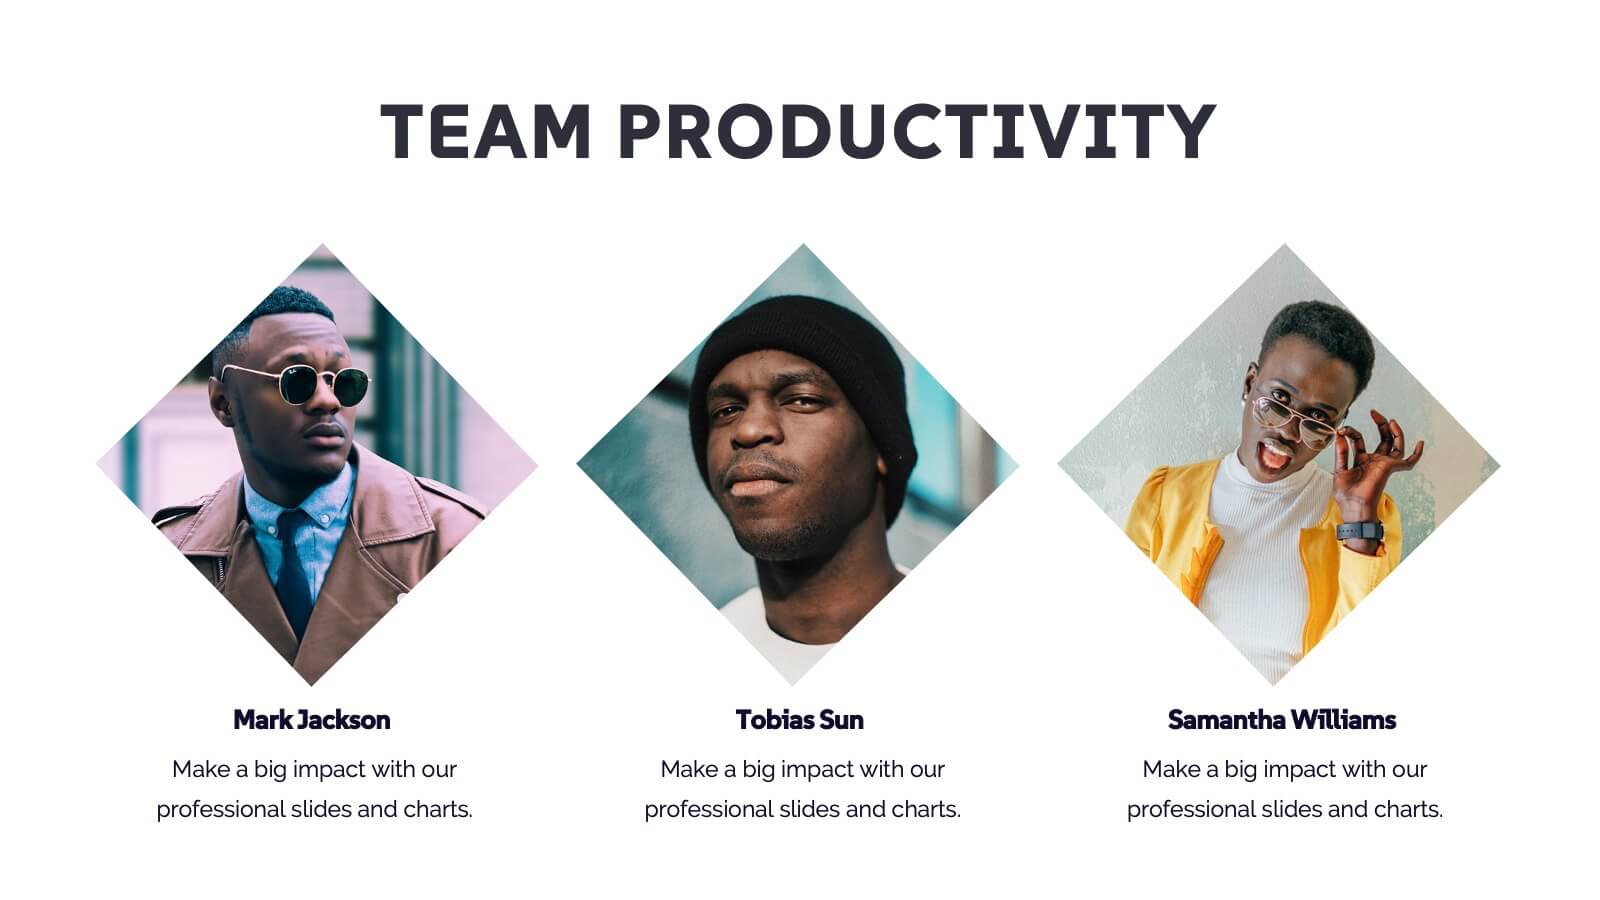
Sphinx Project Status Report Presentation
This modern project status report template is perfect for tracking progress and highlighting key achievements. It includes sections for performance metrics, financial summaries, challenges, and strategic initiatives. Keep stakeholders informed with clear, concise updates. Compatible with PowerPoint, Keynote, and Google Slides for easy customization and presentation.


7 slides
Organizational Structure with 7S Model Presentation
Bring your organizational framework to life with a clean, modern layout that makes complex relationships easy to understand. This presentation helps you explain key elements, show how they connect, and guide strategic discussions with clarity and structure. Fully editable and compatible with PowerPoint, Keynote, and Google Slides.


5 slides
Coffee Brewing Methods Infographics
Coffee brewing methods refer to the various techniques and processes used to extract flavor and aroma from coffee beans. These infographic templates are a visually appealing and informative presentation tool designed to showcase various methods of brewing coffee. Whether you're a coffee enthusiast, a barista, or someone interested in learning more about coffee preparation, this template provides an engaging way to explore different brewing techniques and their unique characteristics. These allows you to showcase and educate others about various coffee brewing techniques. Fully customizable and compatible with Powerpoint, Keynote, and Google Notes.


8 slides
Customer Demographics Target Market Presentation
Dive into the depths of your audience with the "Customer Demographics Target Market" presentation template. Ideal for marketers and businesses aiming to understand and segment their customer base effectively, this template offers a vibrant, clear visual breakdown of demographic data. Ensure your strategic communications resonate with the right crowd, with compatibility for PowerPoint, Keynote, and Google Slides.


20 slides
Harmony Sales Forecast Presentation
Elevate your sales forecasting presentations with this vibrant and engaging template! Designed to captivate your audience, it covers all critical areas such as objectives, strategy, performance metrics, and opportunities. Keep your team motivated with visually striking layouts and an easy-to-follow structure. Compatible with PowerPoint, Keynote, and Google Slides for seamless integration!


8 slides
Business Purpose and Mission Alignment Presentation
Clarify your organization’s direction with this step-by-step alignment slide. Featuring four sequential stages, each with icons, numbers, and customizable text boxes, this layout helps visually communicate how your business goals align with your mission. Perfect for strategic planning, team alignment workshops, and leadership presentations. Fully editable and compatible with PowerPoint, Keynote, and Google Slides.


4 slides
Layered Pyramid Structure Diagram Presentation
Break down your data into visual layers with this Layered Pyramid Structure Diagram presentation. Ideal for showing proportions, hierarchies, or step-based processes, each pyramid tier is color-coded and labeled with editable titles and percentage values. Fully customizable in Canva, PowerPoint, and Google Slides to match your business or educational needs.