


Features
- 21 Unique Slides
- Fully editable and easy to edit in Microsoft Powerpoint, Keynote and Google Slides
- 16:9 widescreen layout
- Clean and professional designs
- Export to JPG, PDF or send by email


Do you have any questions?
Recommend


6 slides
Business Security Compliance Presentation
Visualize your security framework with this clear and modern infographic layout. This slide is ideal for presenting compliance steps, risk assessments, or regulatory requirements, featuring a shield-centered hub with 5 editable sections. Customize easily in PowerPoint, Keynote, or Google Slides.


5 slides
Project Management Plan Presentation
Bring structure and clarity to every phase of your workflow with this clean, arrow-based layout designed to outline tasks, milestones, and key deliverables. This presentation makes planning feel organized, engaging, and easy to follow for any audience. Fully editable and ready to use in PowerPoint, Keynote, and Google Slides.


4 slides
Technology Device Mockup Presentation
Bring your ideas to life with a sleek, modern slide that showcases your digital product in a clean smartphone mockup. This presentation explains key features or app benefits with clear, structured text that keeps your message focused and professional. Fully compatible with PowerPoint, Keynote, and Google Slides for easy editing and use.


5 slides
Project Scope Management Structure Presentation
Zoom in on every critical stage with the Project Scope Management Structure Presentation. This visual template uses magnifying glass graphics to represent five key project phases, helping you highlight detailed scope elements clearly. Fully editable in PowerPoint, Keynote, and Google Slides, it's perfect for structured planning and reporting presentations.


20 slides
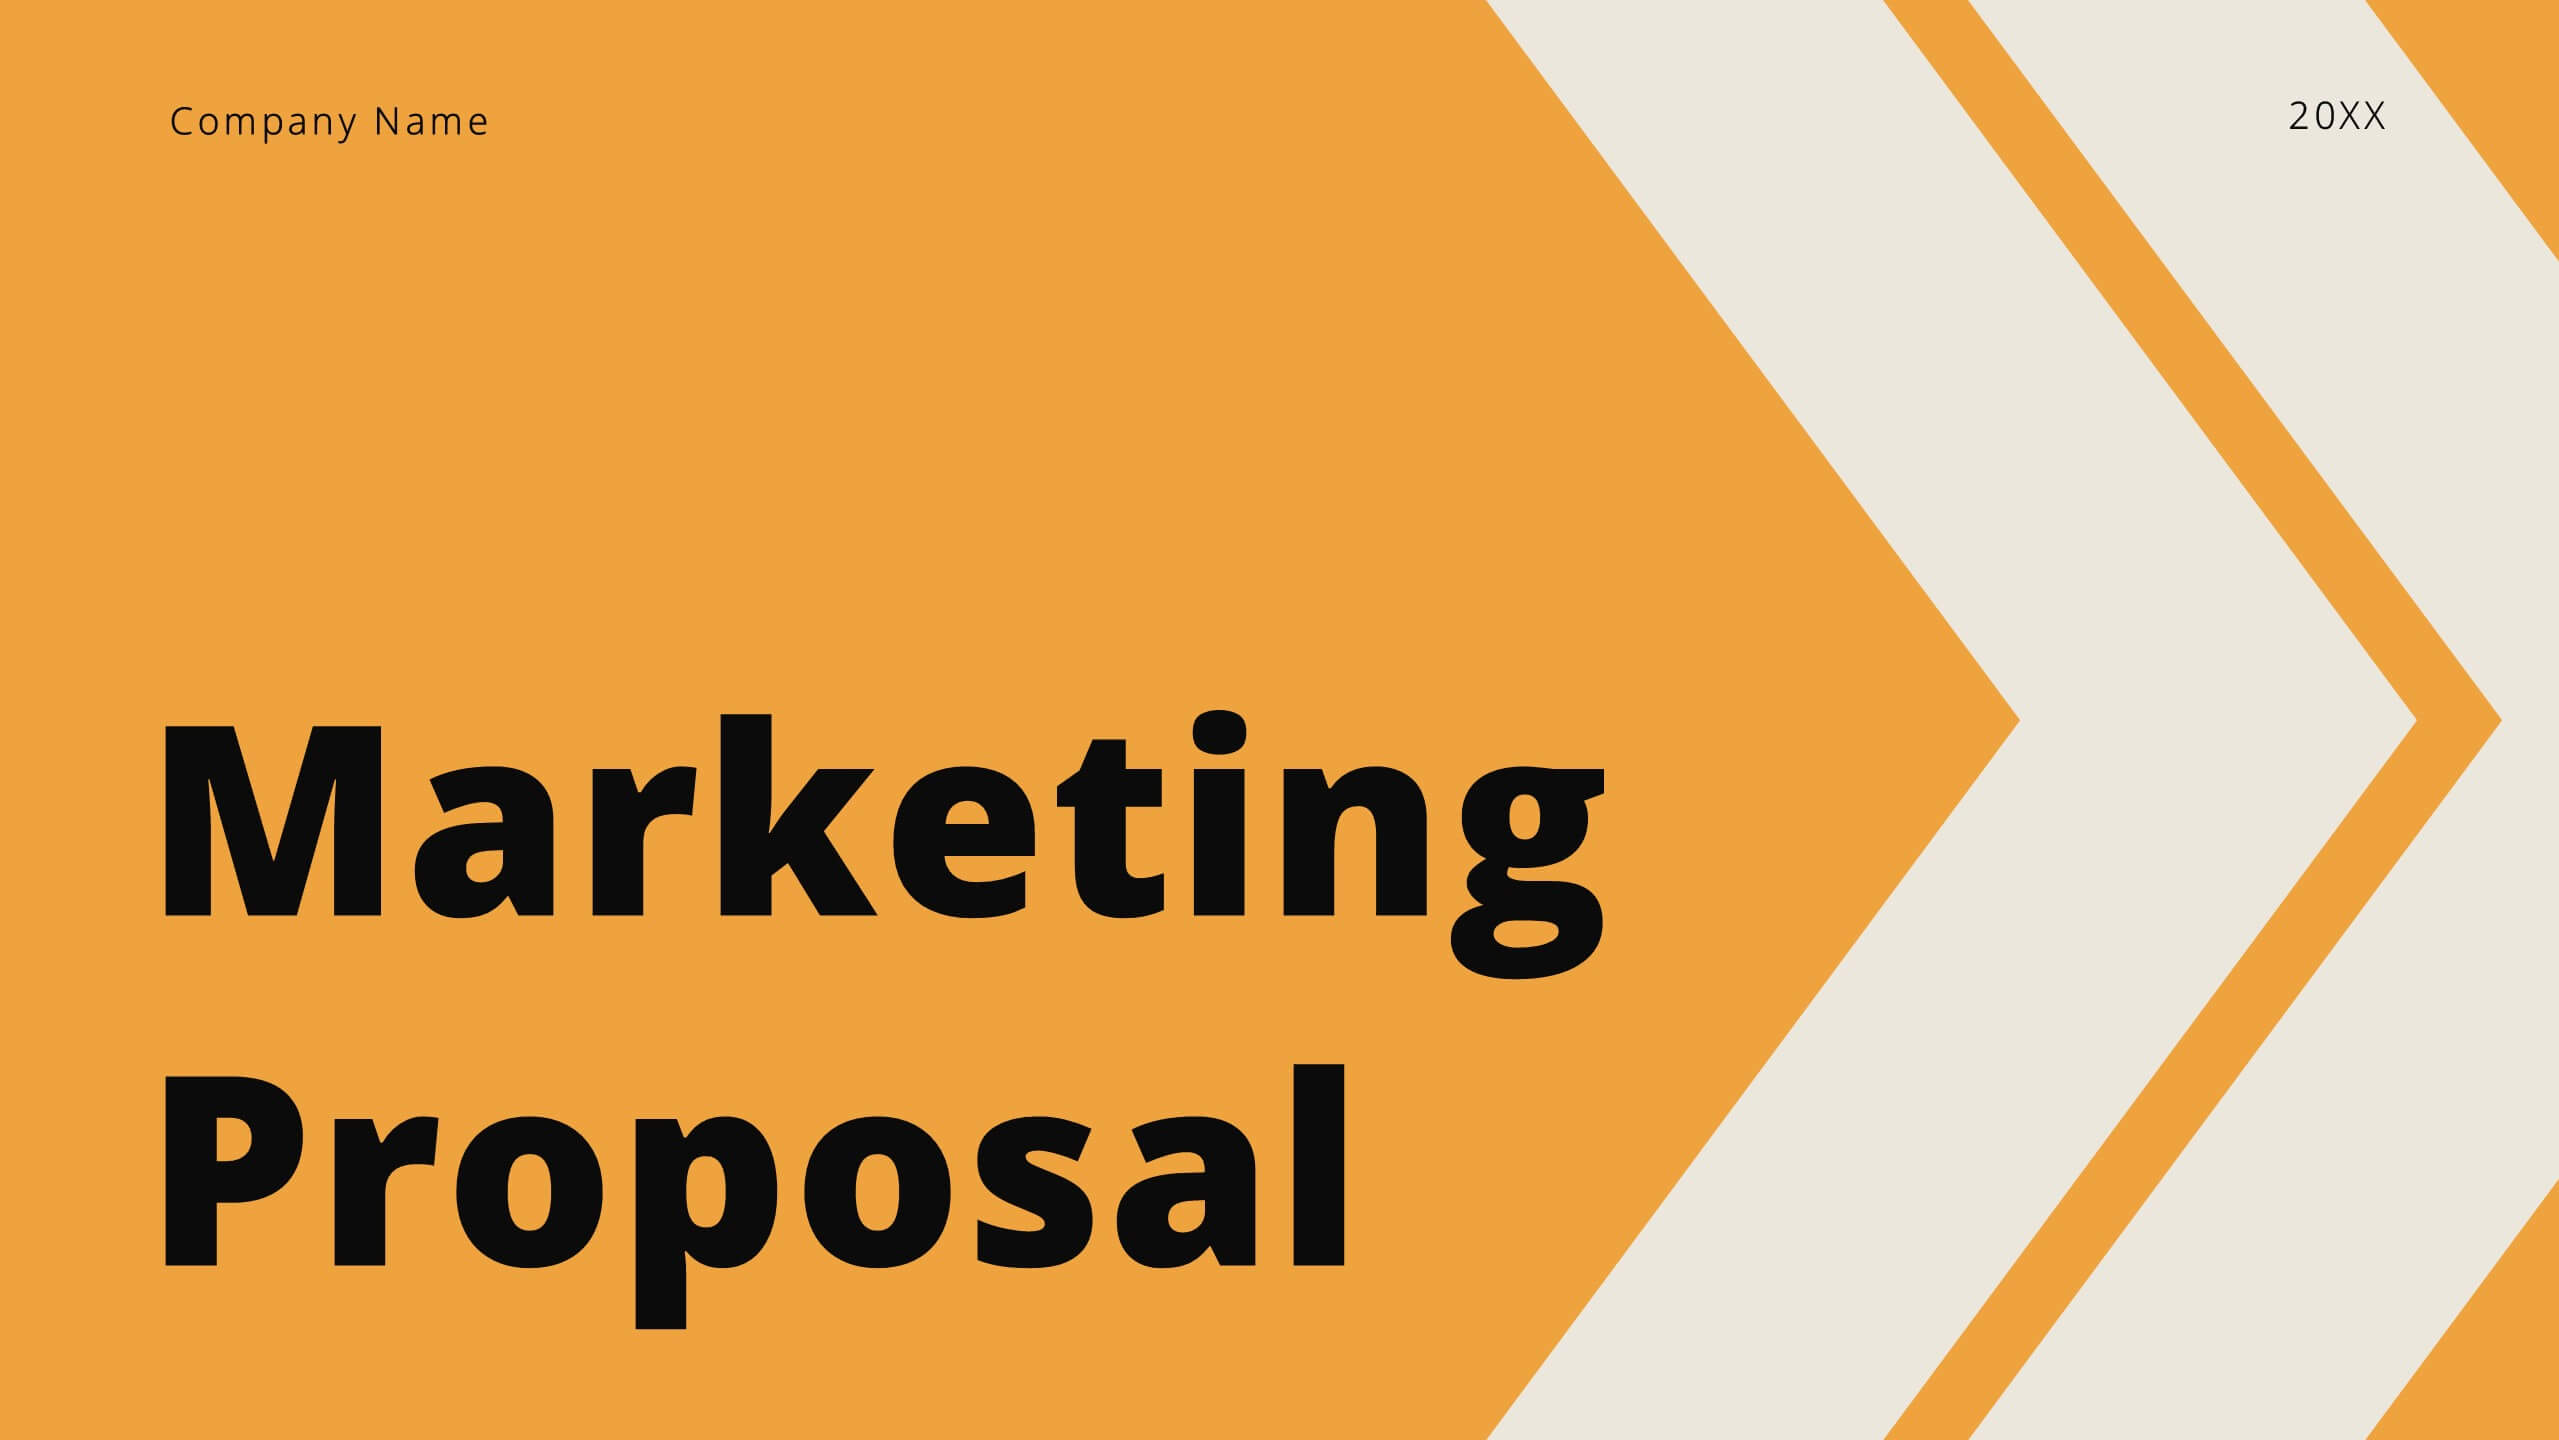
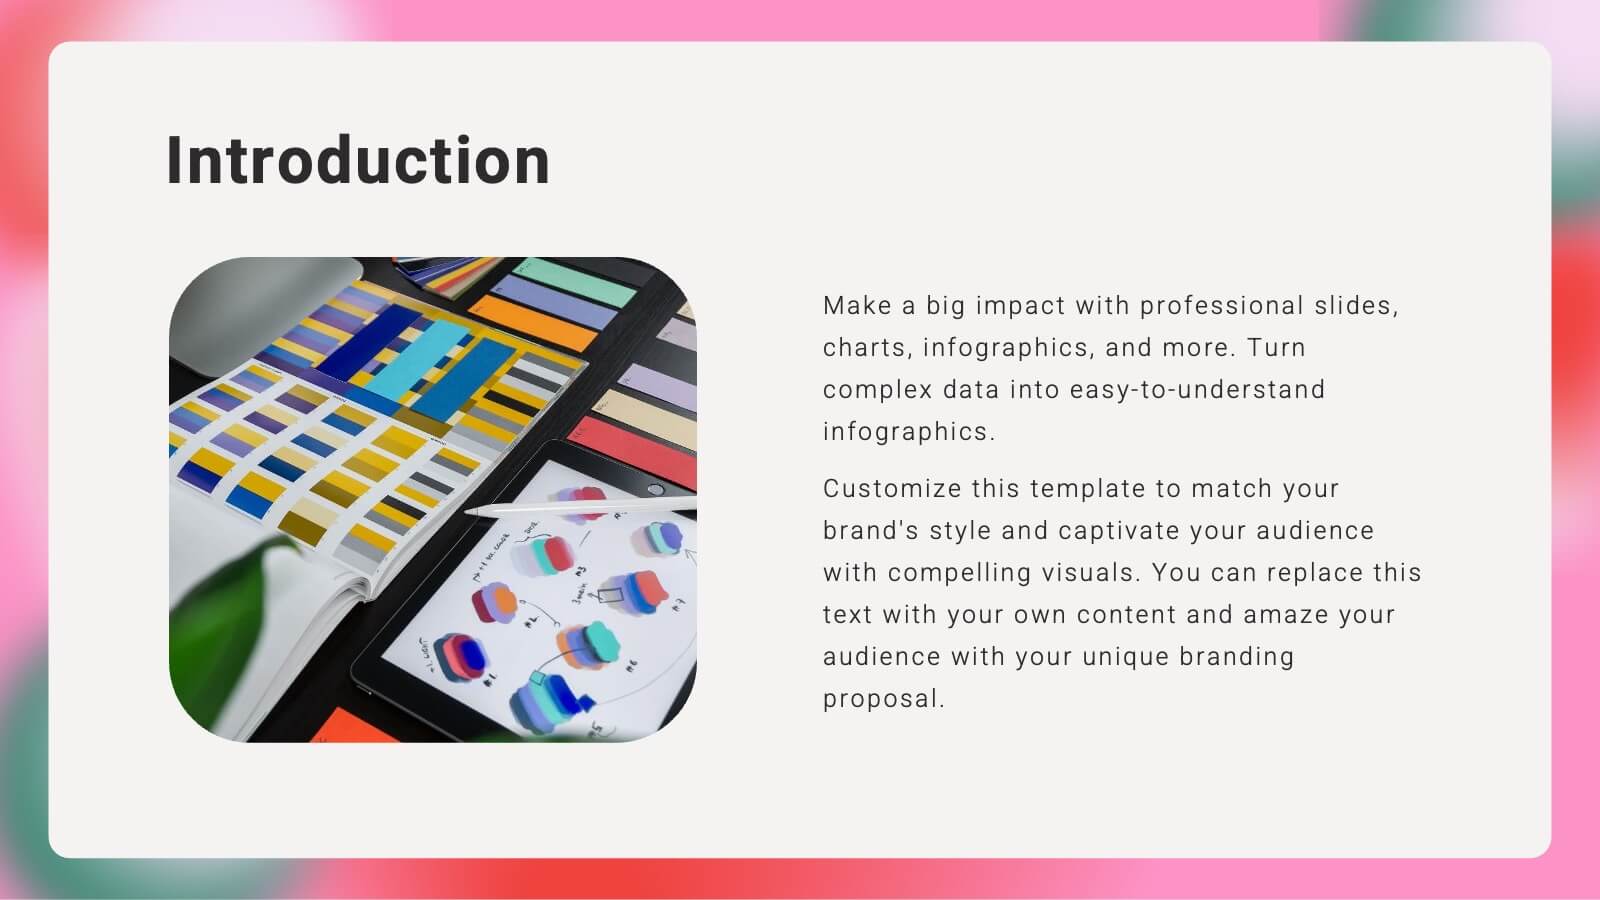
Nexisphere Marketing Proposal Presentation
Showcase your marketing plan with this proposal deck, featuring sections on consumer analysis, digital trends, influencer strategies, and SEO insights. Ideal for presenting a comprehensive marketing approach, it’s compatible with PowerPoint, Keynote, and Google Slides, offering flexibility for engaging presentations tailored to any audience.


6 slides
Year-End Review and Financial Report Presentation
Summarize your business year clearly with the Year-End Review and Financial Report Presentation. This clean, modern layout uses quarterly donut charts and monthly timelines to help visualize performance at a glance. Ideal for financial recaps and executive meetings. Fully editable in Canva, PowerPoint, and Google Slides for easy updates and branding.


23 slides
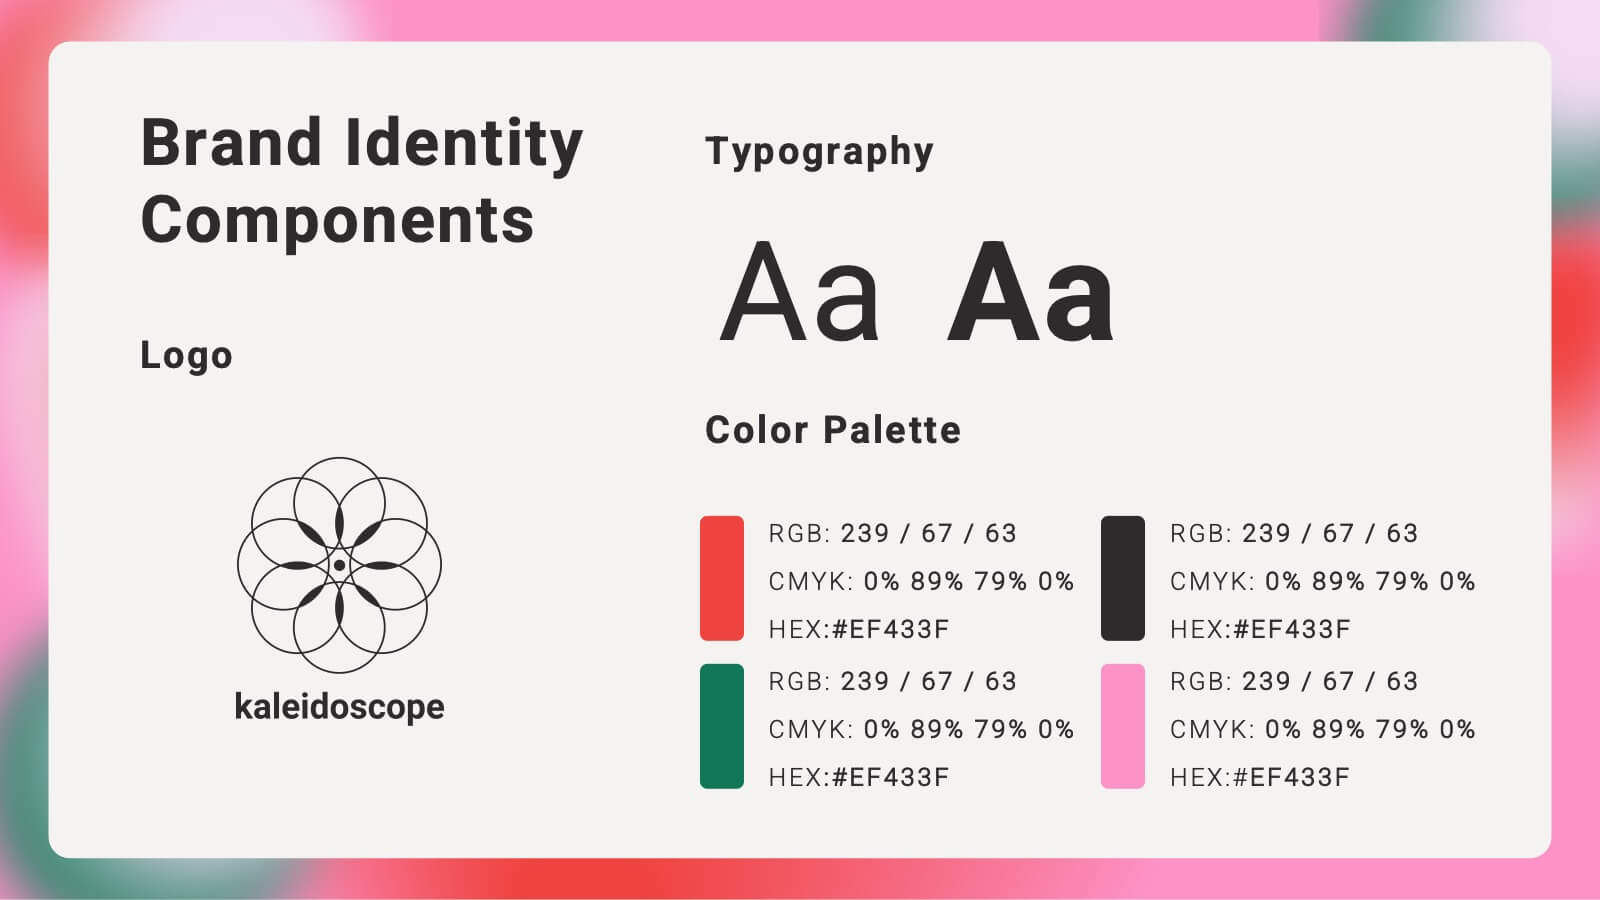
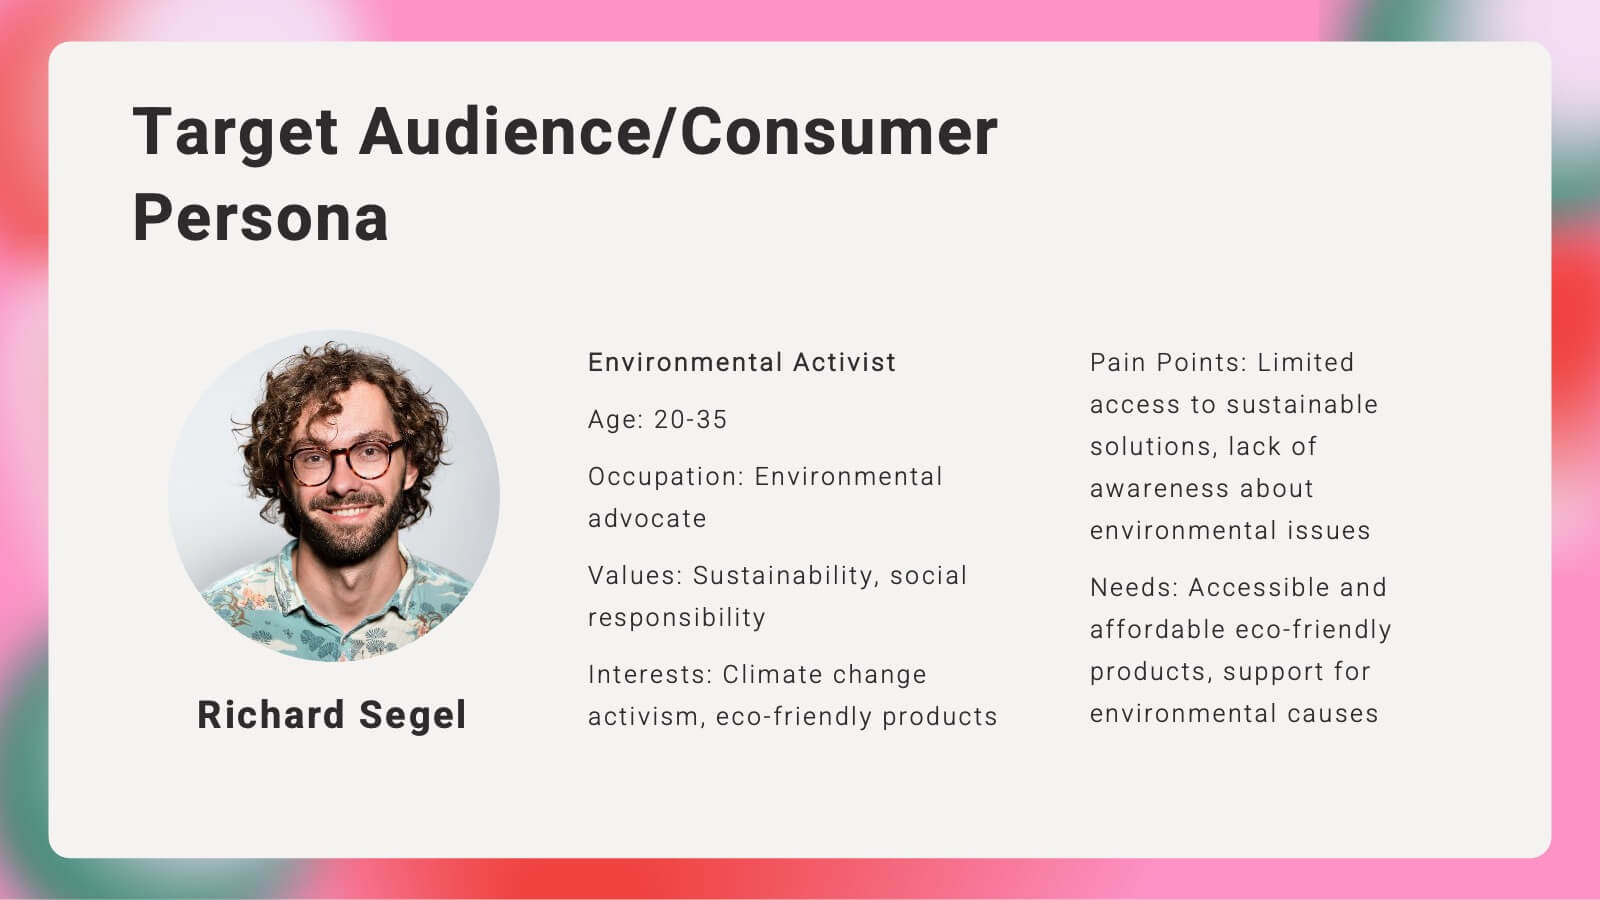
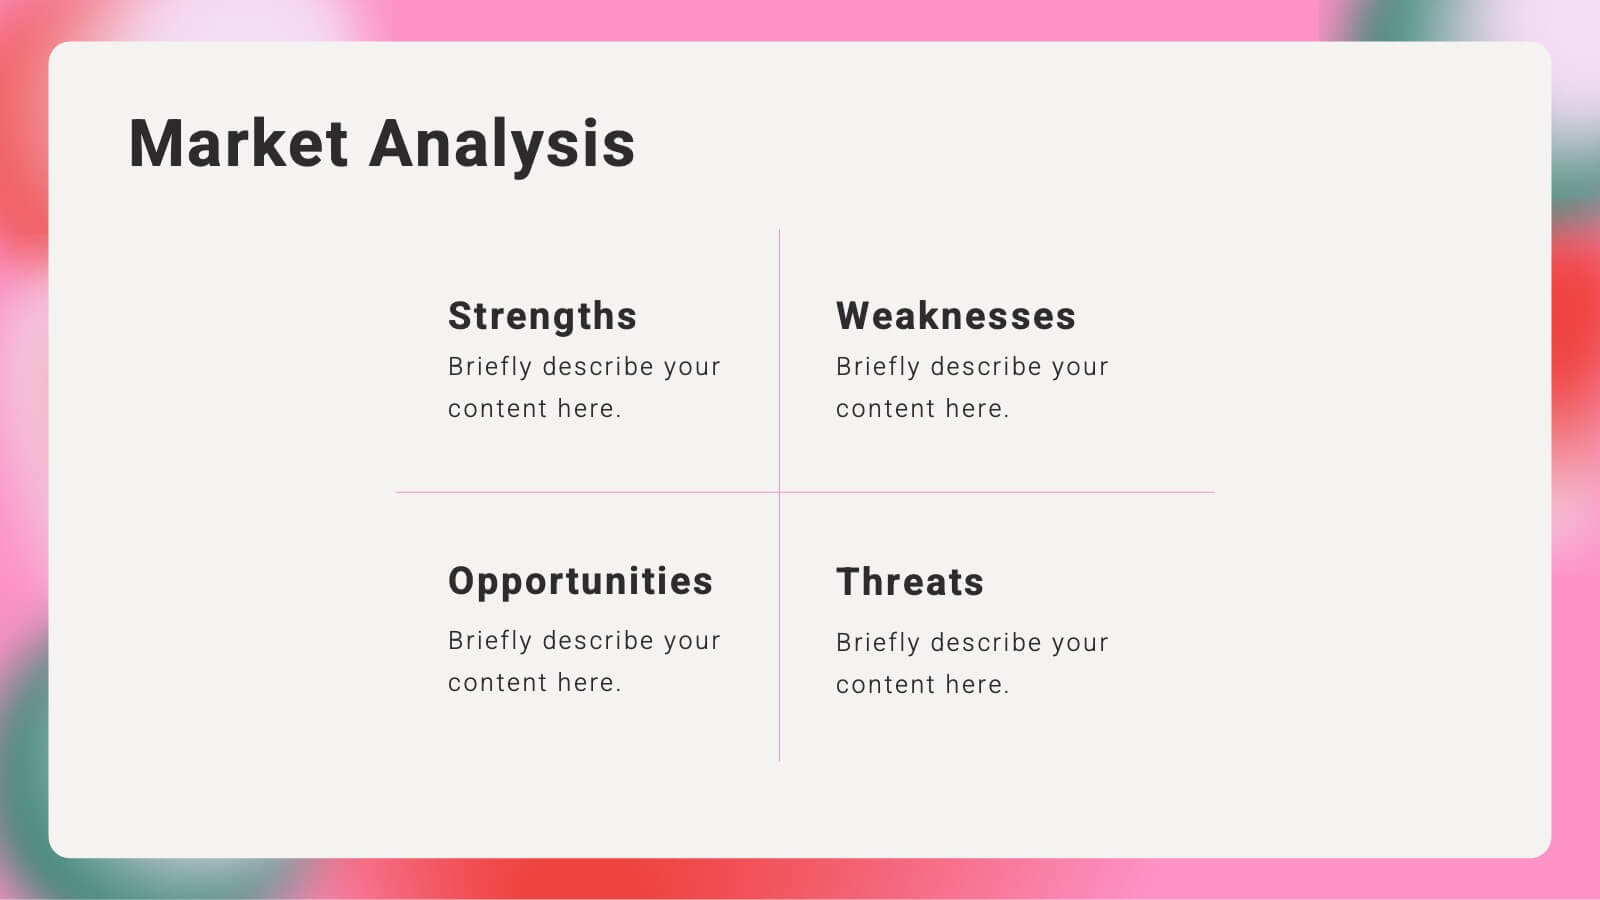
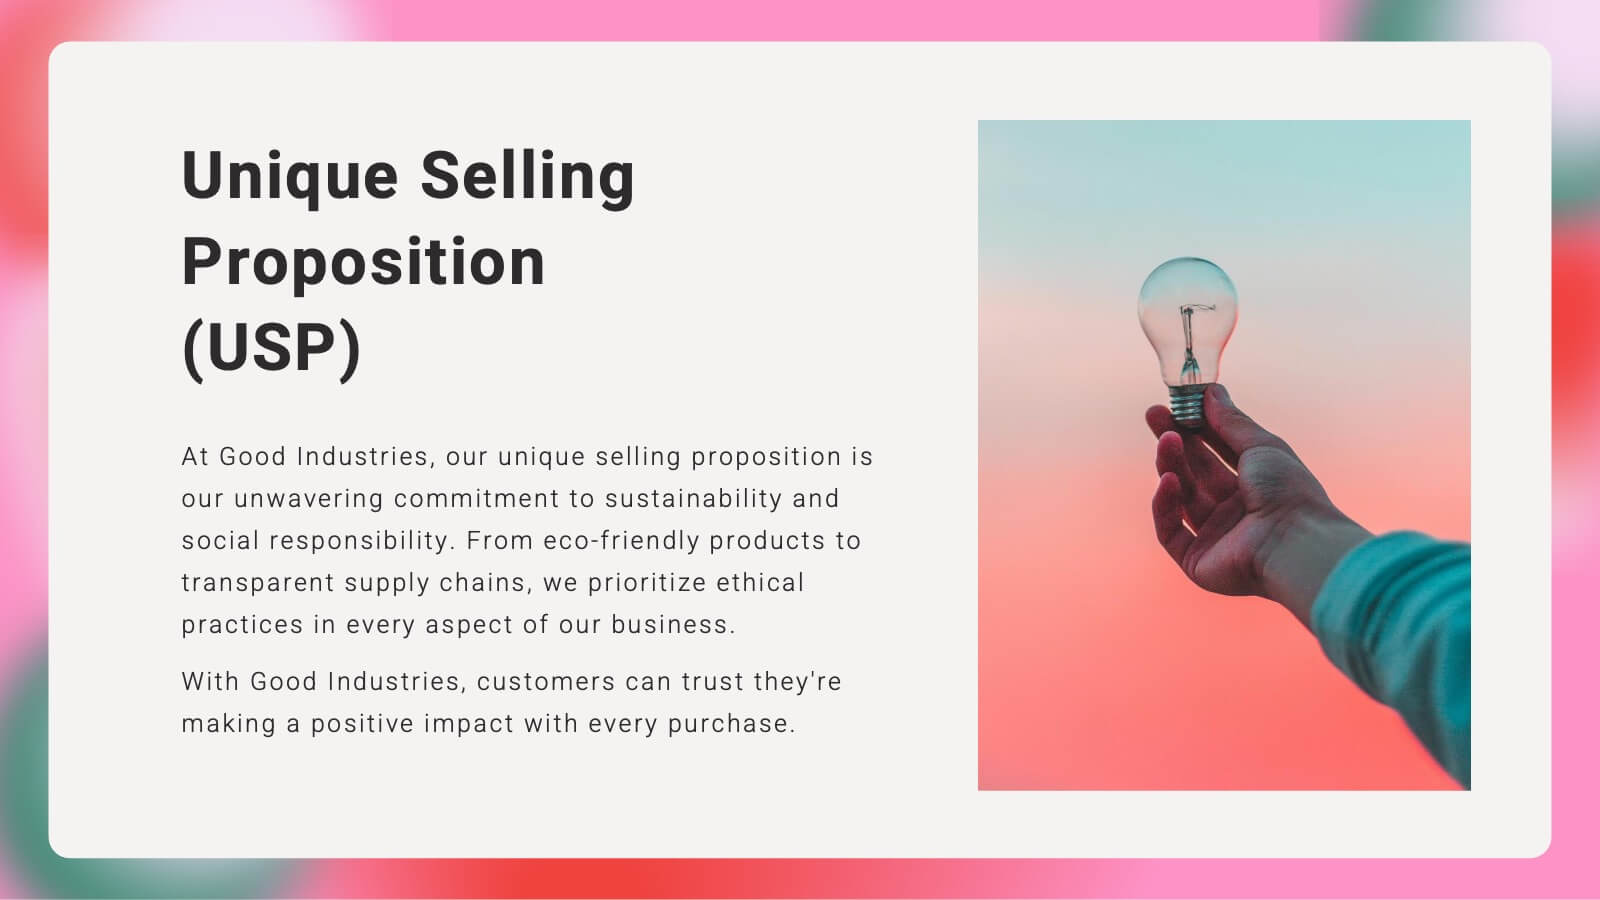
Kaleidoscope Brand Strategy Report Presentation
Craft a compelling narrative for your brand with this vibrant brand strategy presentation template. Designed to cover every facet of brand development, from vision and mission to market analysis and consumer personas, this template is an essential tool for businesses looking to establish a strong brand identity. It incorporates visually engaging slides that outline brand voice, values, and touchpoints, facilitating a thorough understanding of strategic branding. Compatible with platforms like PowerPoint, Google Slides, and Keynote, it is accessible across various devices, making it perfect for collaborative planning and presentations.


20 slides
Lullabyne Design Portfolio Presentation
Showcase your creative work with this modern and professional design portfolio presentation. Covering essential elements like design briefs, mood boards, prototypes, and implementation plans, this template helps you present your work with clarity and style. Fully customizable and available for PowerPoint, Keynote, and Google Slides.


4 slides
Digital Course Creation Flow Presentation
Guide your audience through the steps of building a digital course with this clear and modern flowchart layout. Designed to simplify complex processes, this visual template is ideal for educators, instructional designers, or online coaches. Fully compatible with PowerPoint, Keynote, and Google Slides for easy customization and seamless use.


23 slides
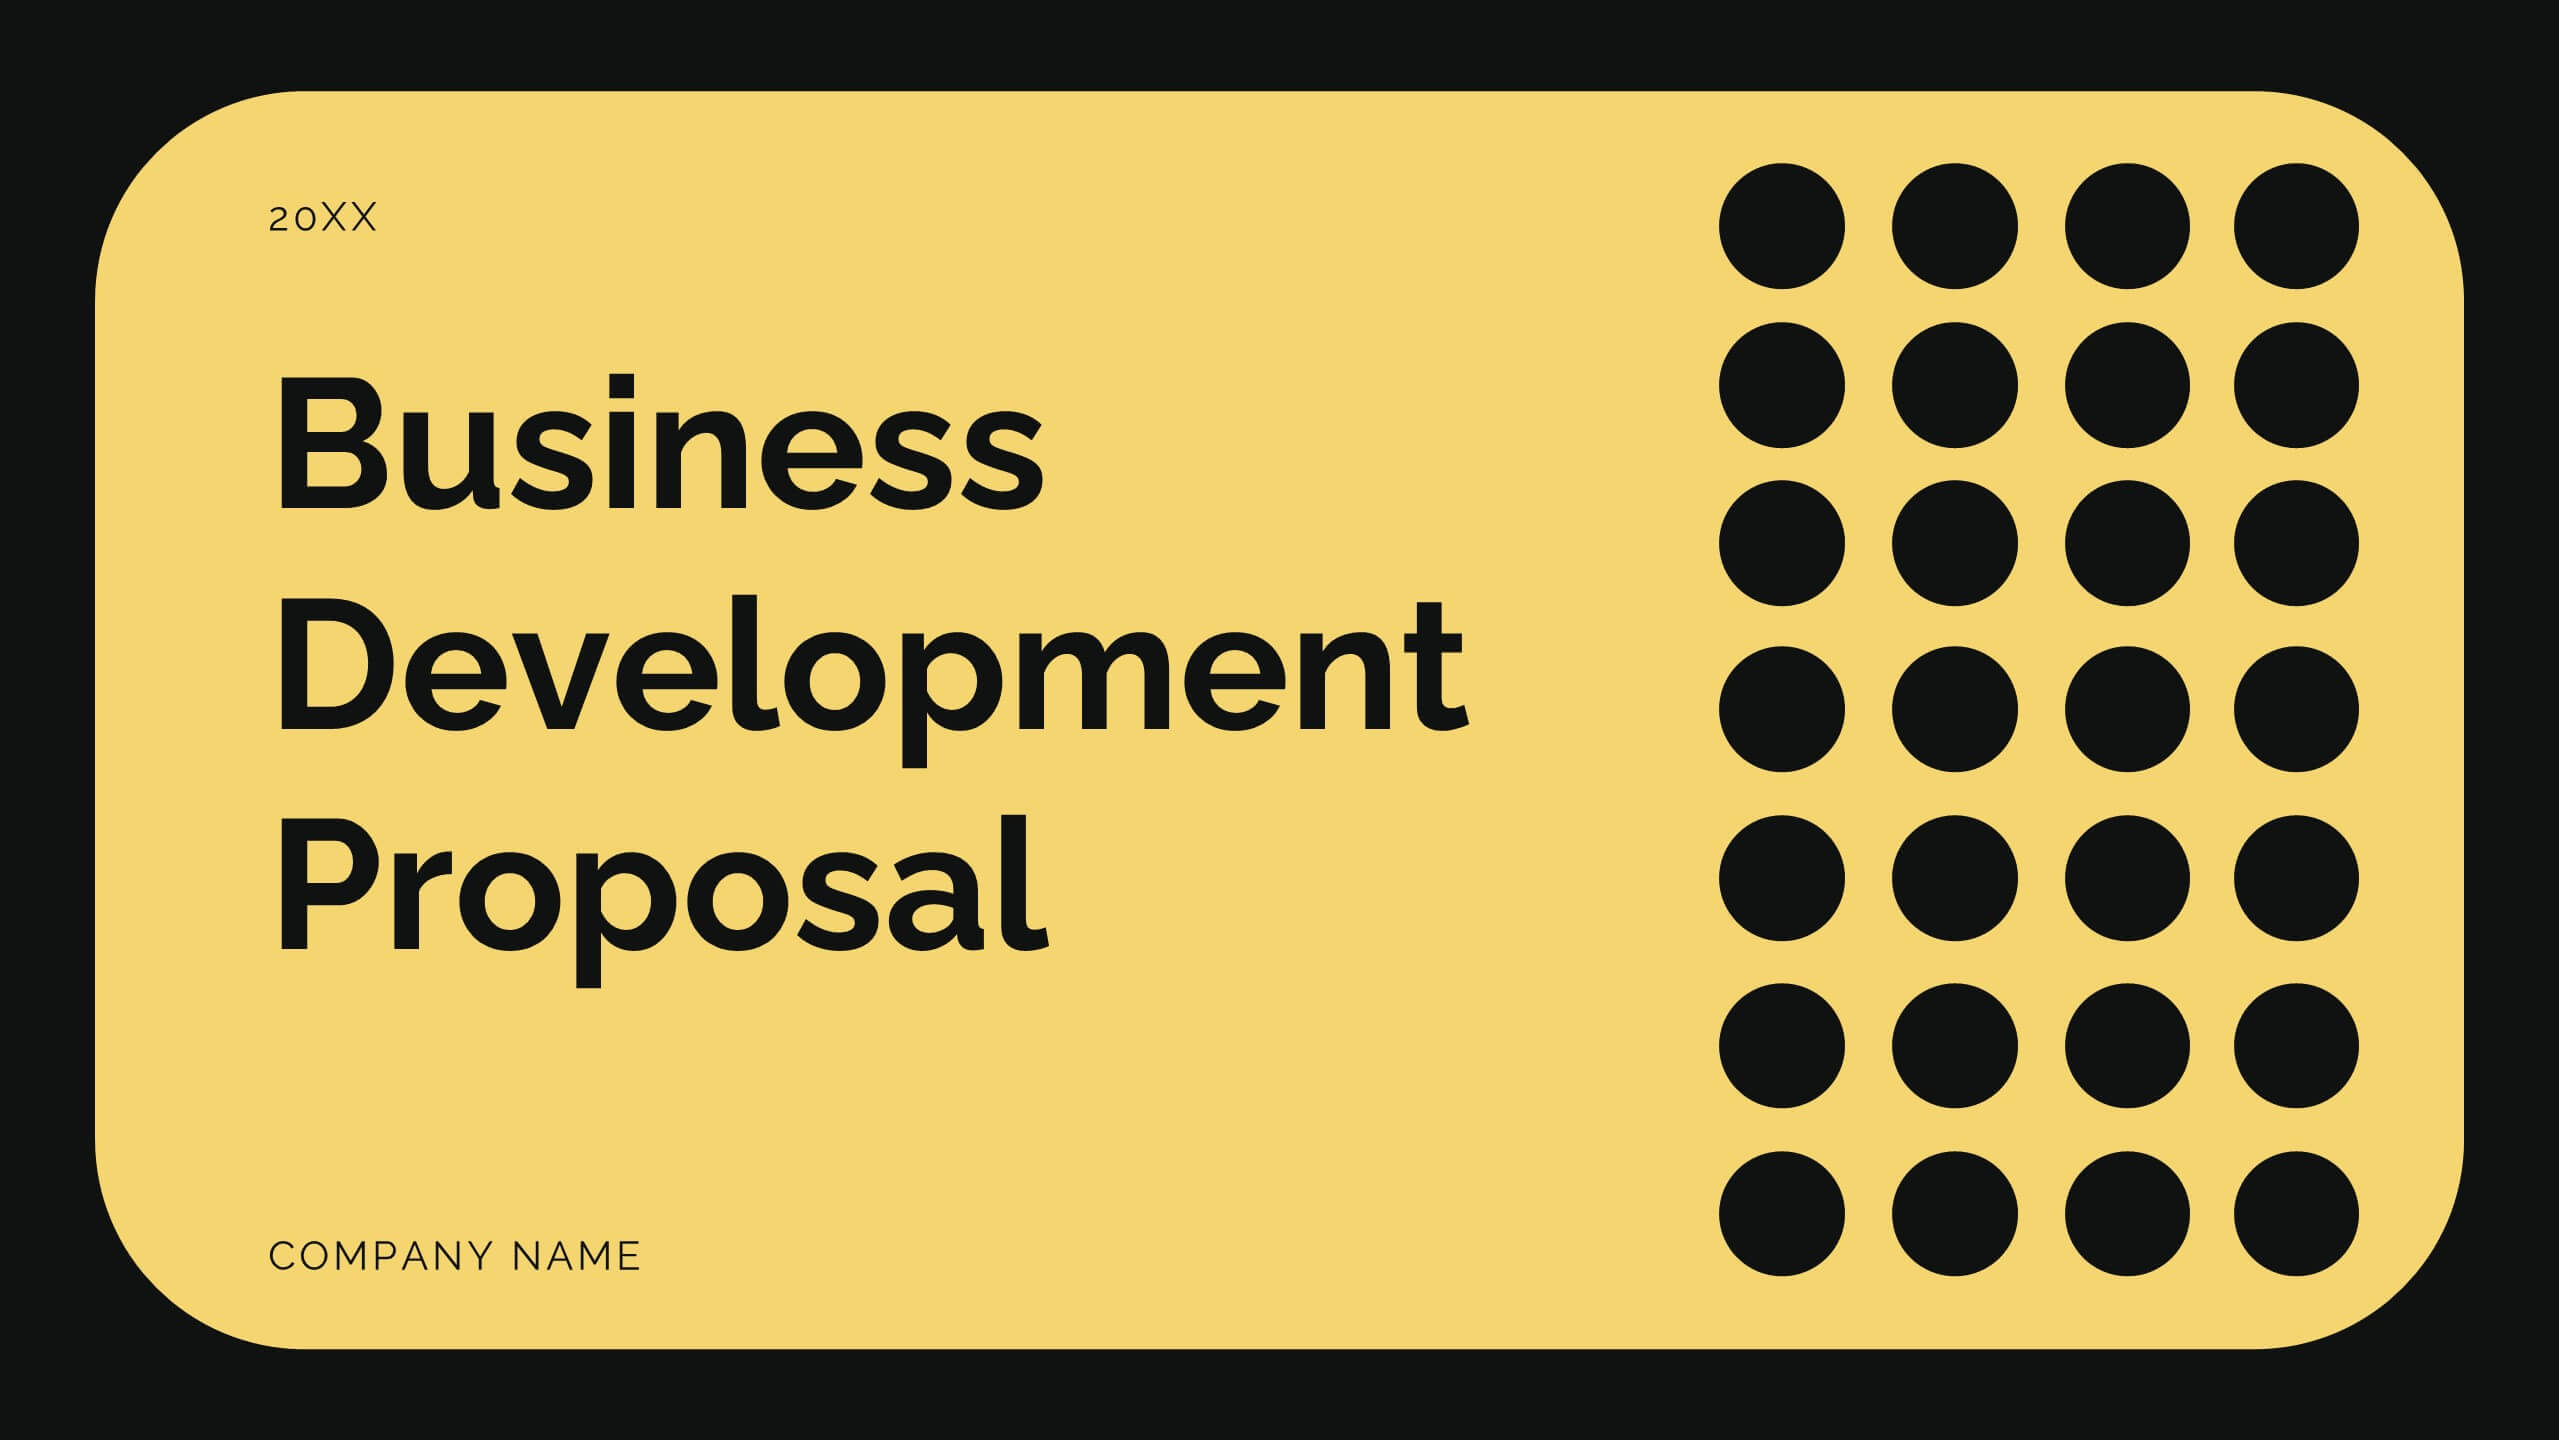
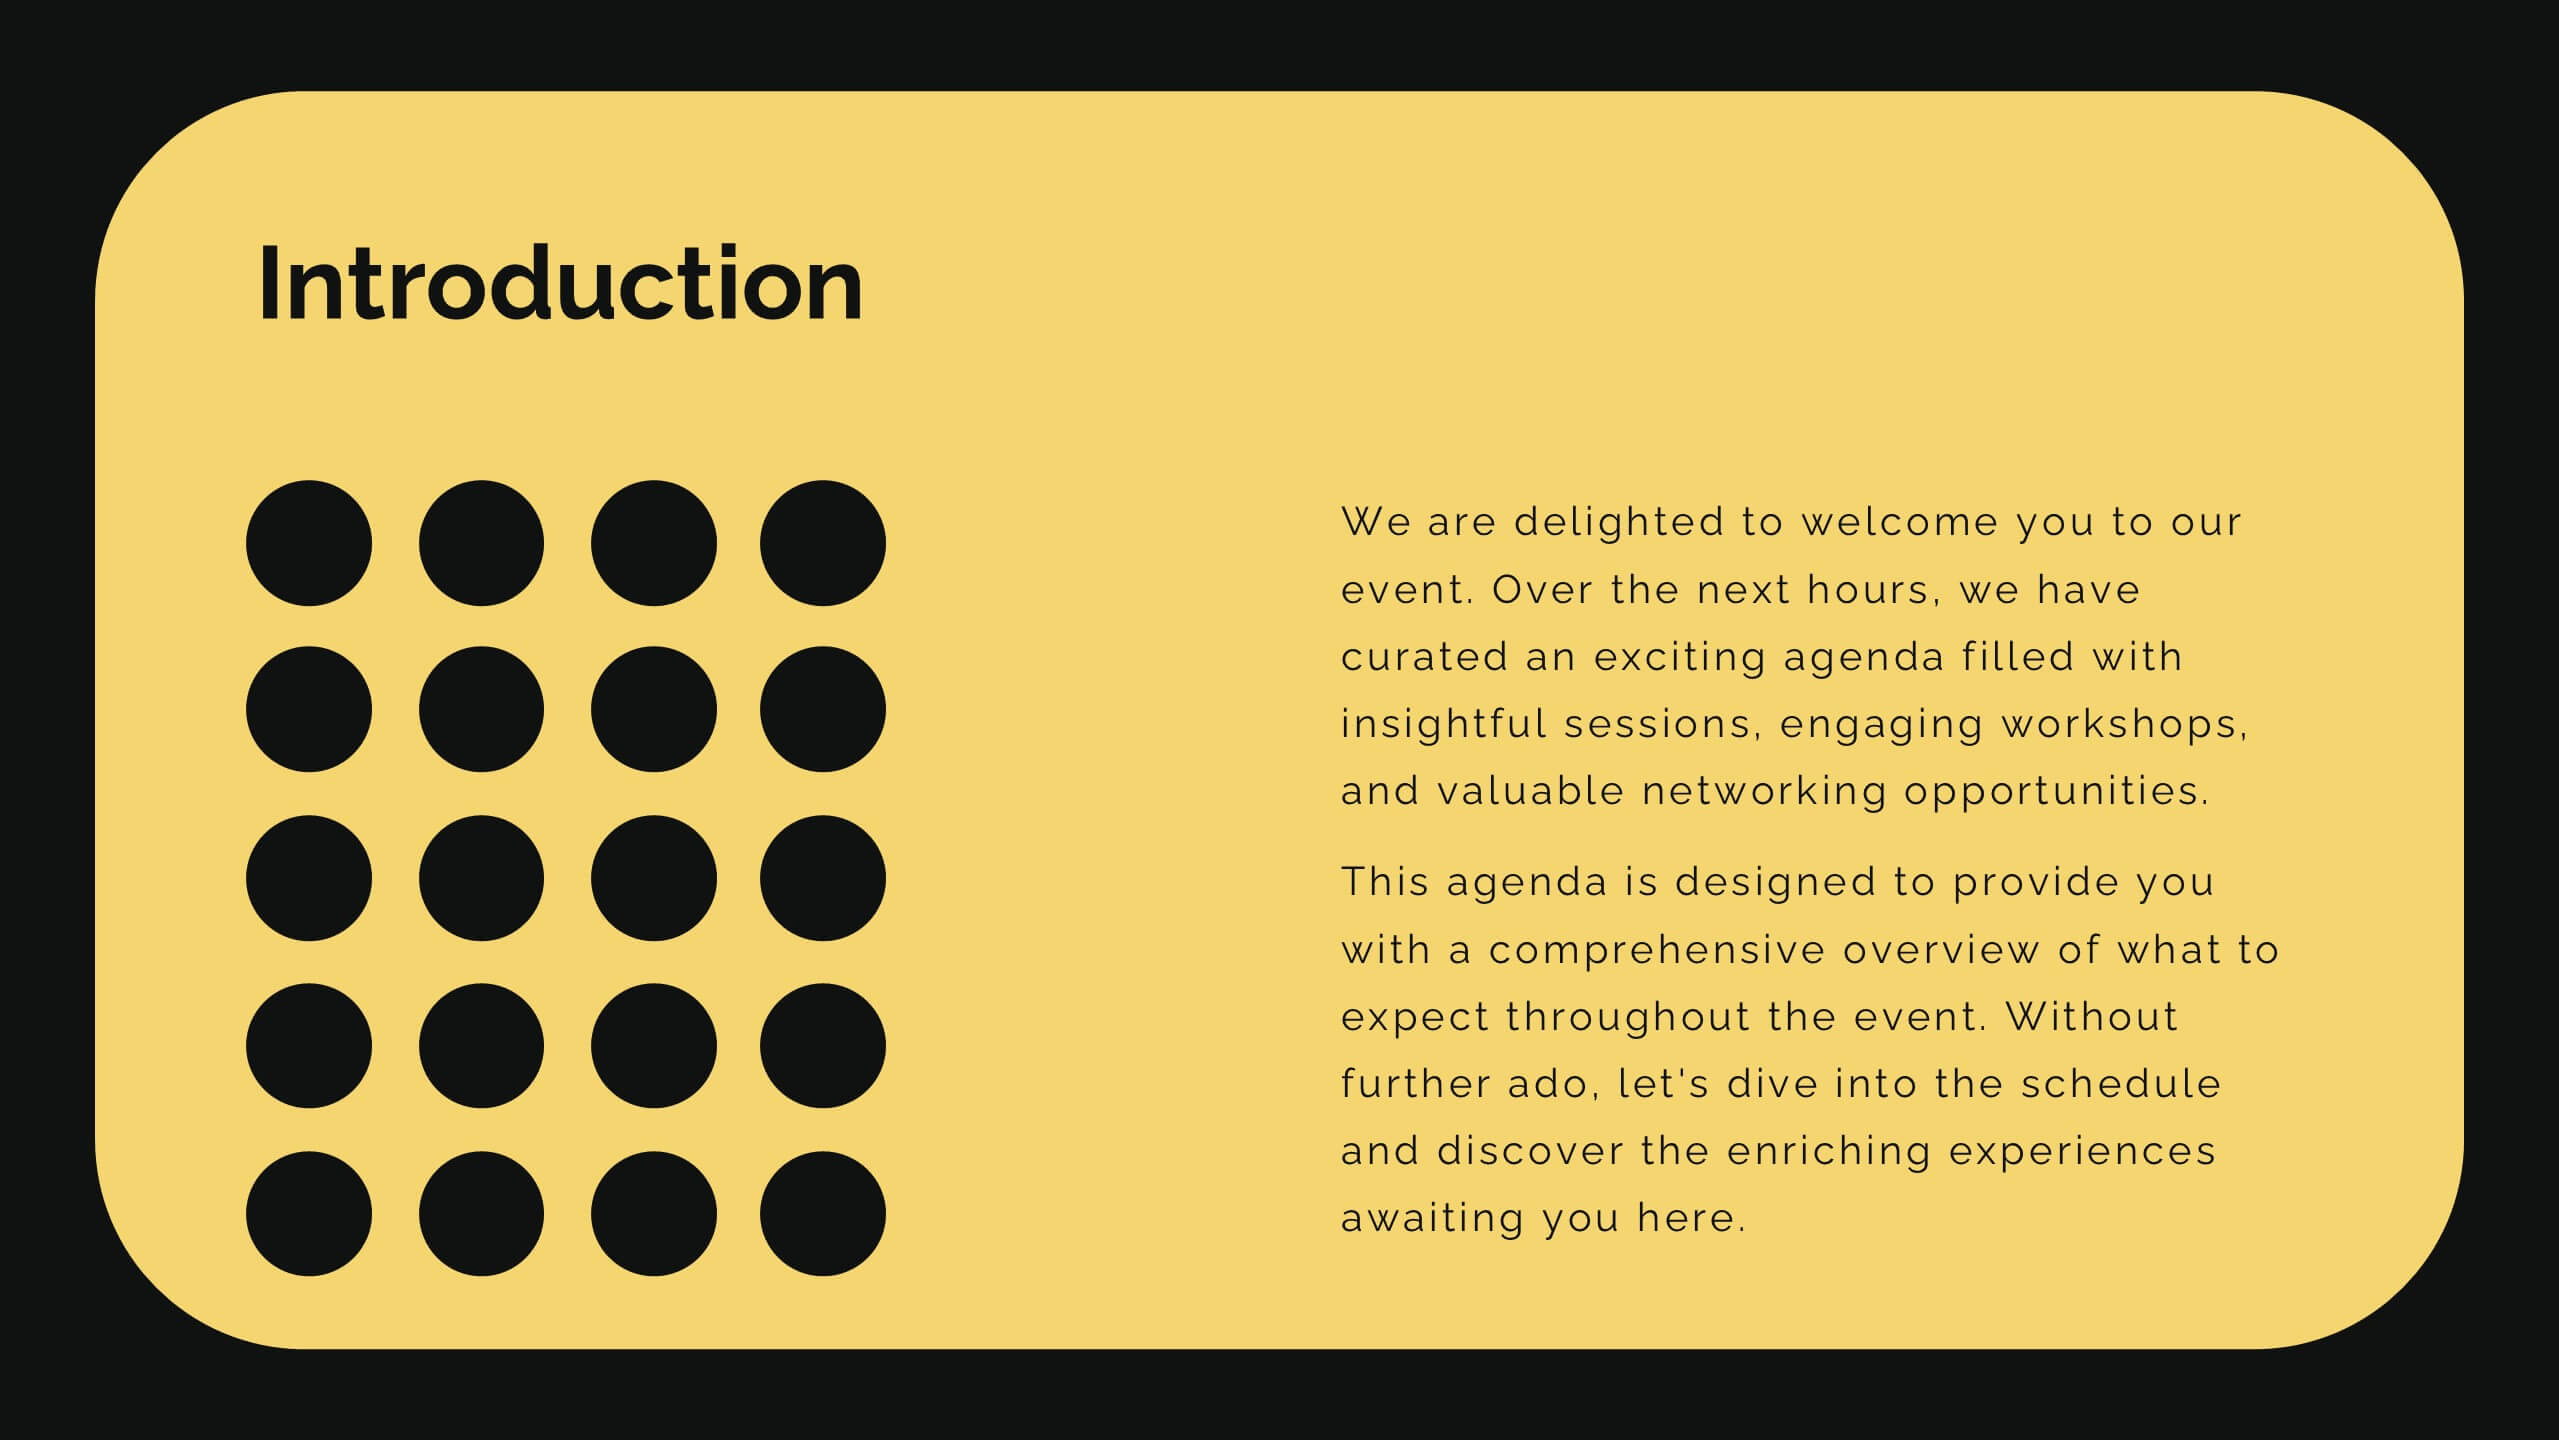
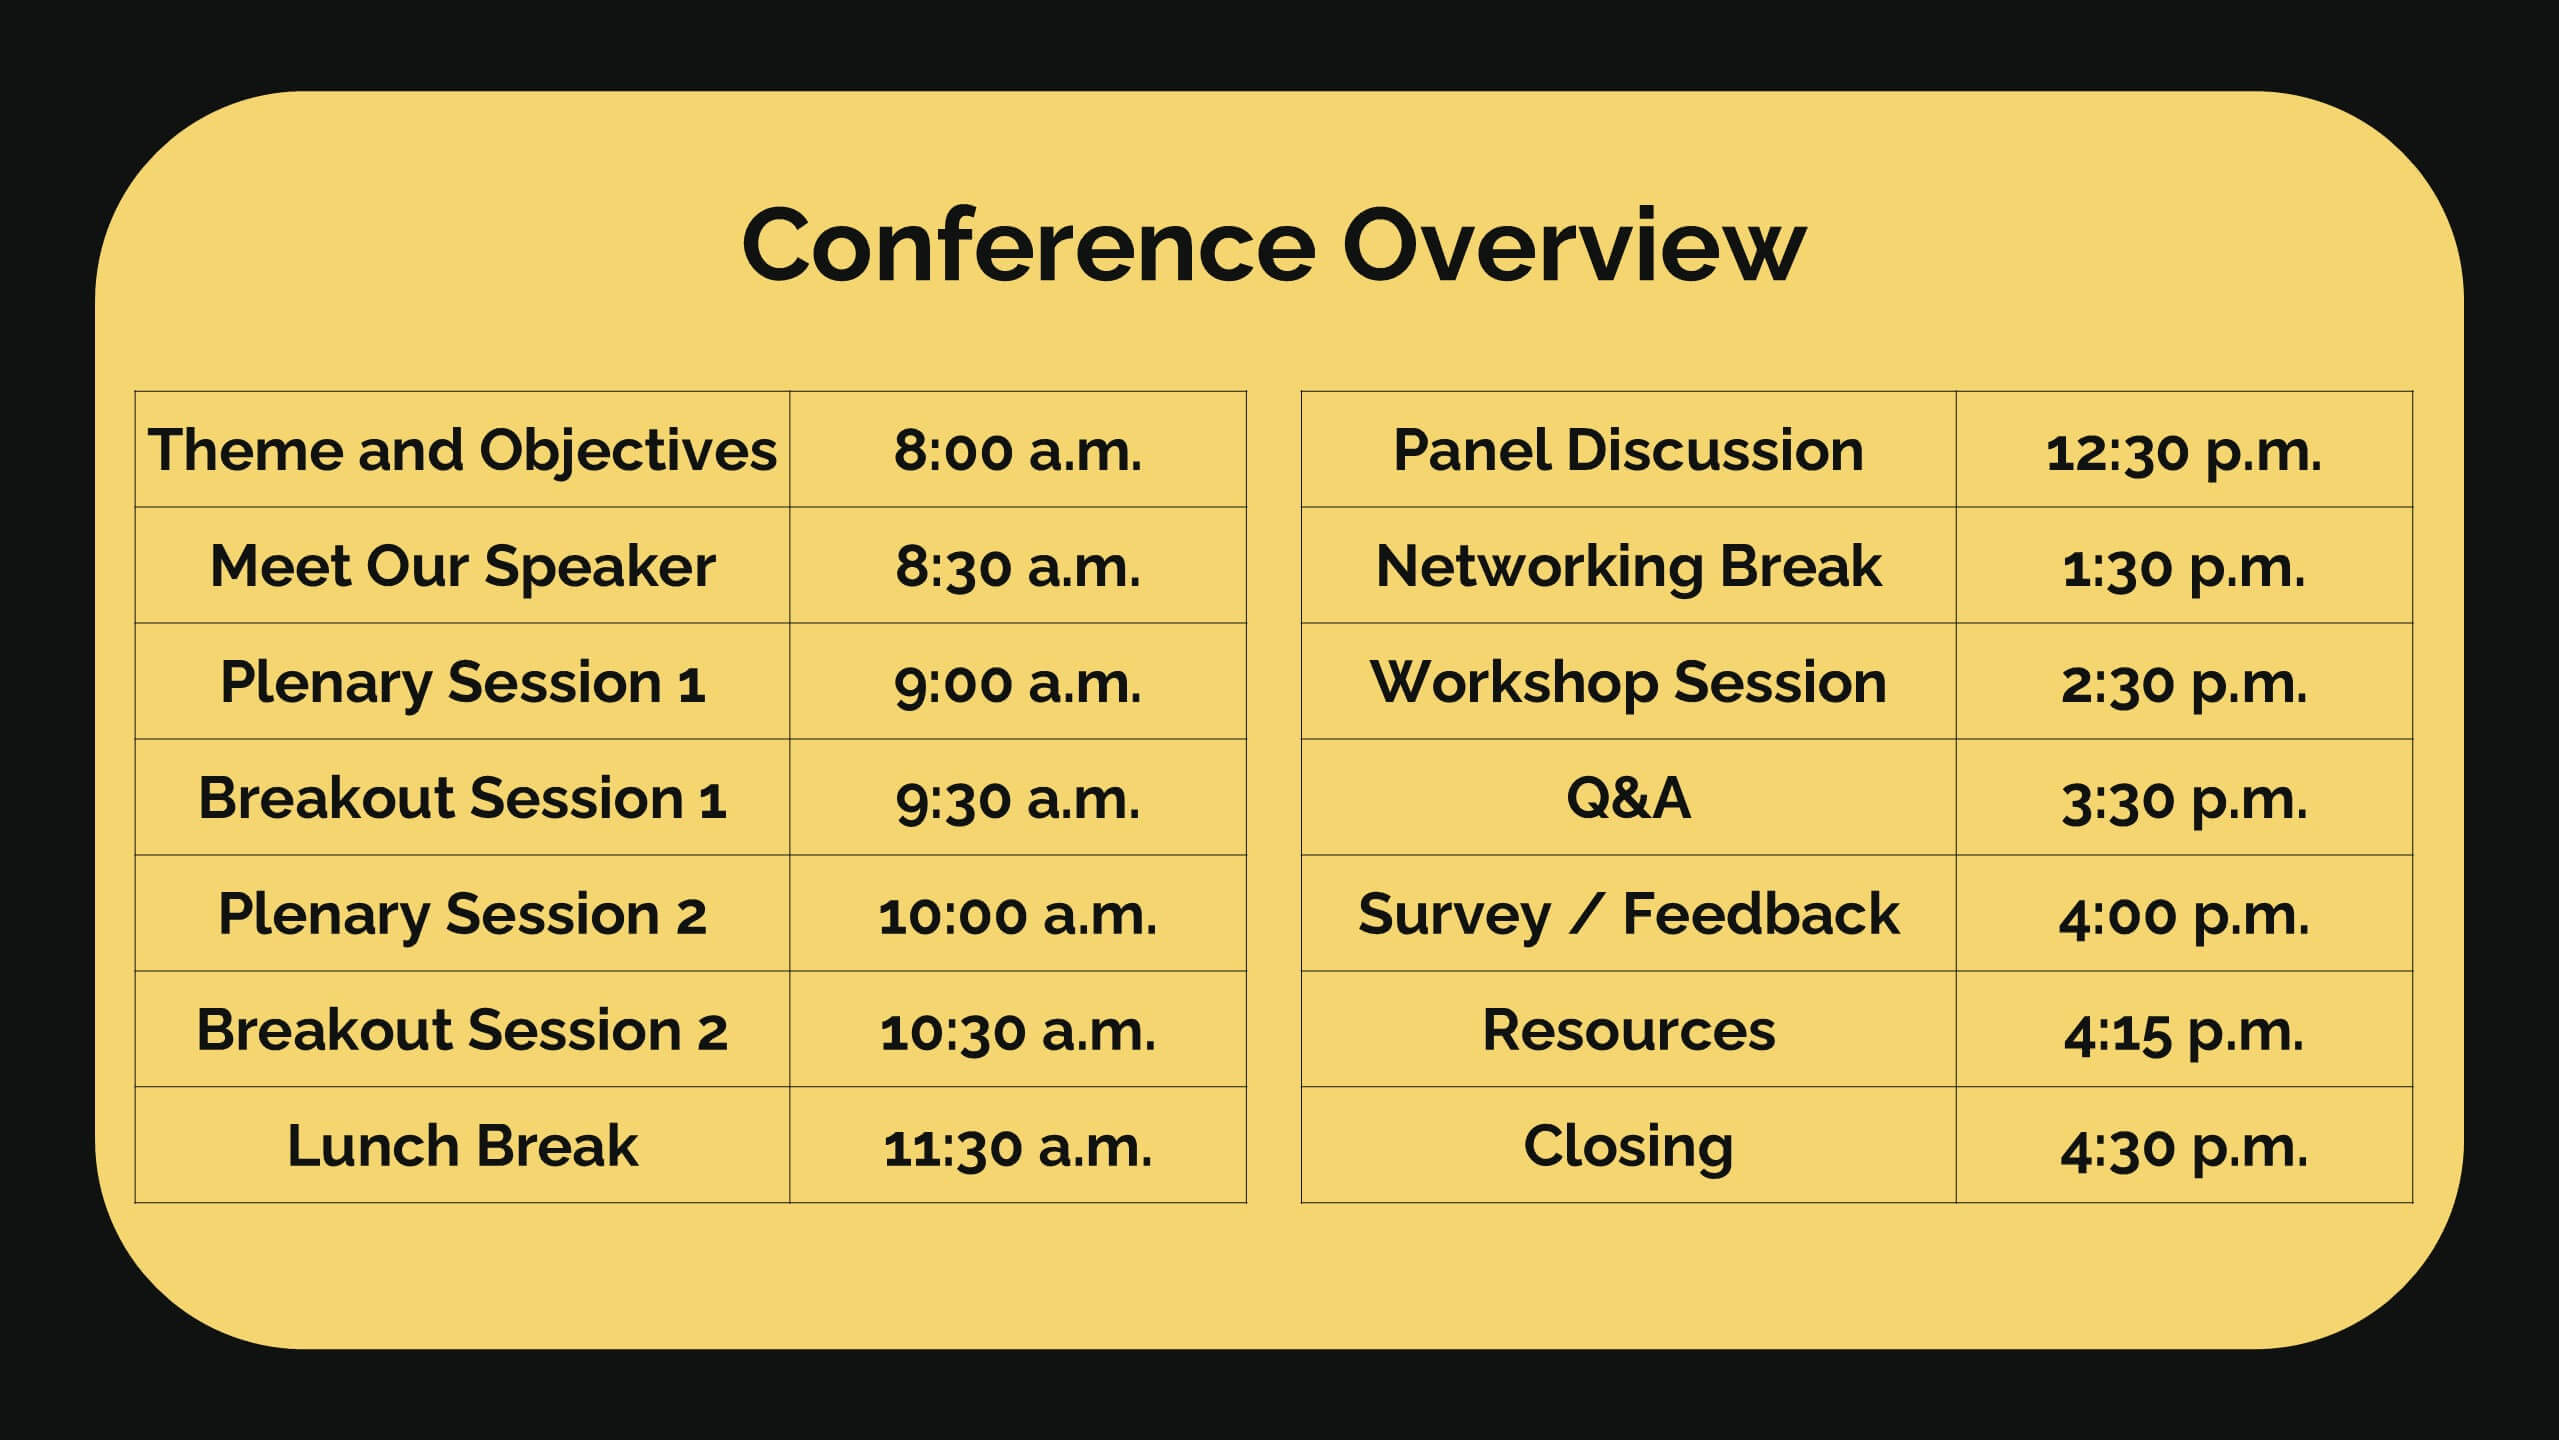
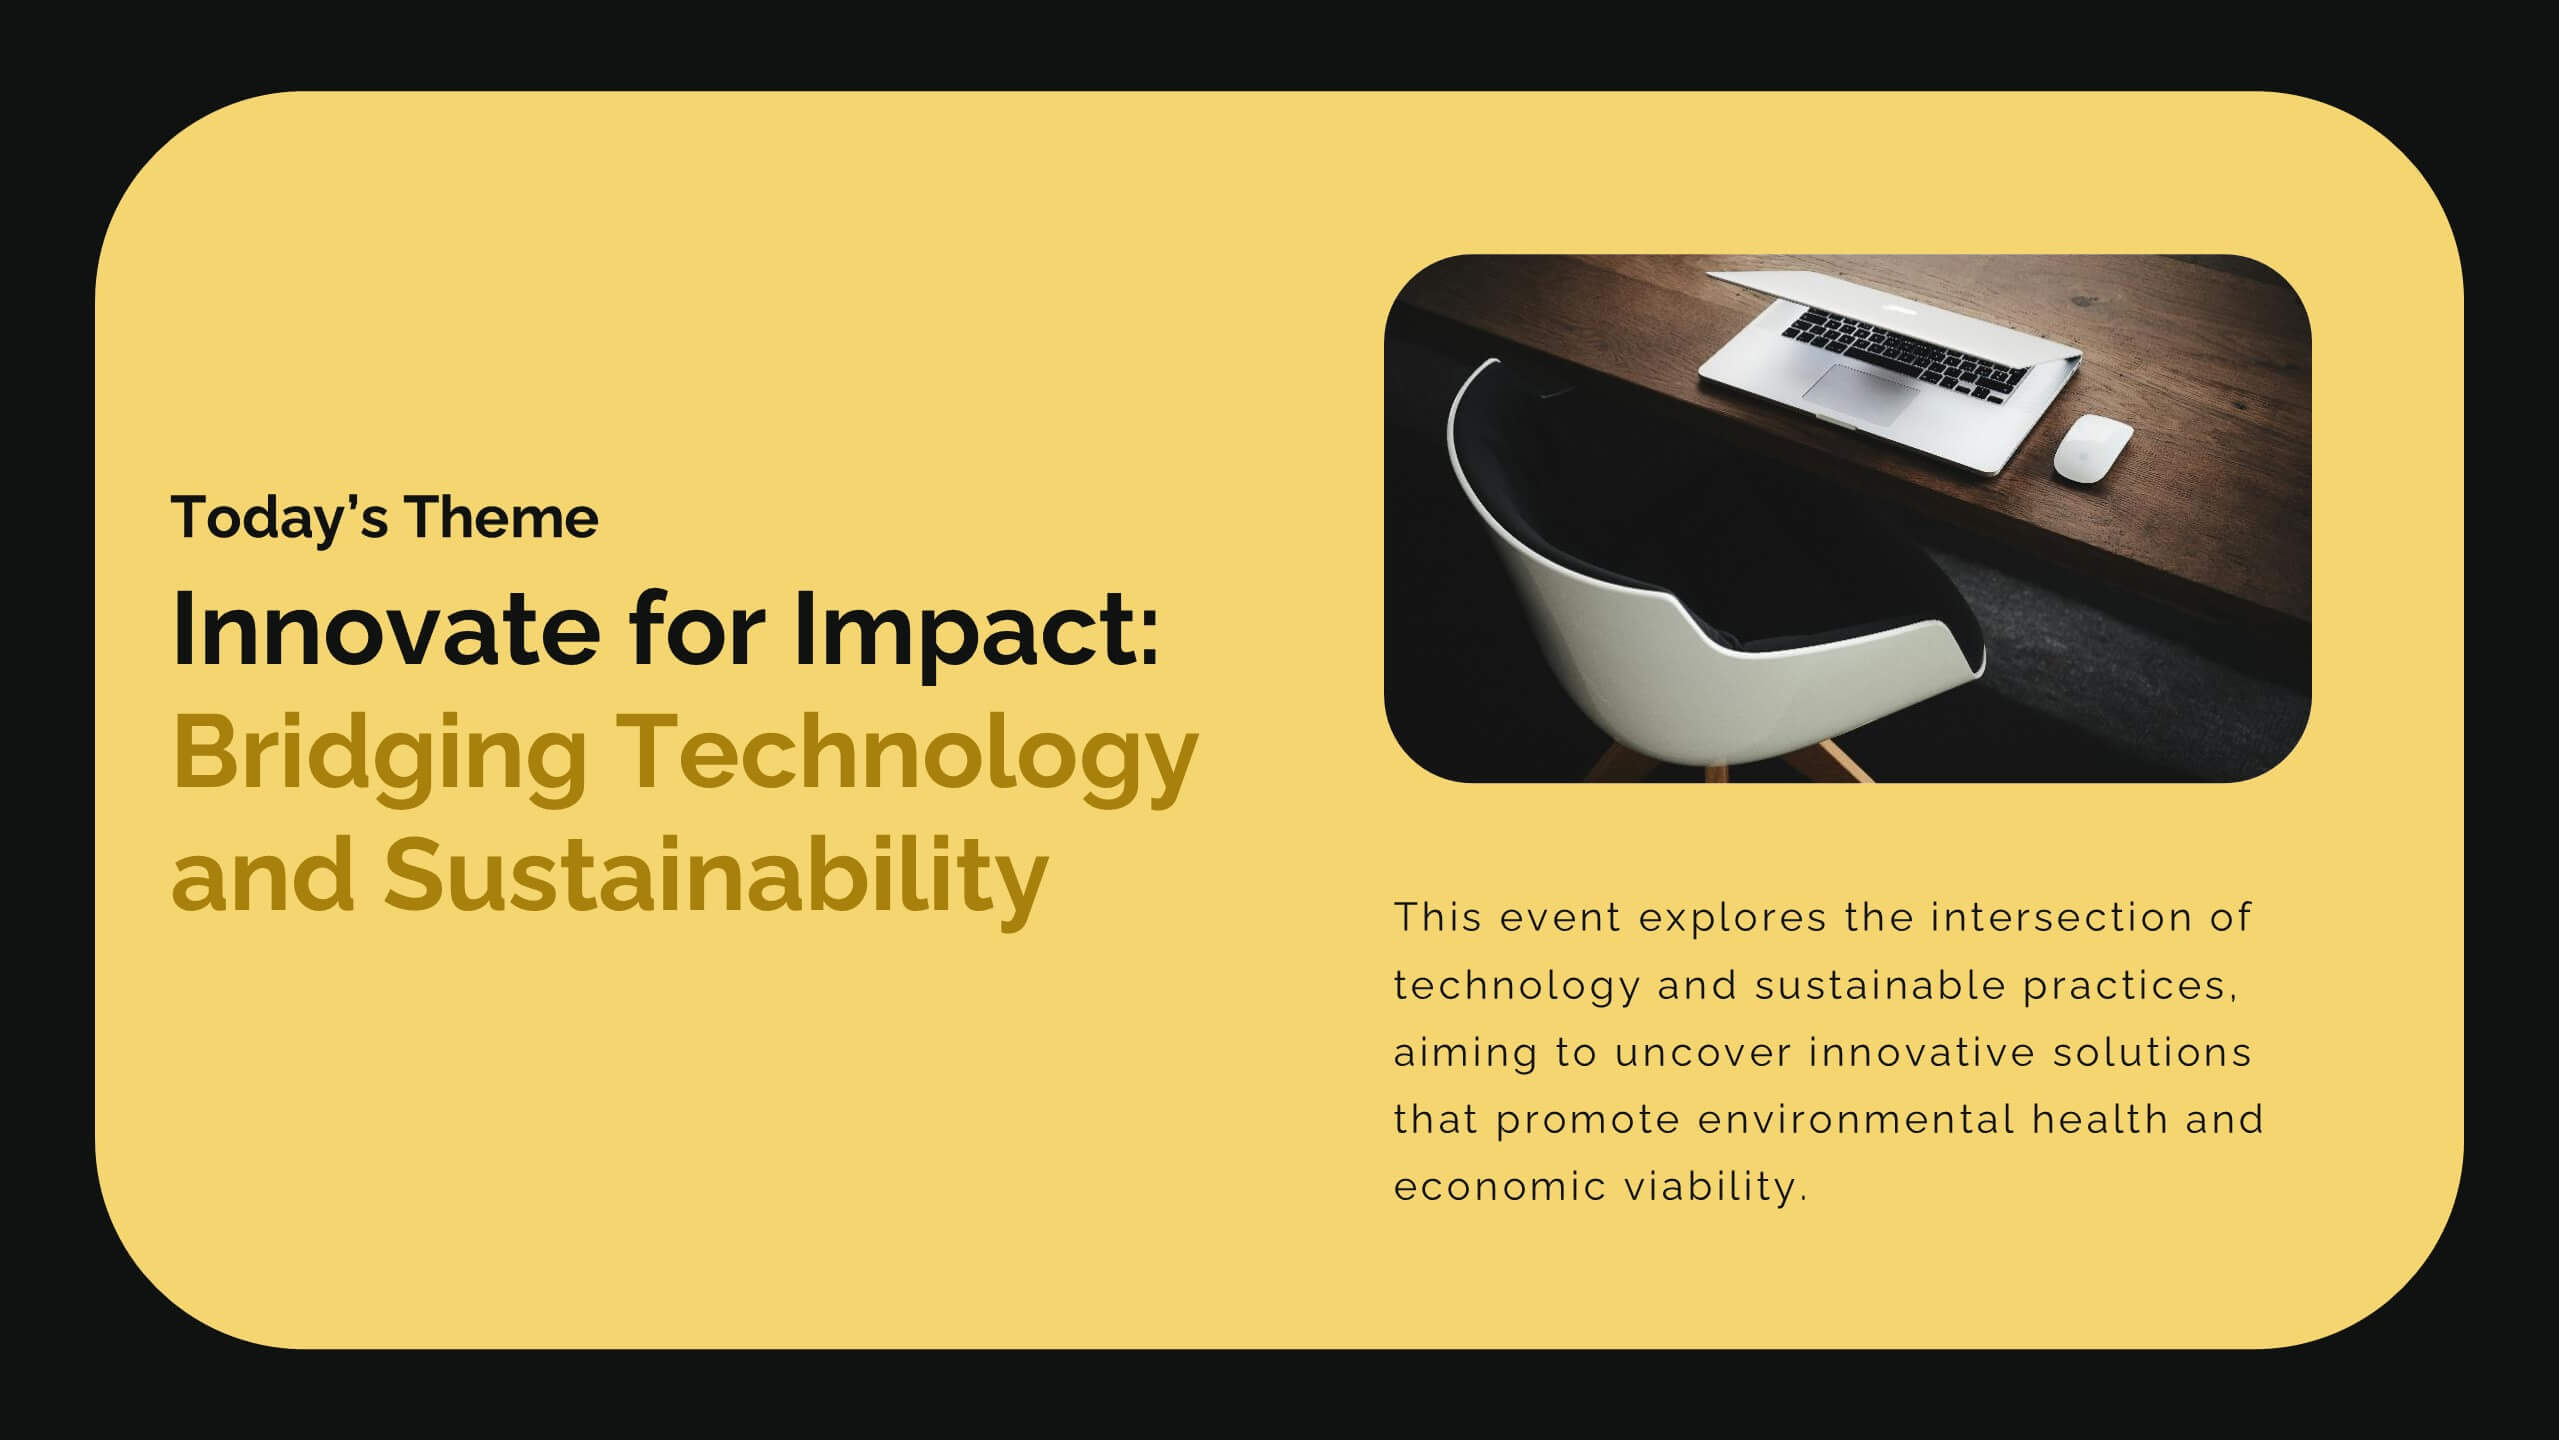
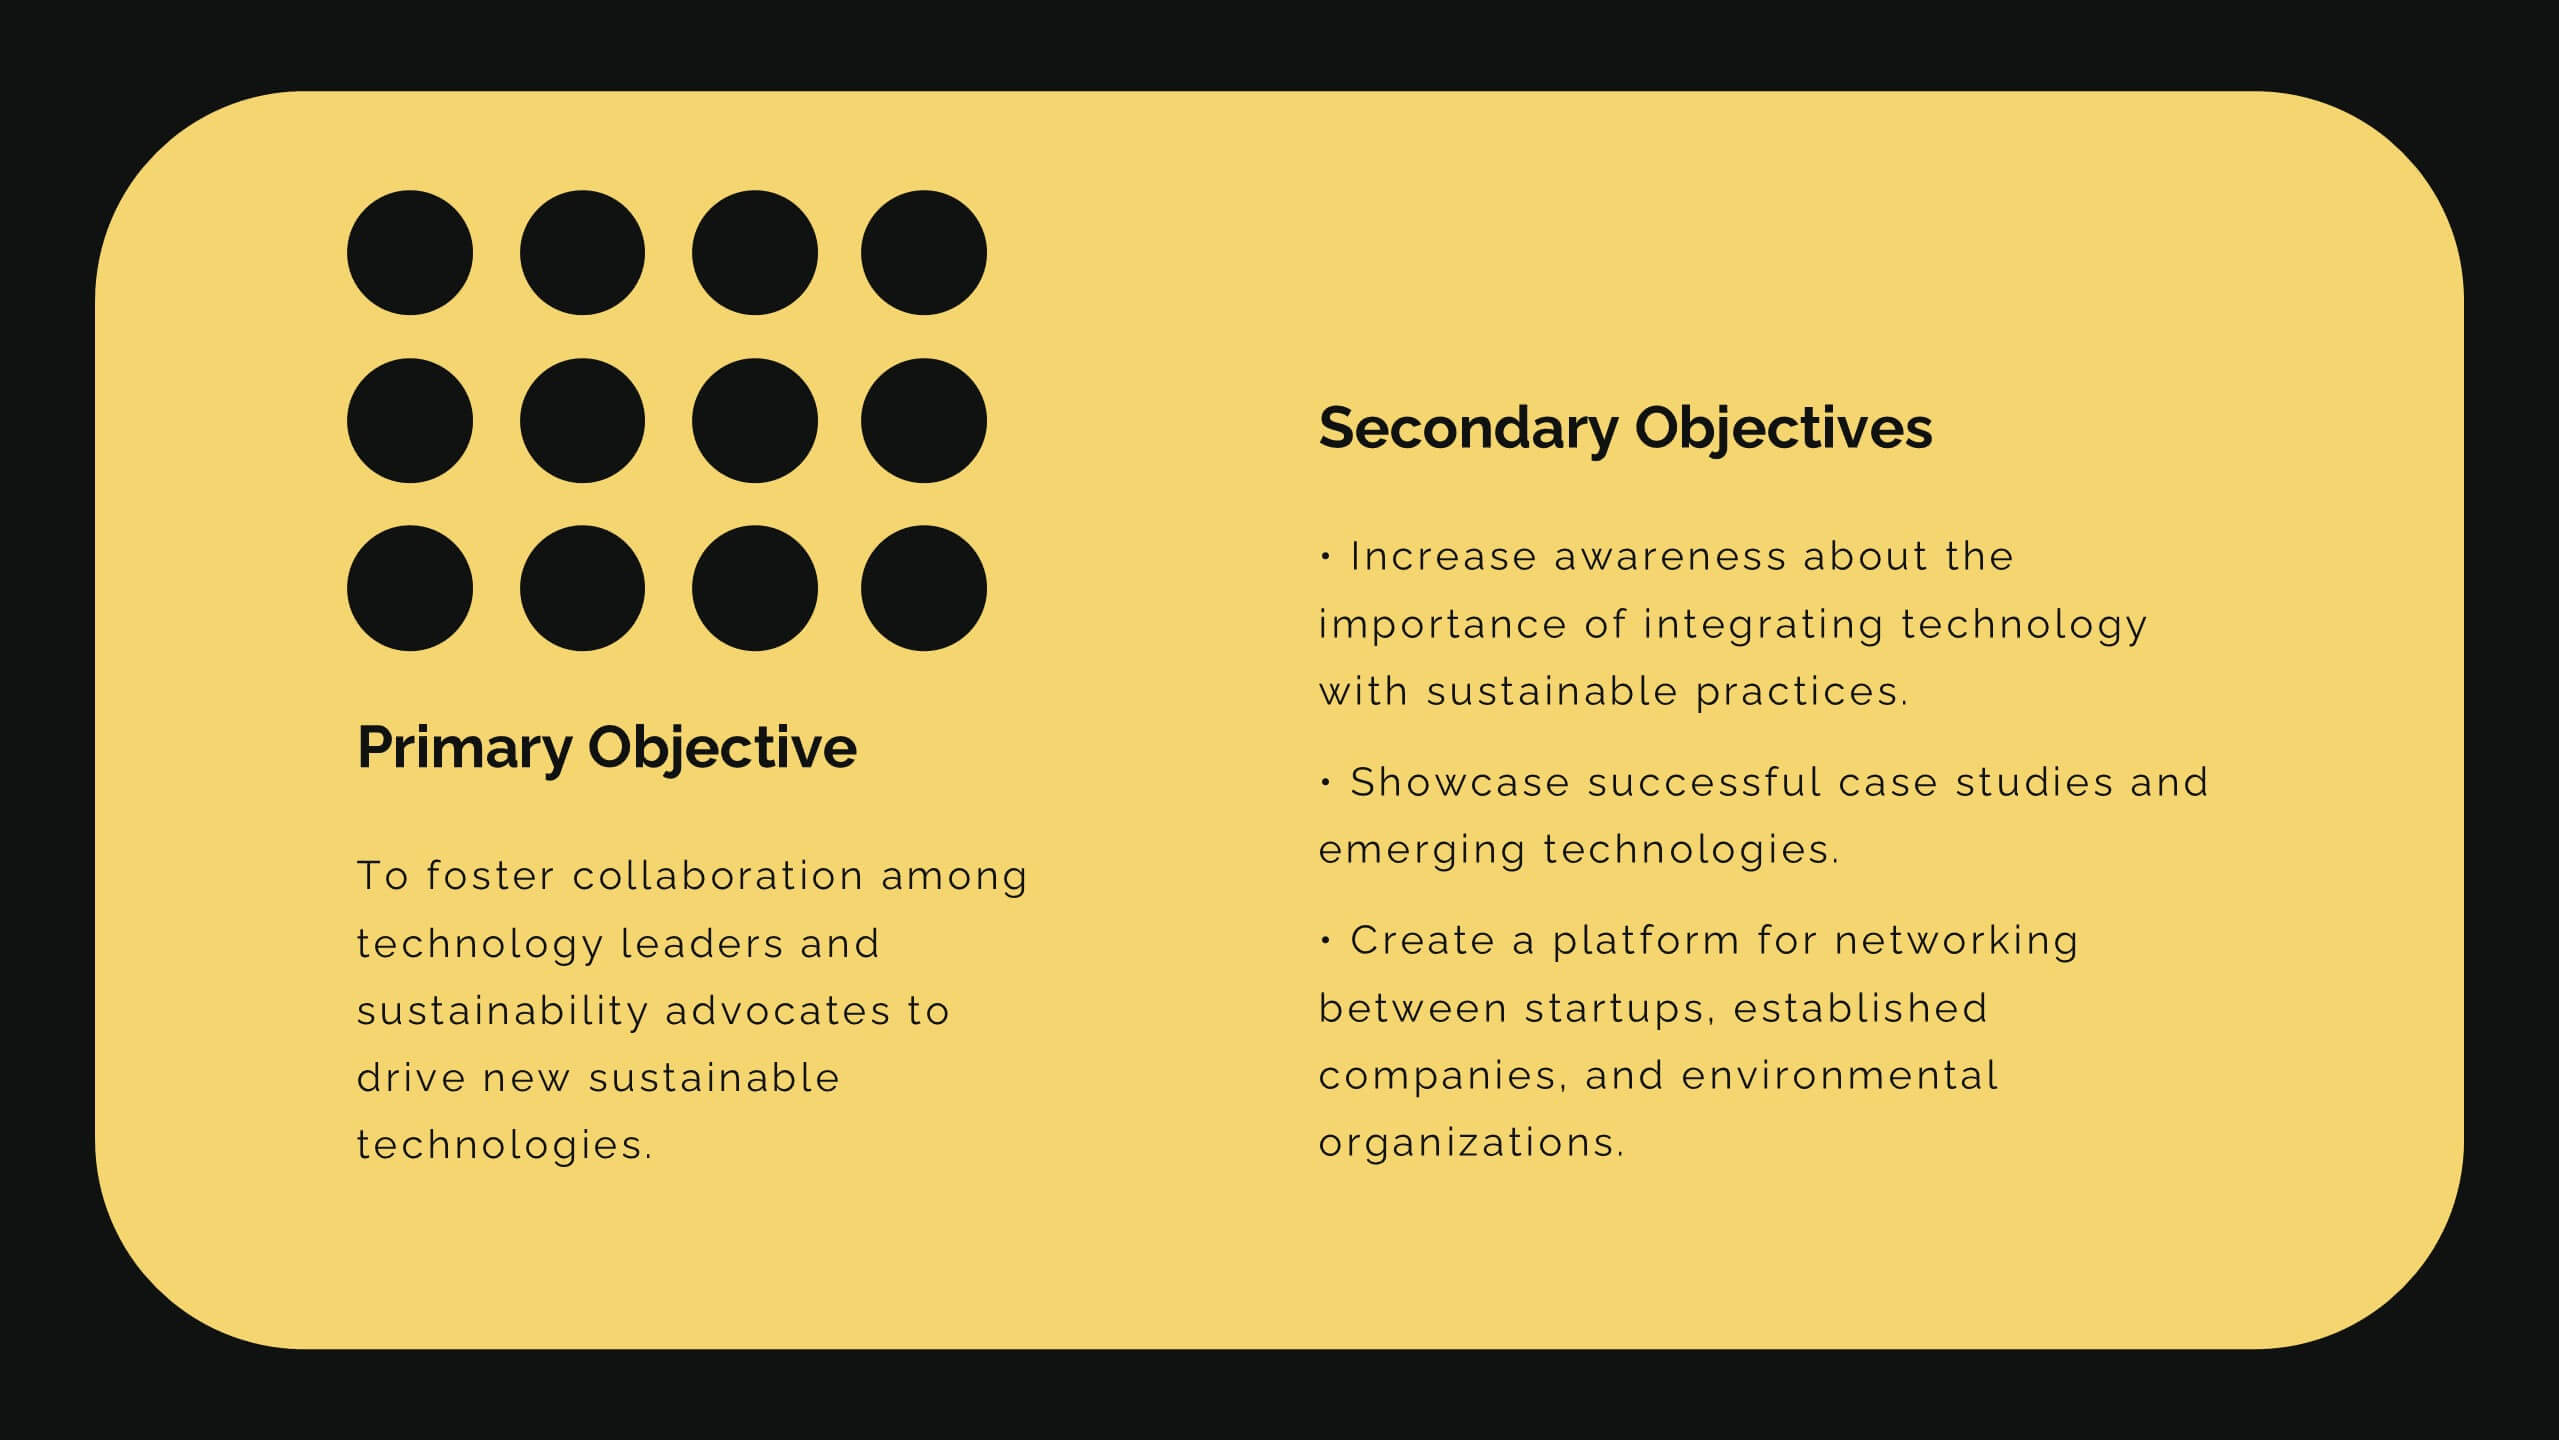
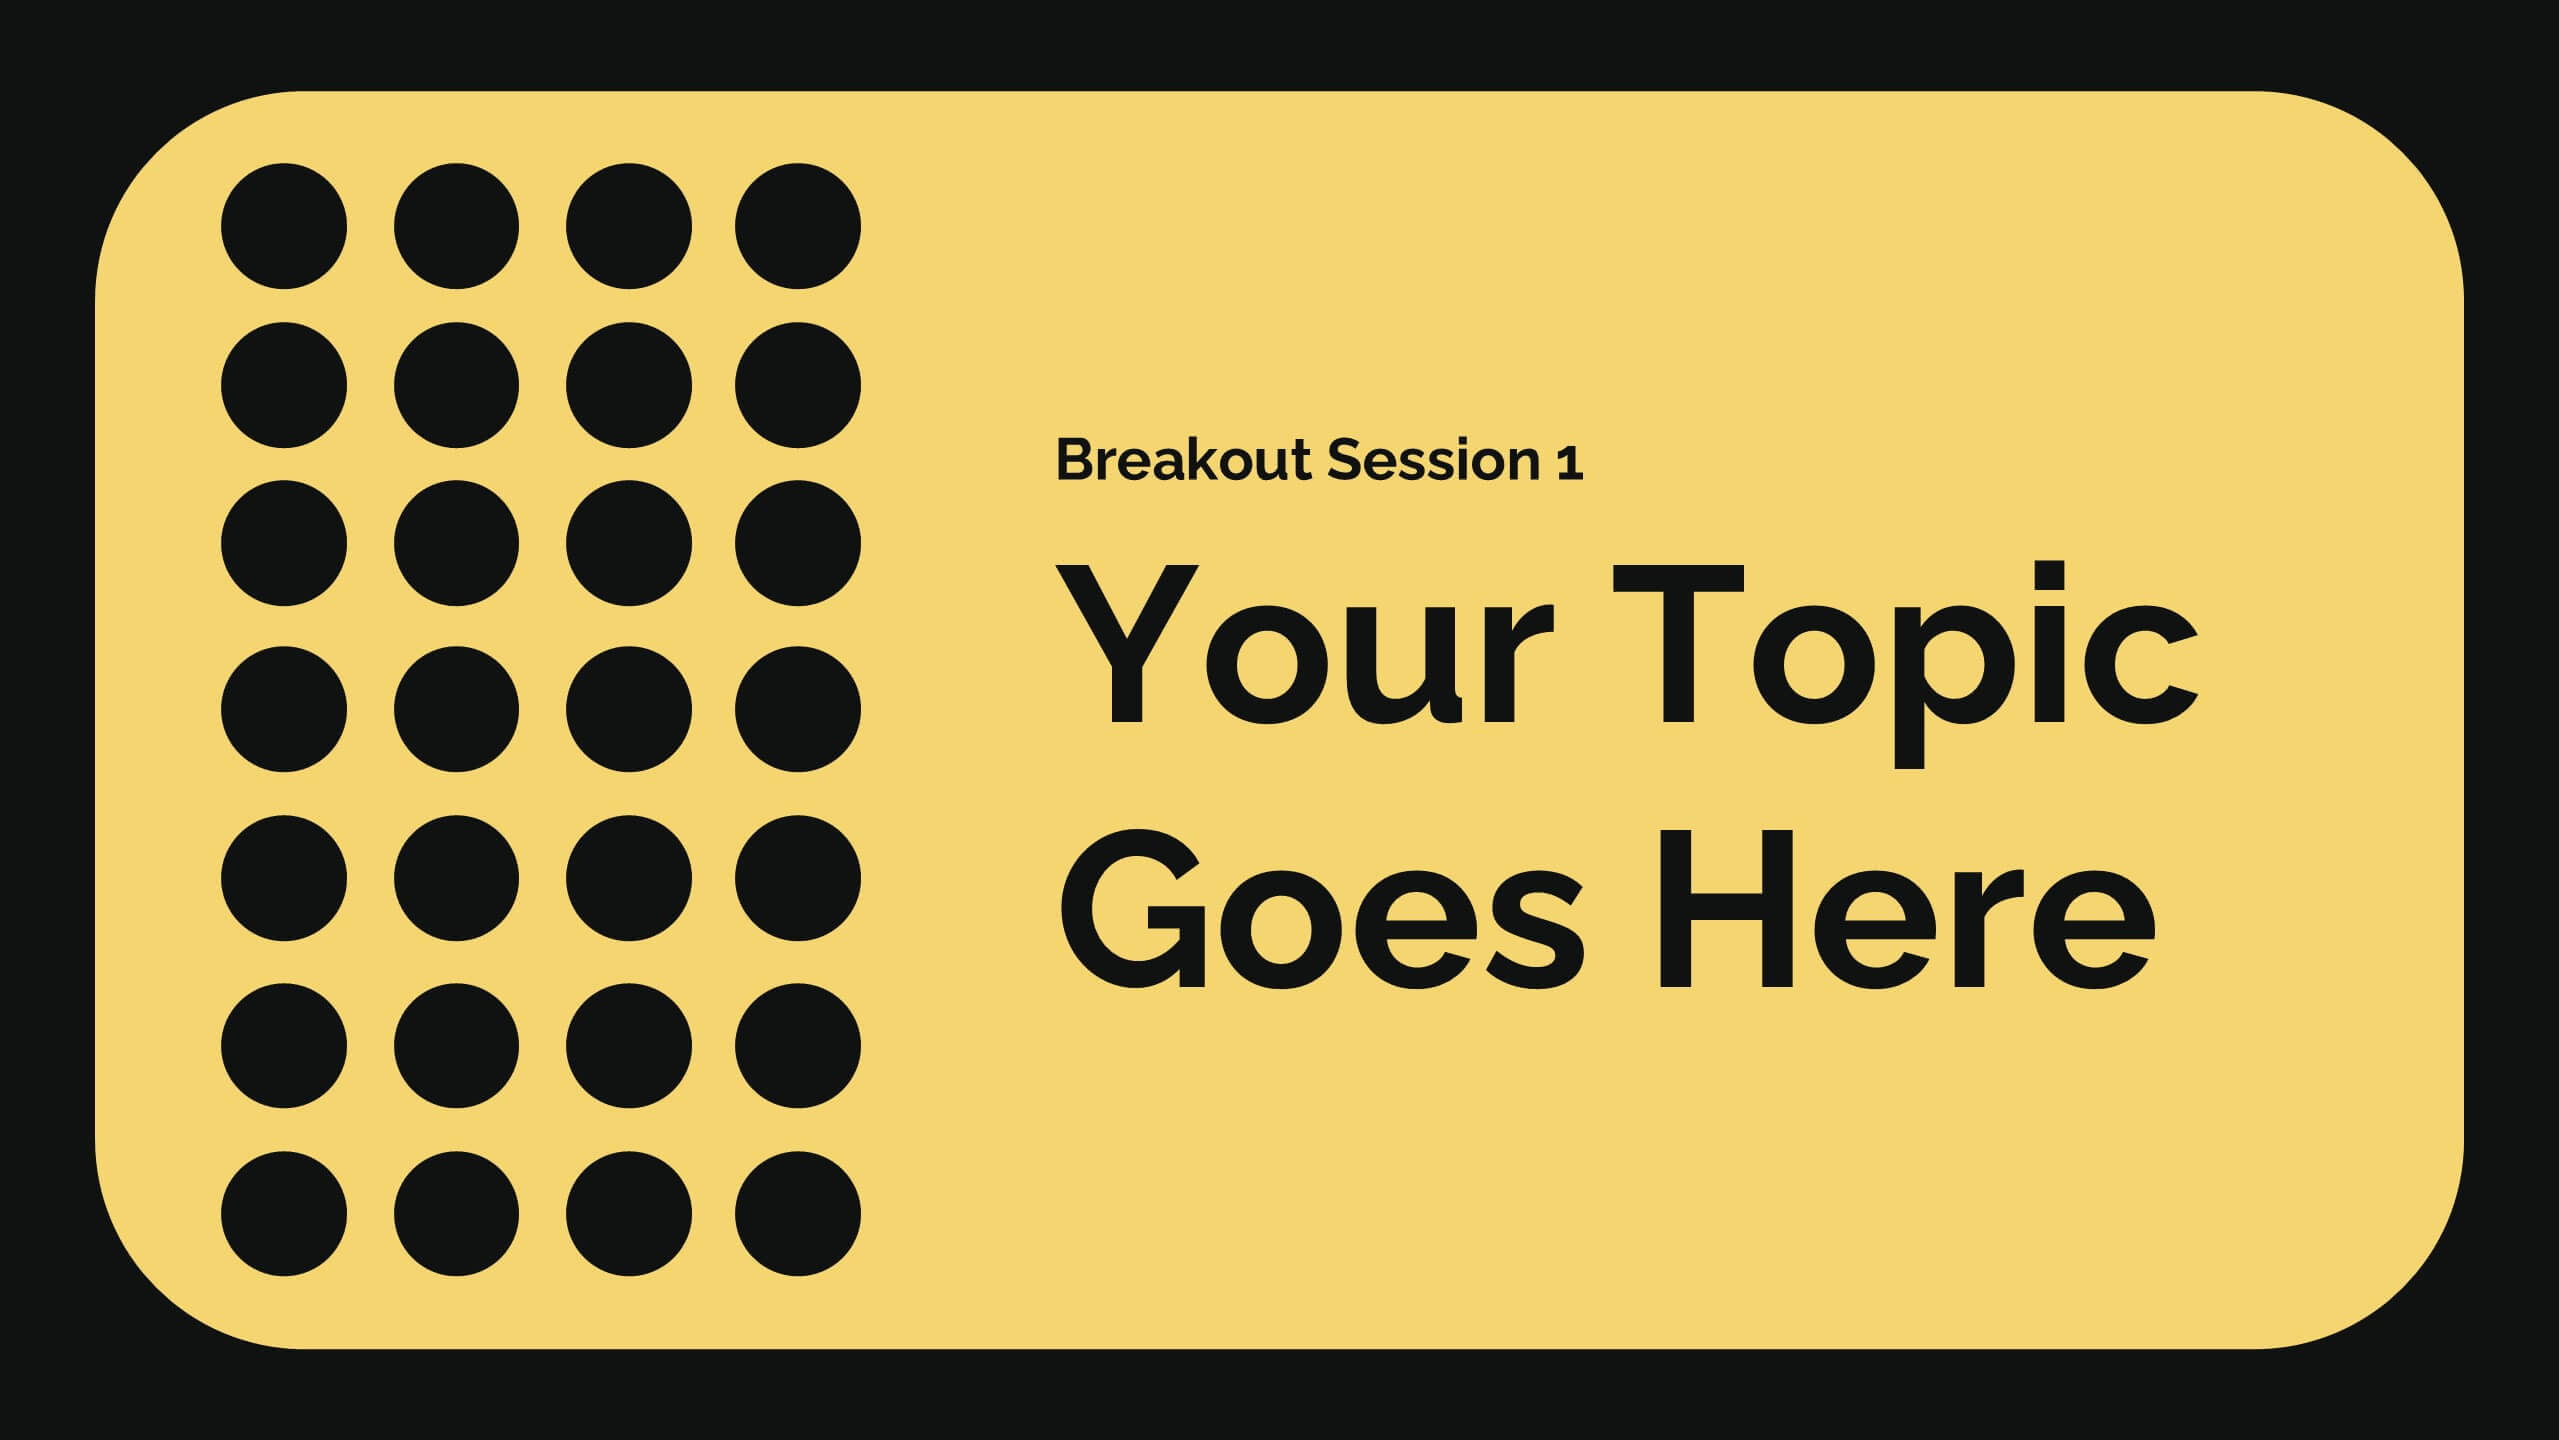
Diamond Business Development Proposal Presentation
Unlock the potential of your business proposals with this bold and engaging presentation template! Perfect for business development pitches, conferences, and workshops, it includes sections for speaker introductions, panel discussions, and session breakdowns. With its clean and professional design, this template ensures clarity and impact. Fully customizable and compatible with PowerPoint, Keynote, and Google Slides.


6 slides
Strategic Blocks in Business Canvas
Visualize and communicate your business model effectively with the Strategic Blocks in Business Canvas Presentation. This slide breaks down all critical segments—Partners, Activities, Resources, Value Propositions, Channels, Revenue Streams, and more—into a clean and colorful layout for strategic planning and stakeholder alignment. Fully editable in PowerPoint, Keynote, and Google Slides.


6 slides
Creative Alphabetic Infographic
Bring your message to life with a bright, alphabet-inspired layout that turns simple letters into eye-catching storytelling elements. This presentation is perfect for organizing steps, categories, or key ideas in a memorable way while keeping everything clear and structured. Fully editable and compatible with PowerPoint, Keynote, and Google Slides.


5 slides
Four-Step Marketing Funnel Plan Presentation
Streamline your messaging with the Four-Step Marketing Funnel Plan Presentation. This clean, vertical funnel layout highlights each stage of your strategy—ideal for visualizing lead nurturing, sales processes, or campaign progression. Each level is clearly marked and editable, helping you deliver focused insights with ease. Fully compatible with PowerPoint, Canva, Keynote, and Google Slides.


6 slides
Targeted Segment Analysis and Mapping Presentation
Highlight your market focus with the Targeted Segment Analysis and Mapping Presentation. This circular layout is perfect for breaking down five audience segments, using subtle icons and visual emphasis for clarity. Ideal for marketers, strategists, and business analysts presenting niche targeting. Fully editable in Canva, PowerPoint, Keynote, and Google Slides.


8 slides
Business Revenue and Profit Analysis Presentation
Analyze and visualize Business Revenue and Profit trends effectively with this modern and data-driven slide template. Featuring a dual-chart layout with reseller performance trends and purchase breakdowns, this slide is ideal for financial reports, sales presentations, and strategic business meetings. Fully customizable, you can edit the text, colors, and data to fit your specific needs. Compatible with PowerPoint, Keynote, and Google Slides for easy editing and seamless integration.


5 slides
Africa Country Borders Presentation
Bring geography to life with a clean, modern map design that highlights country boundaries and key regions across Africa. Perfect for showcasing regional data, market analysis, or project coverage, this layout ensures clarity and precision. Fully compatible with PowerPoint, Keynote, and Google Slides for easy customization and use.


24 slides
Dreamveil UX Strategy Plan Presentation
Enhance your user experience strategy with this professionally designed UX Strategy Plan presentation. Covering essential topics such as user research, wireframes, prototyping, design principles, and usability guidelines, this deck offers a structured approach to refining your UX/UI processes. With a clean layout and engaging visuals, it’s perfect for teams, stakeholders, and clients looking to improve user interactions and design consistency. Fully customizable in popular formats like PowerPoint, Keynote, and Google Slides.