


Features
- 4 Unique slides
- Fully editable and easy to edit in Microsoft Powerpoint, Keynote and Google Slides
- 16:9 widescreen layout
- Clean and professional designs
- Export to JPG, PDF or send by email


Do you have any questions?
Recommend

20 slides
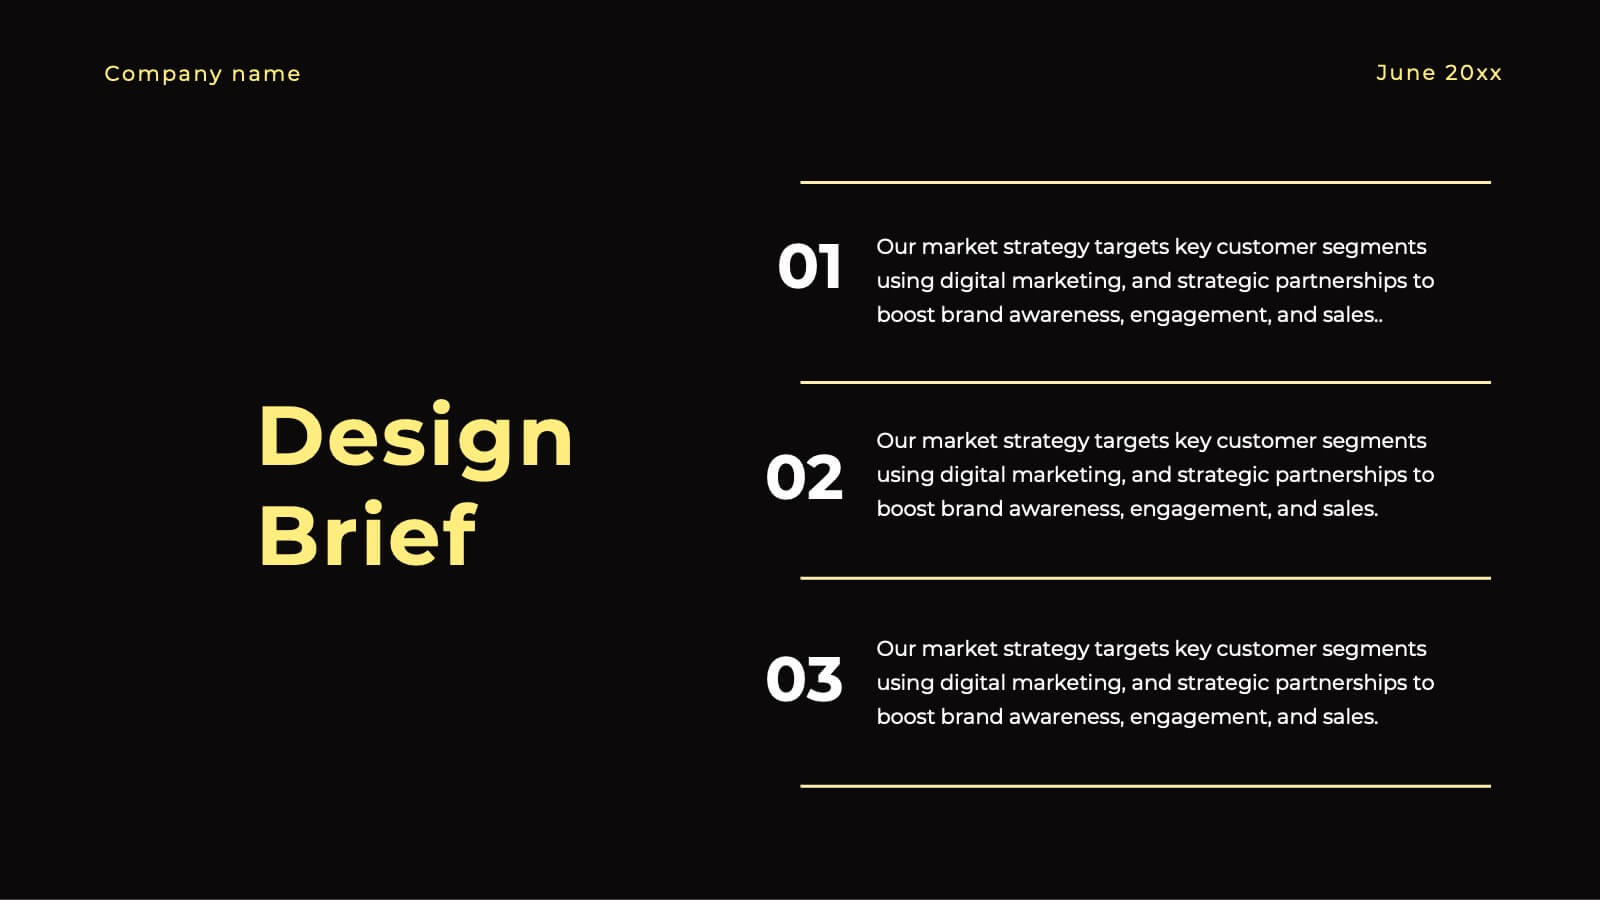
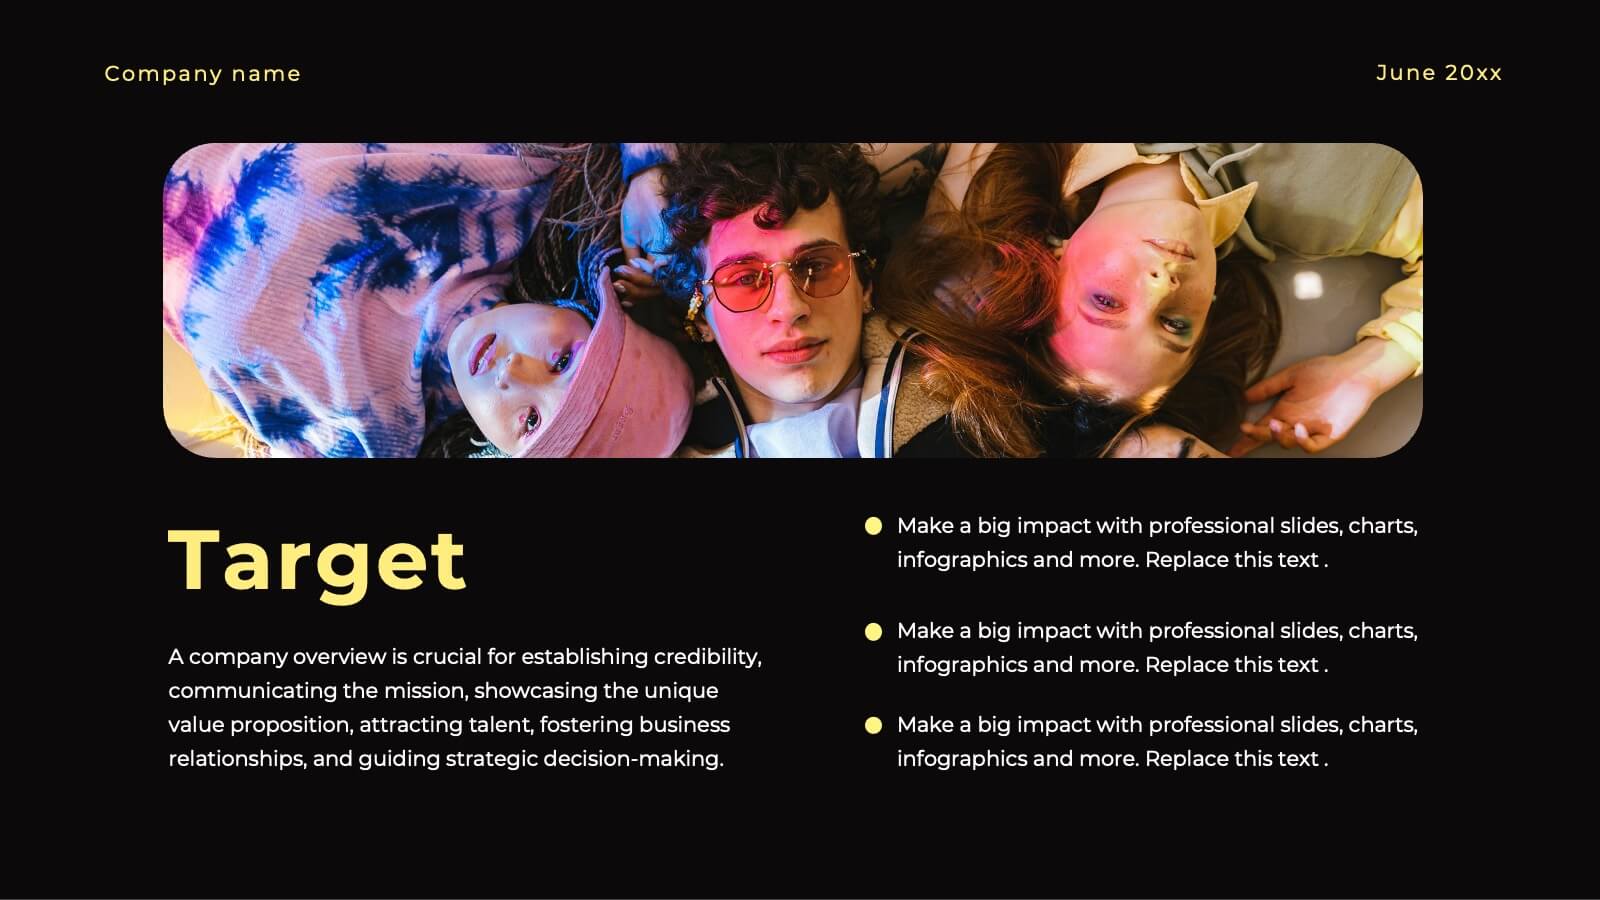
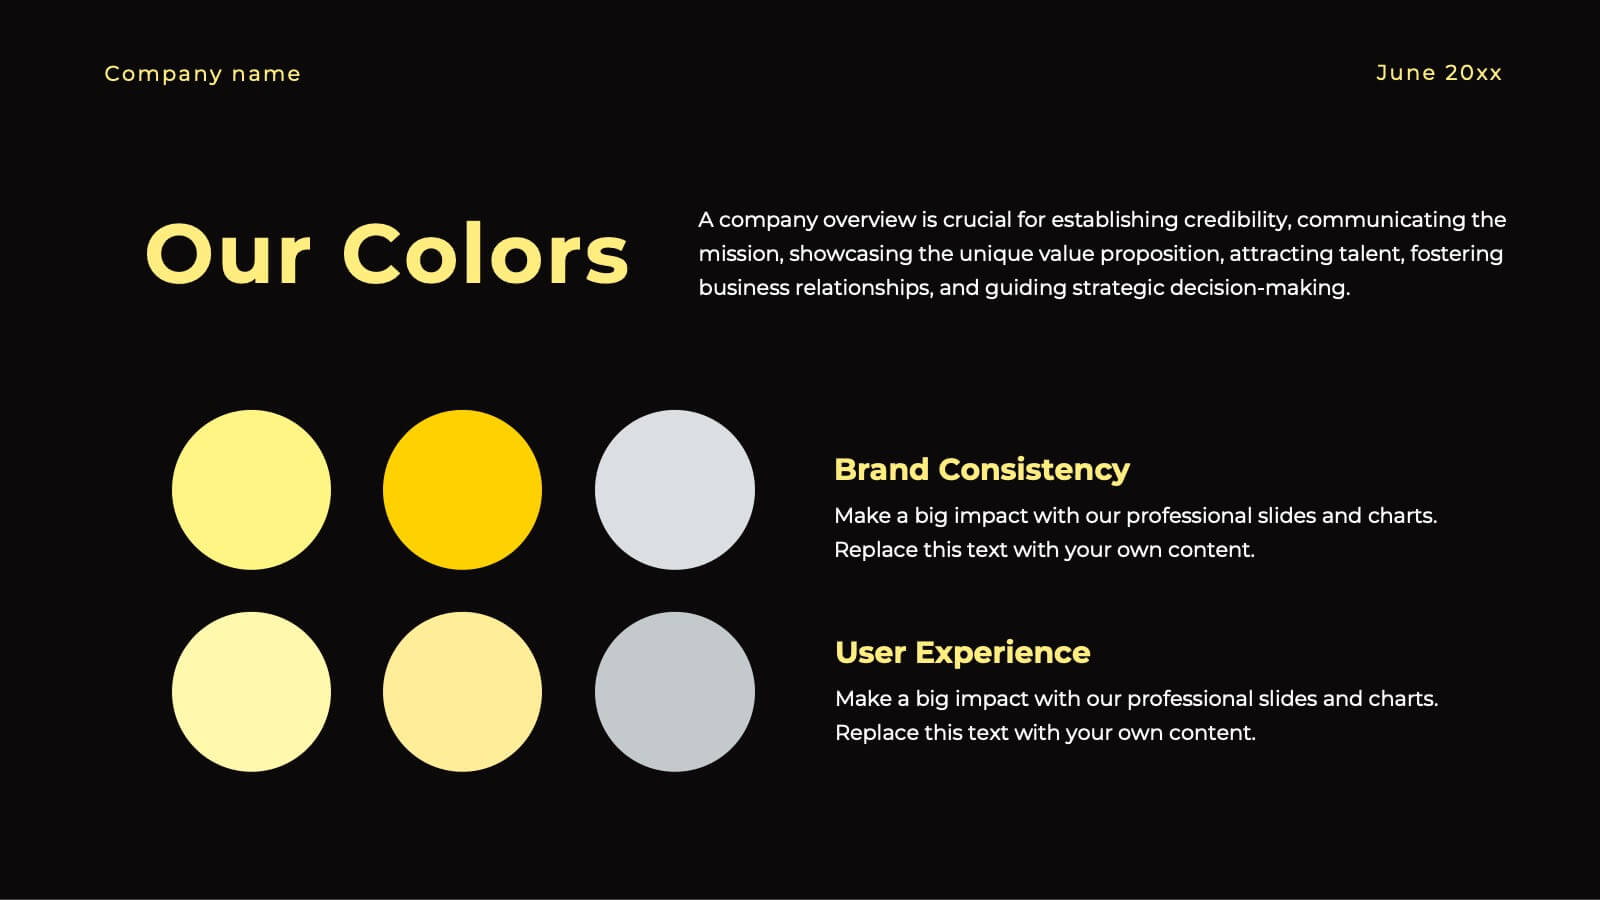
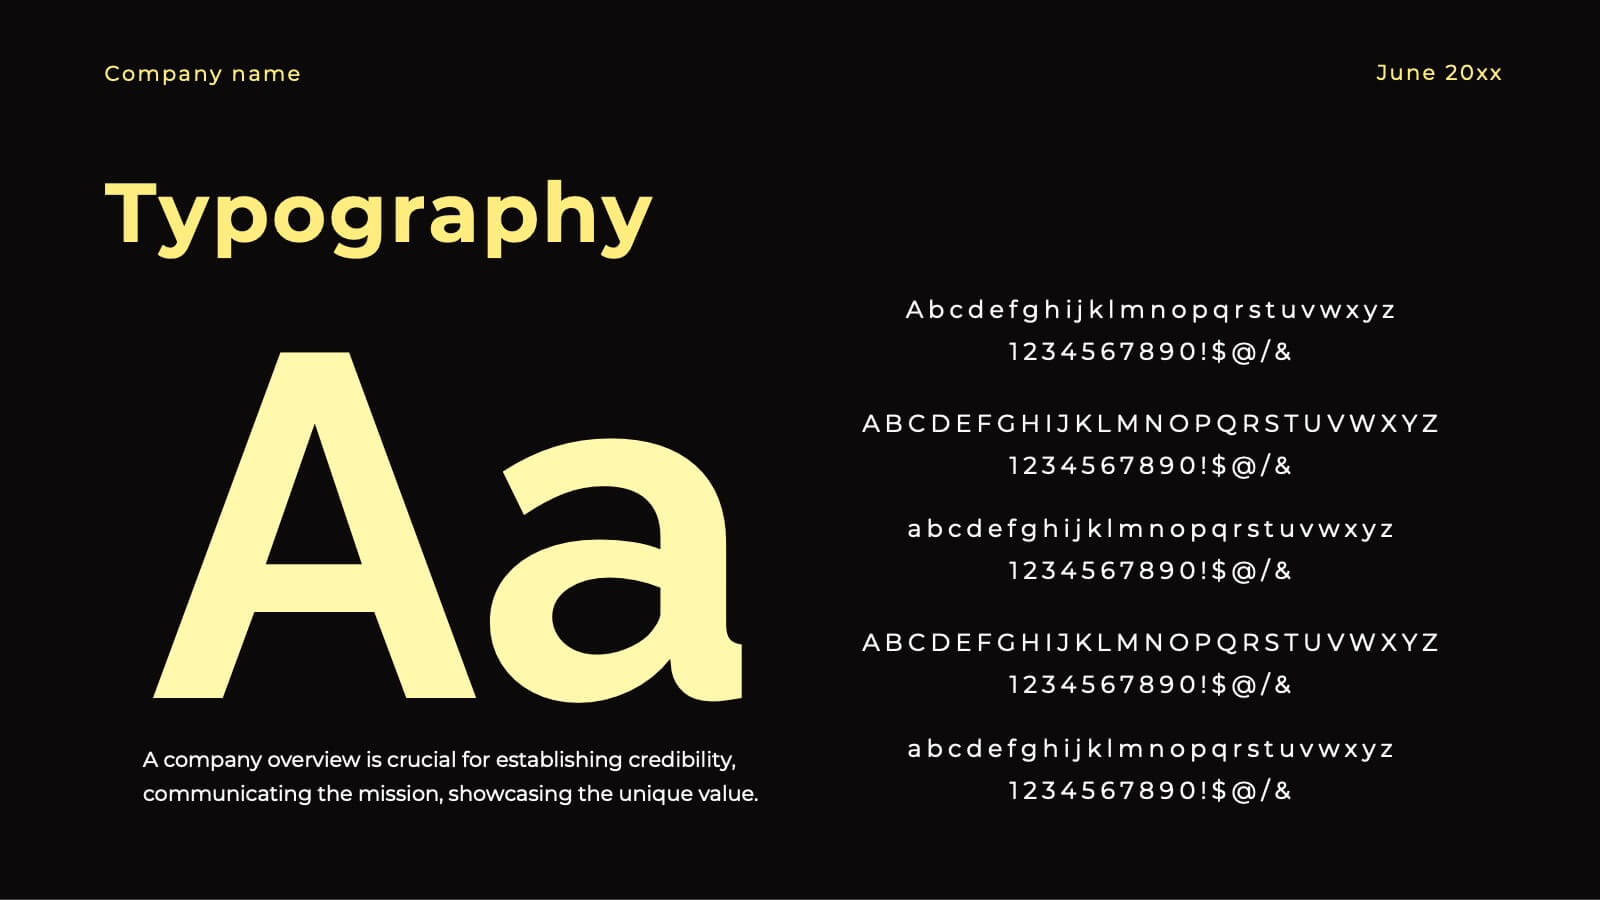
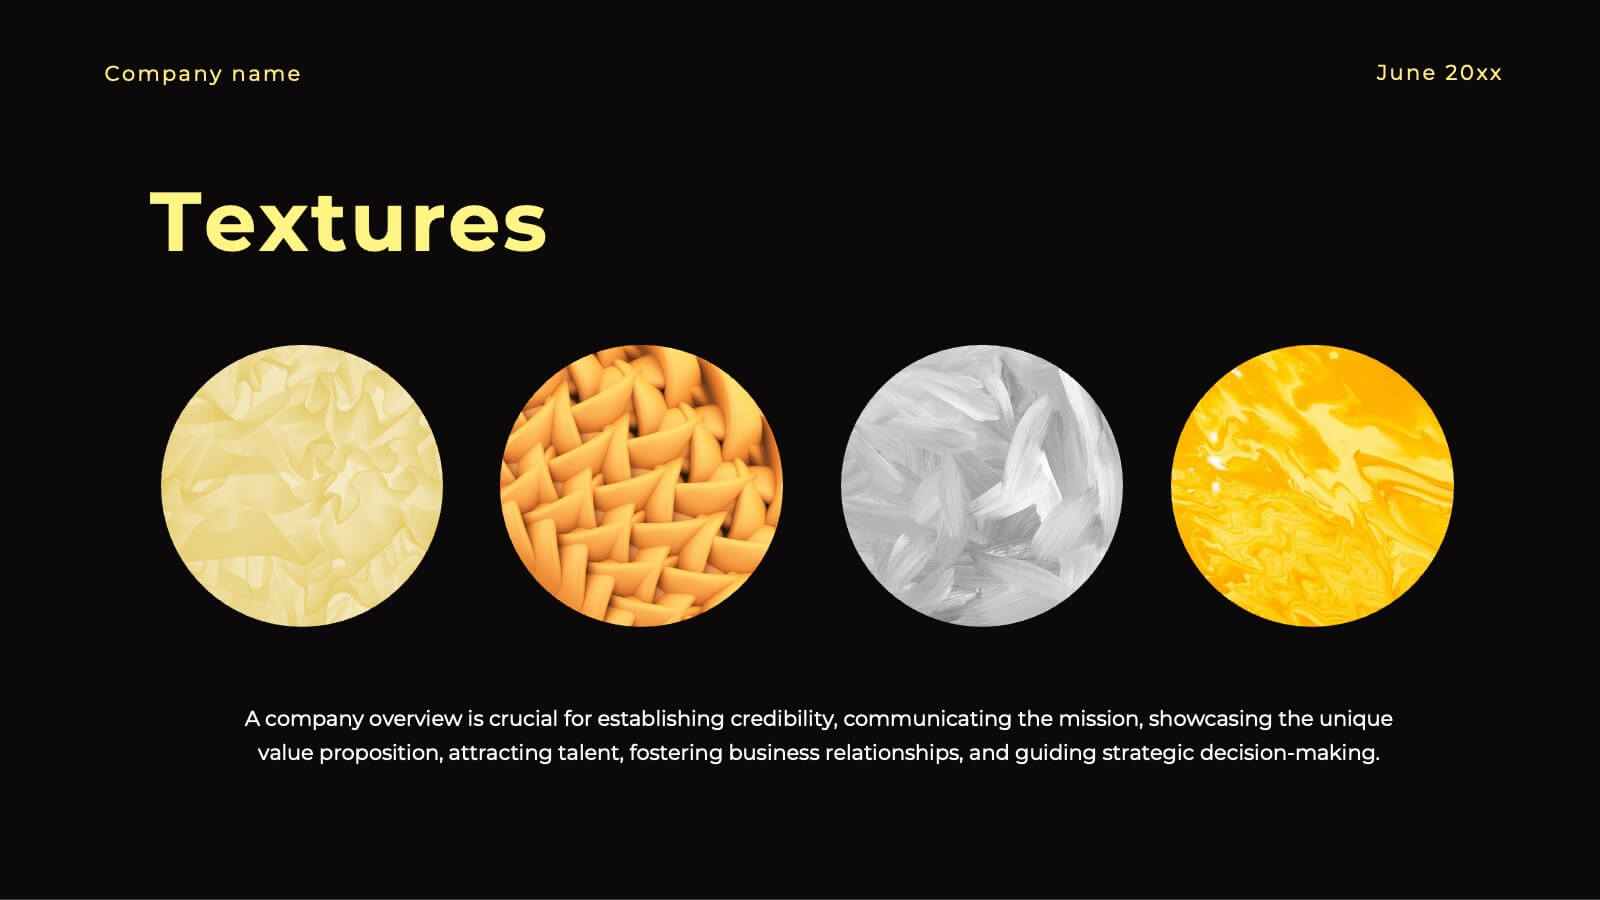
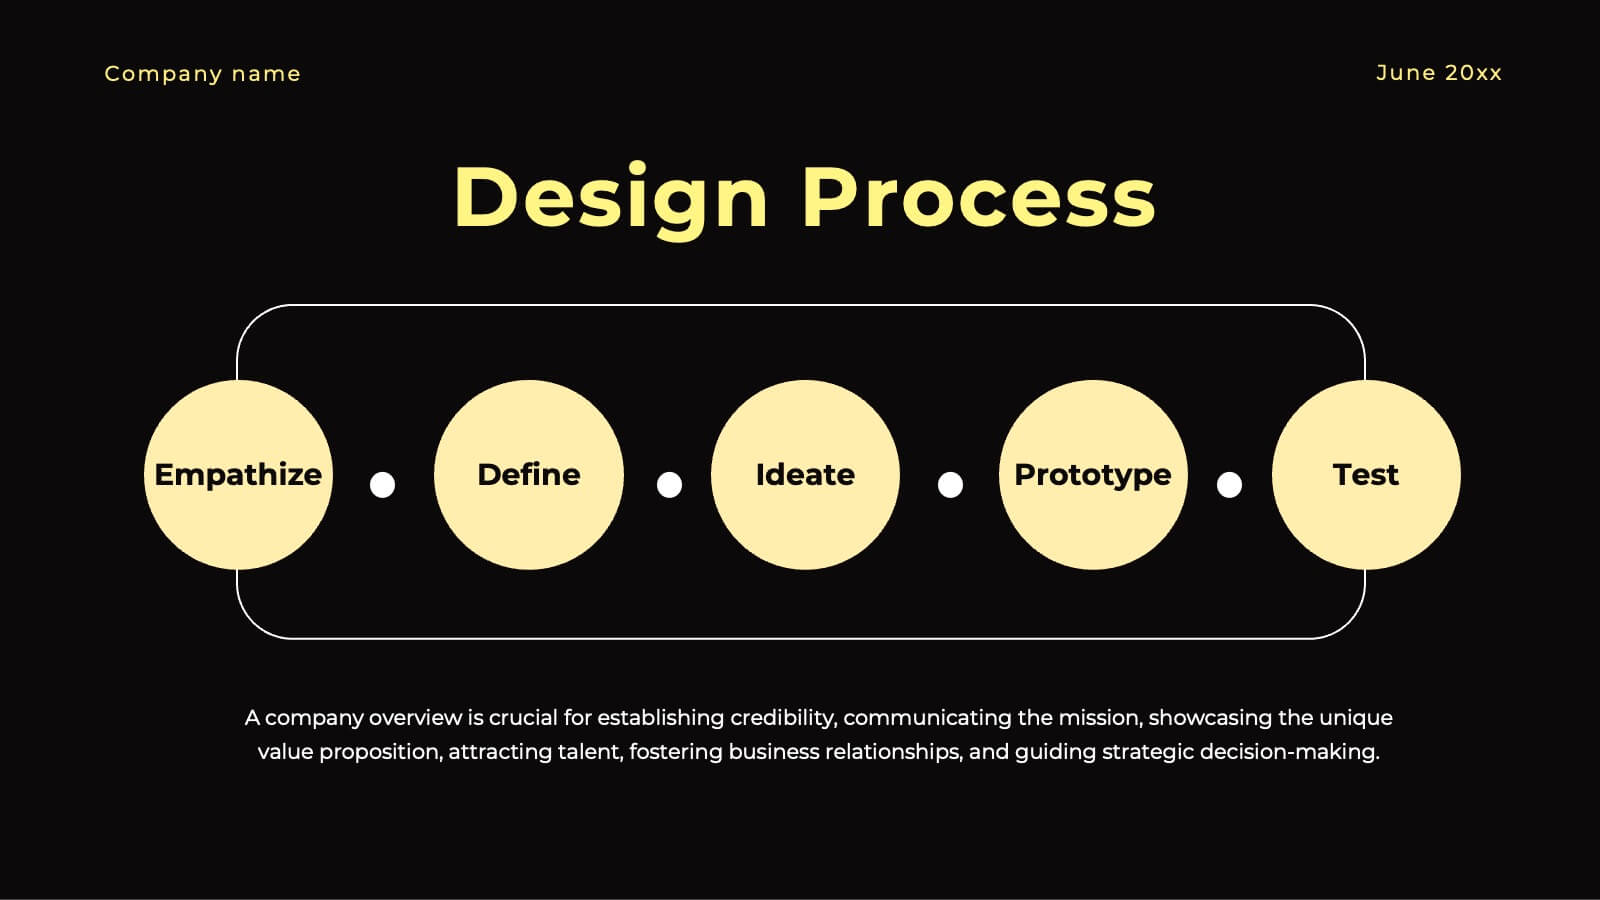
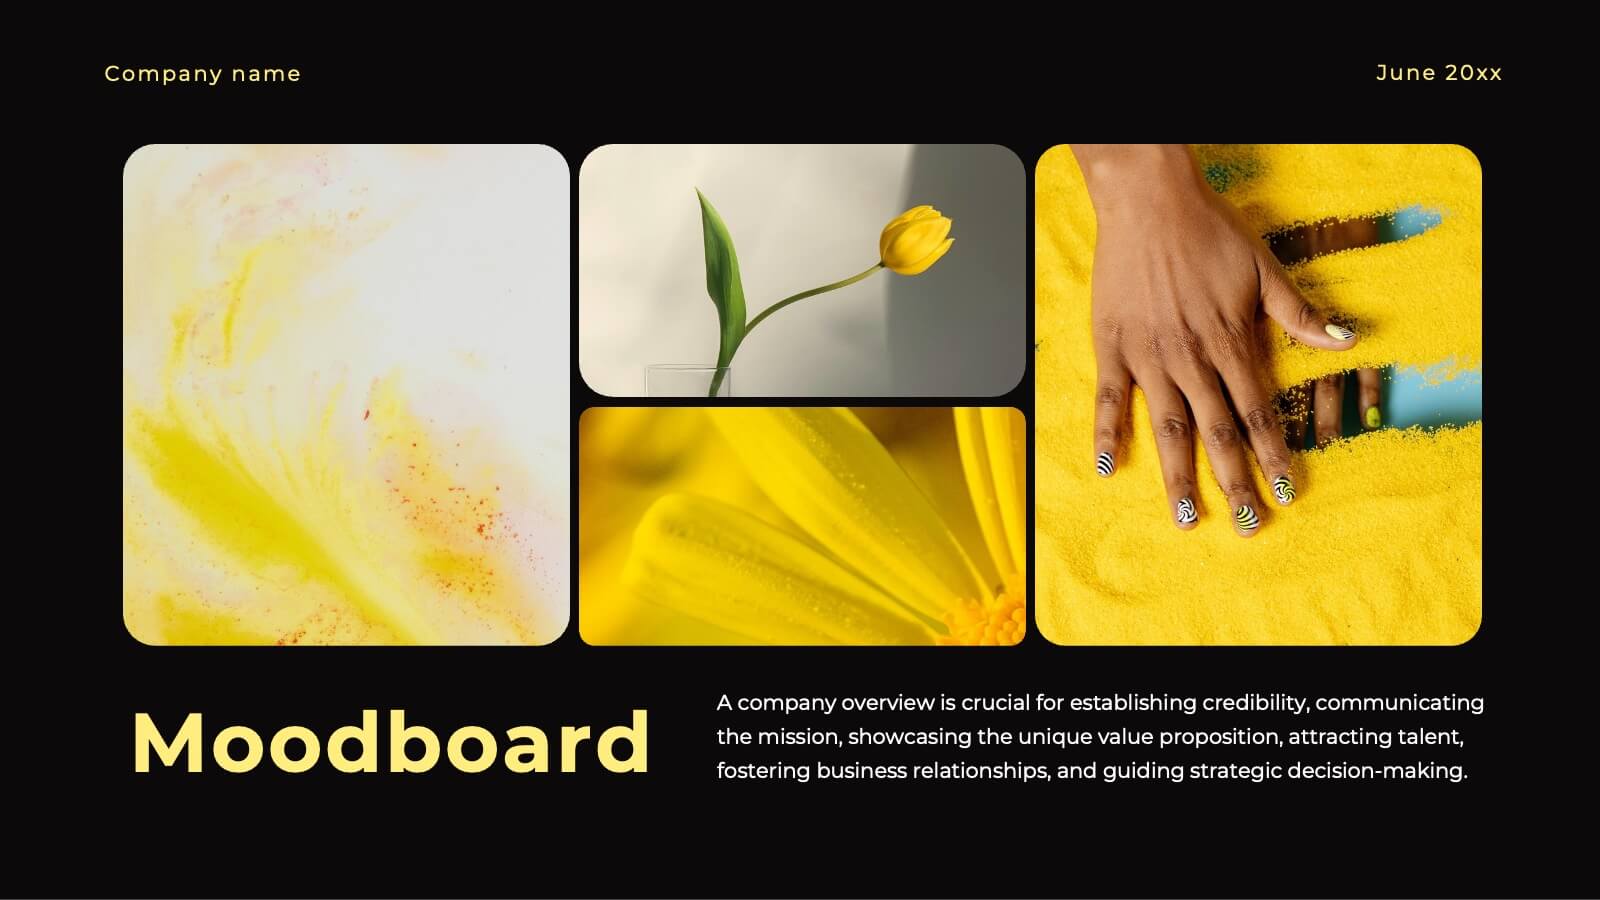
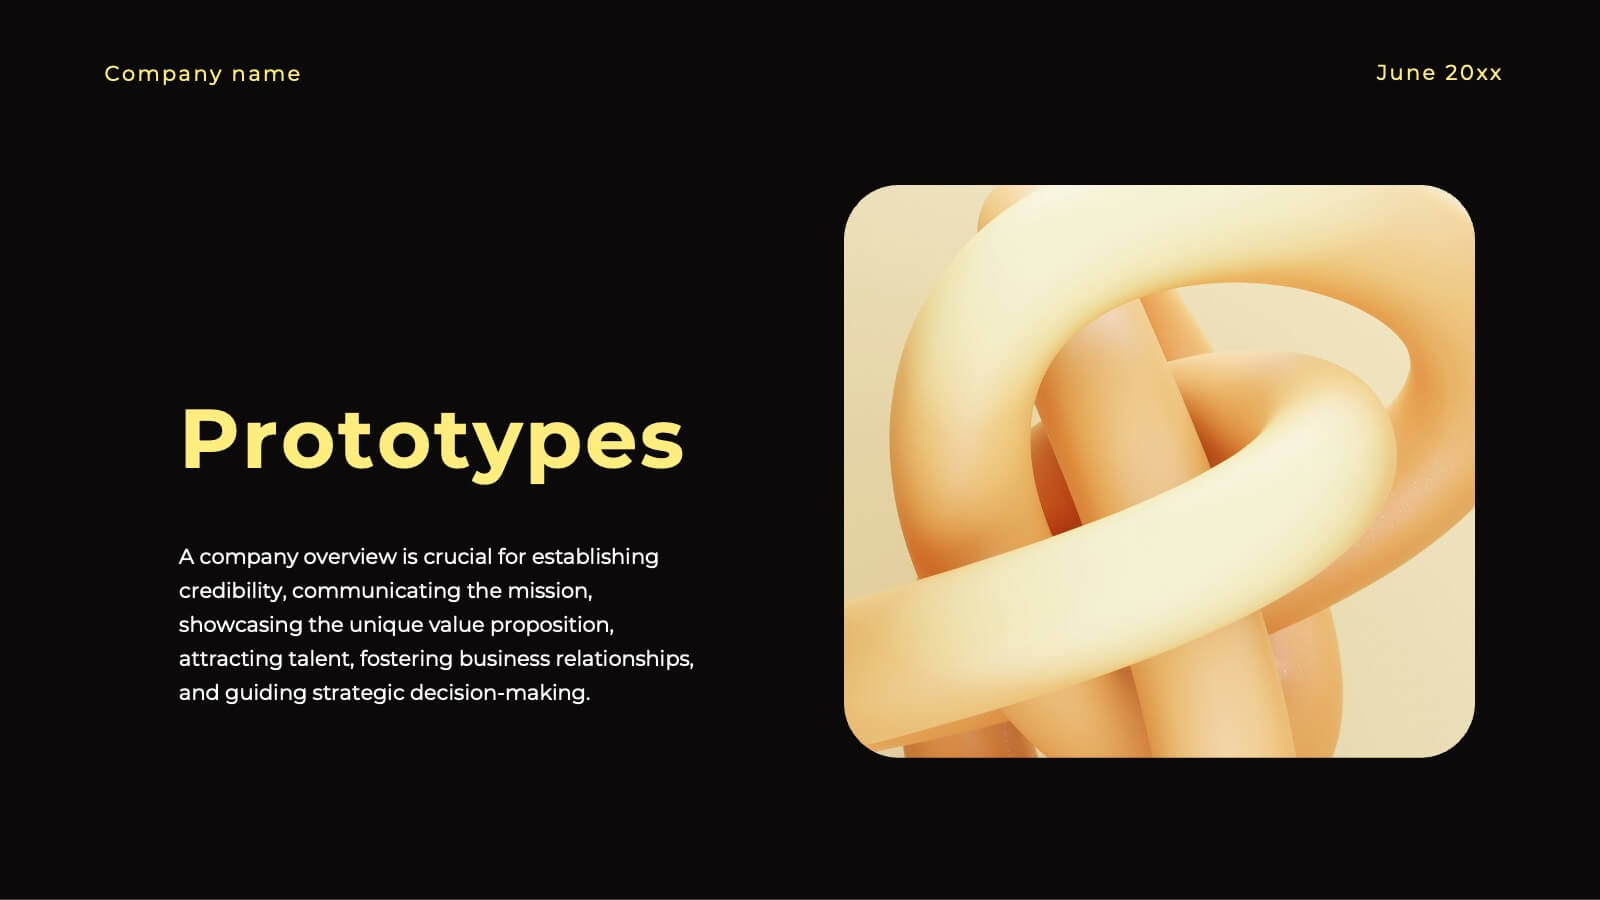
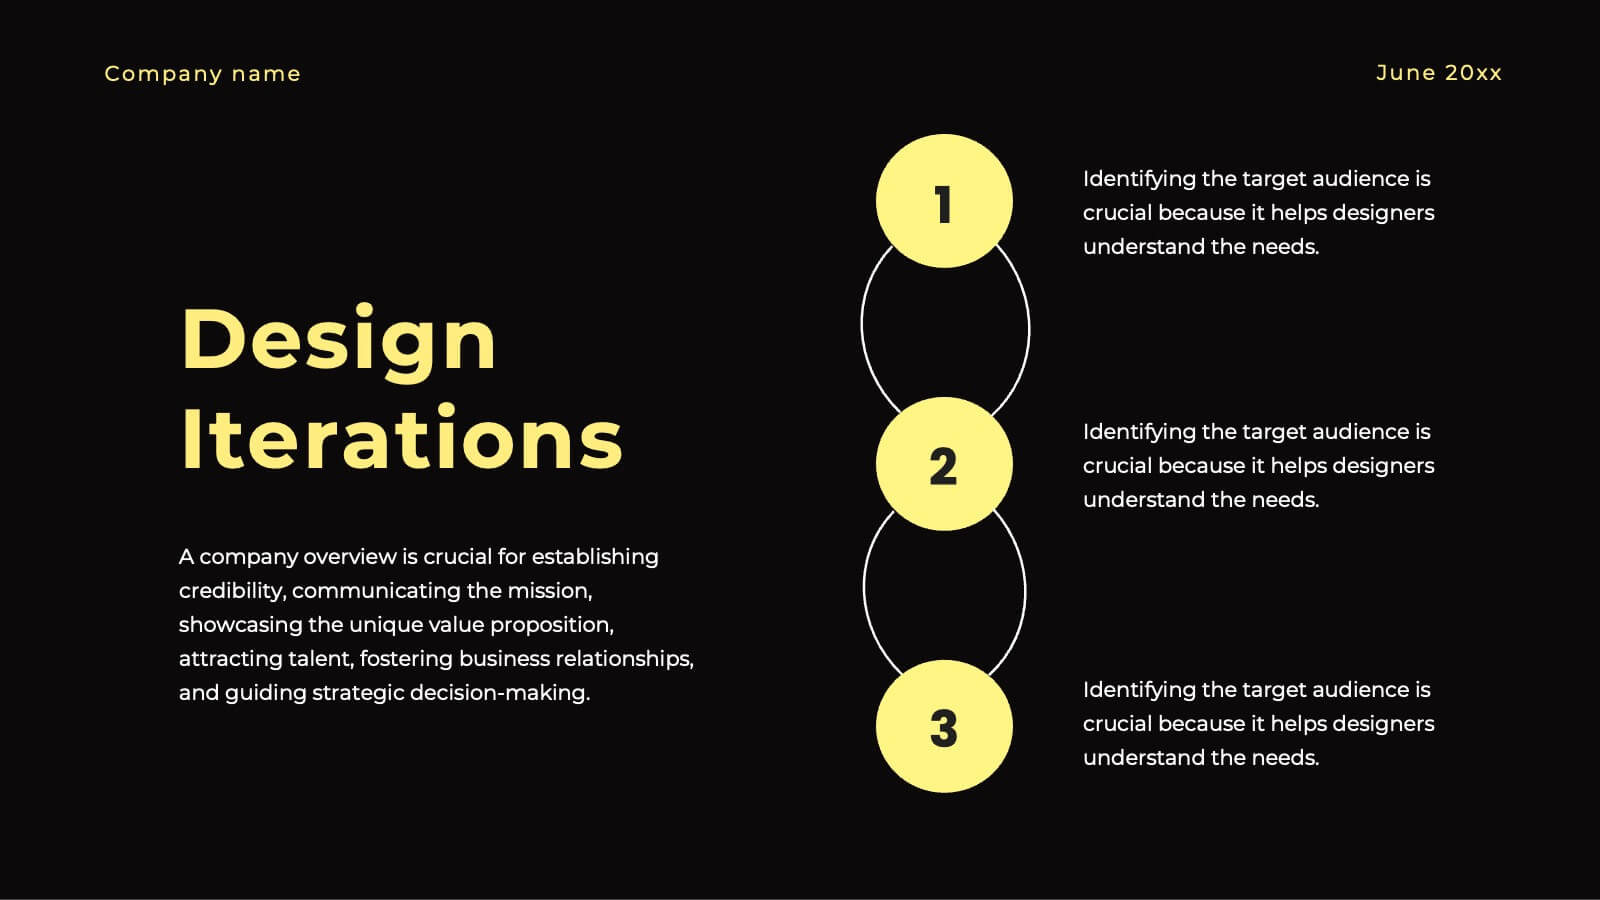
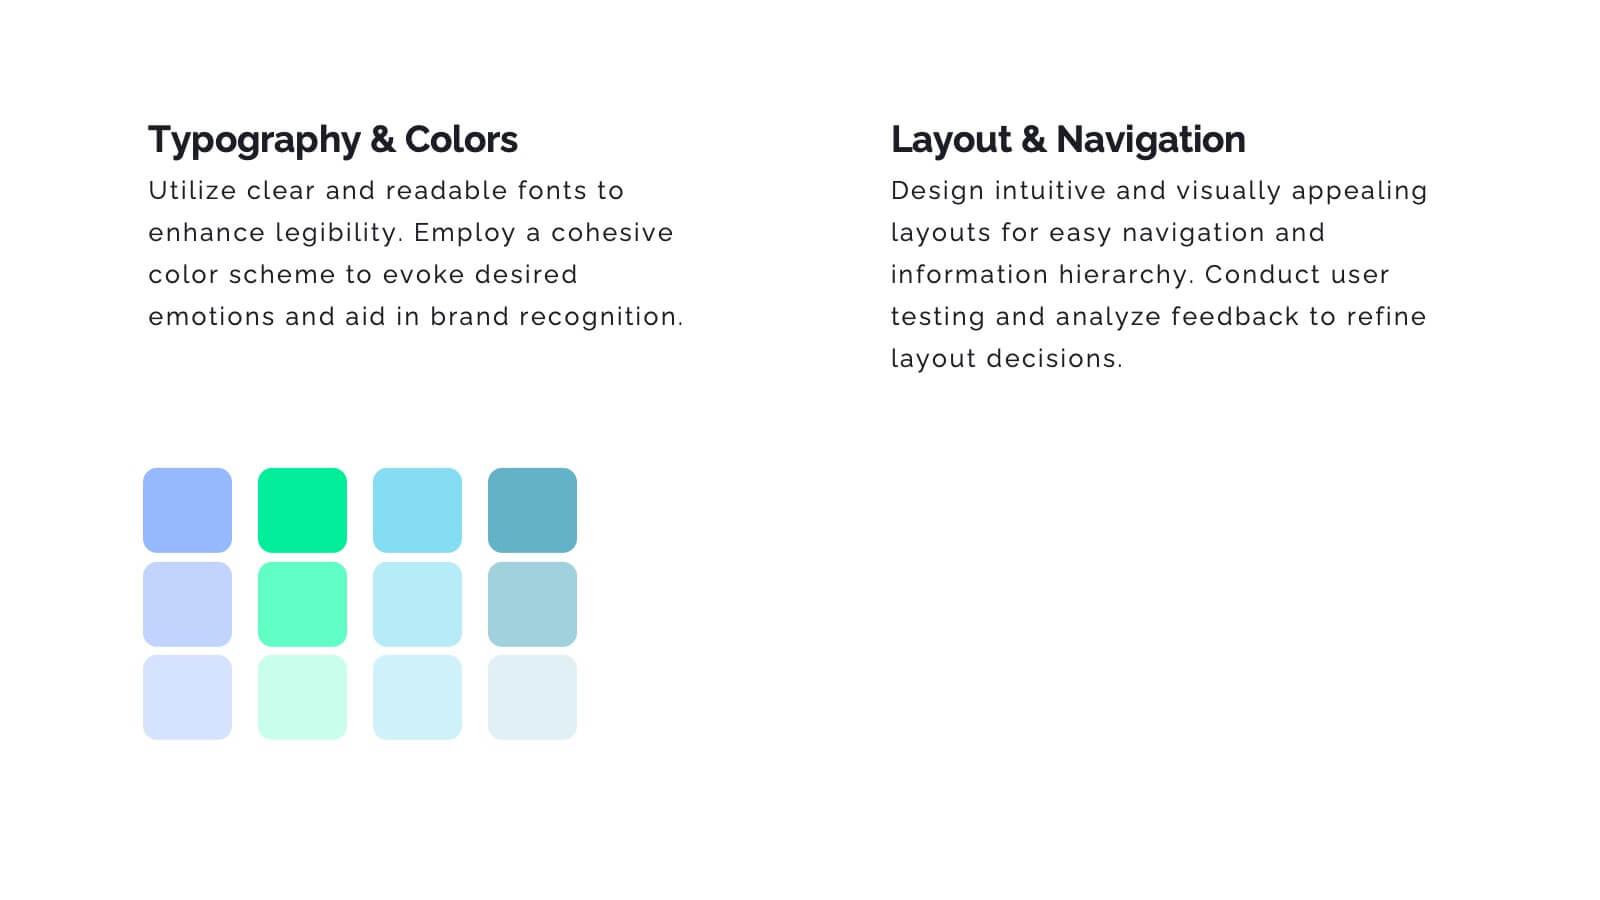
Ignite Creative Design Report Presentation
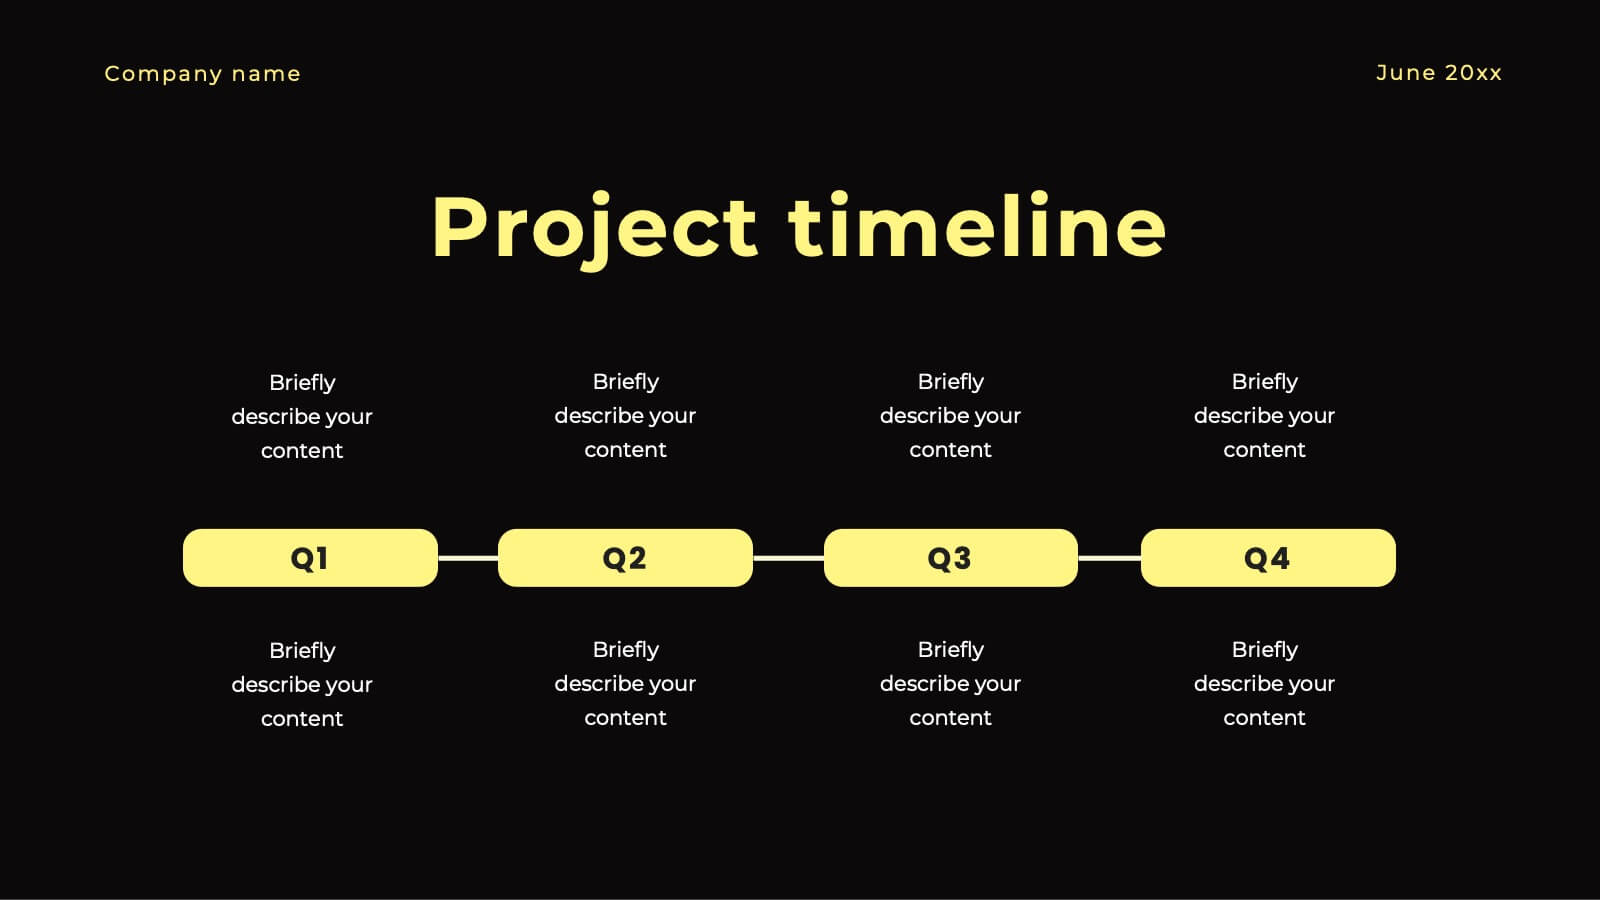
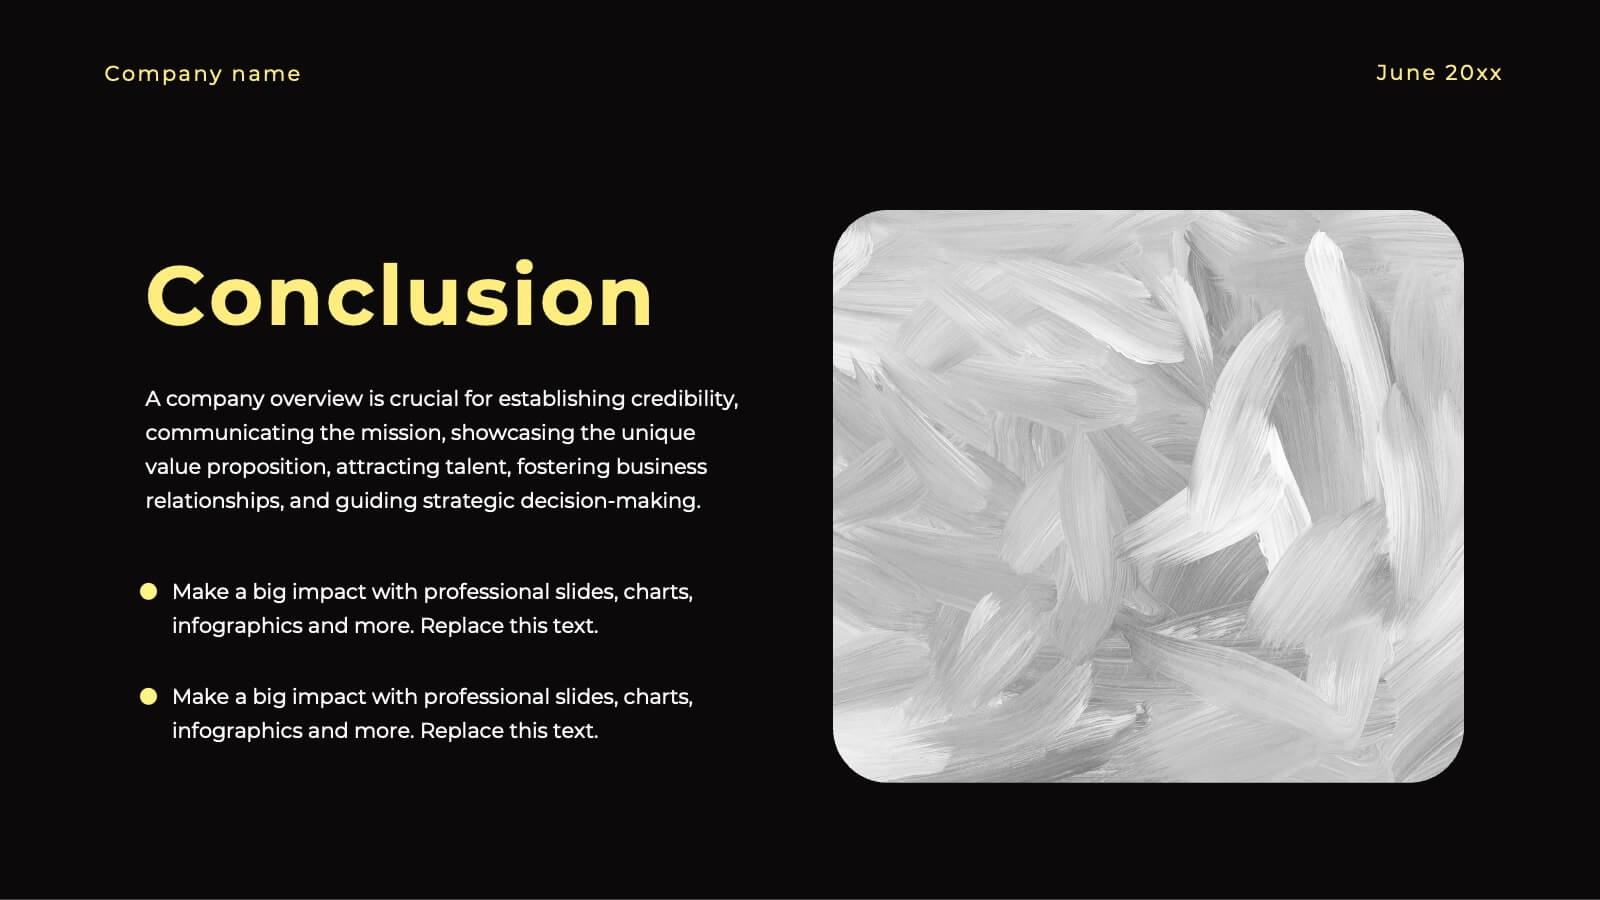
Unleash your creativity with this stunning design presentation template! Perfect for showcasing concept development, design processes, and final prototypes, it includes slides for typography, color palettes, and project timelines. Captivate your audience with sleek visuals and detailed content. Compatible with PowerPoint, Keynote, and Google Slides for seamless presentations on any platform.


7 slides
Time Management Infographic Presentation Template
Time management skills are important in all aspects of life, not just work. Mastering time management allows you to get everything that you want out of your day. This time management template is the perfect tool to help you stay productive. Keep track of tasks, create a schedule and organize time where you need it most. Use this template to build a database of your weekly tasks, daily activities and recurring tasks that can be easily structured in a clock view. This time management template Is compatible with Powerpoint, Keynote, and Google Slides, so you can use it on any device.


5 slides
Beer Drinking Infographics
The art of beer encompasses the brewing process, the craftsmanship of creating unique flavors and styles, and the enjoyment of this ancient beverage. These infographics are perfect for showcasing key facts, statistics, and interesting information related to the world of beer. This template is ideal for breweries, beer enthusiasts, bartenders, or anyone interested in sharing knowledge about different beer types, brewing processes, or beer culture. The template offers a variety of slide layouts to cover different aspects of beer drinking. The template provides sections for discussing different beer styles, brewing processes, and beer tasting.


5 slides
Sprint Planning and Agile Cycle Overview Presentation
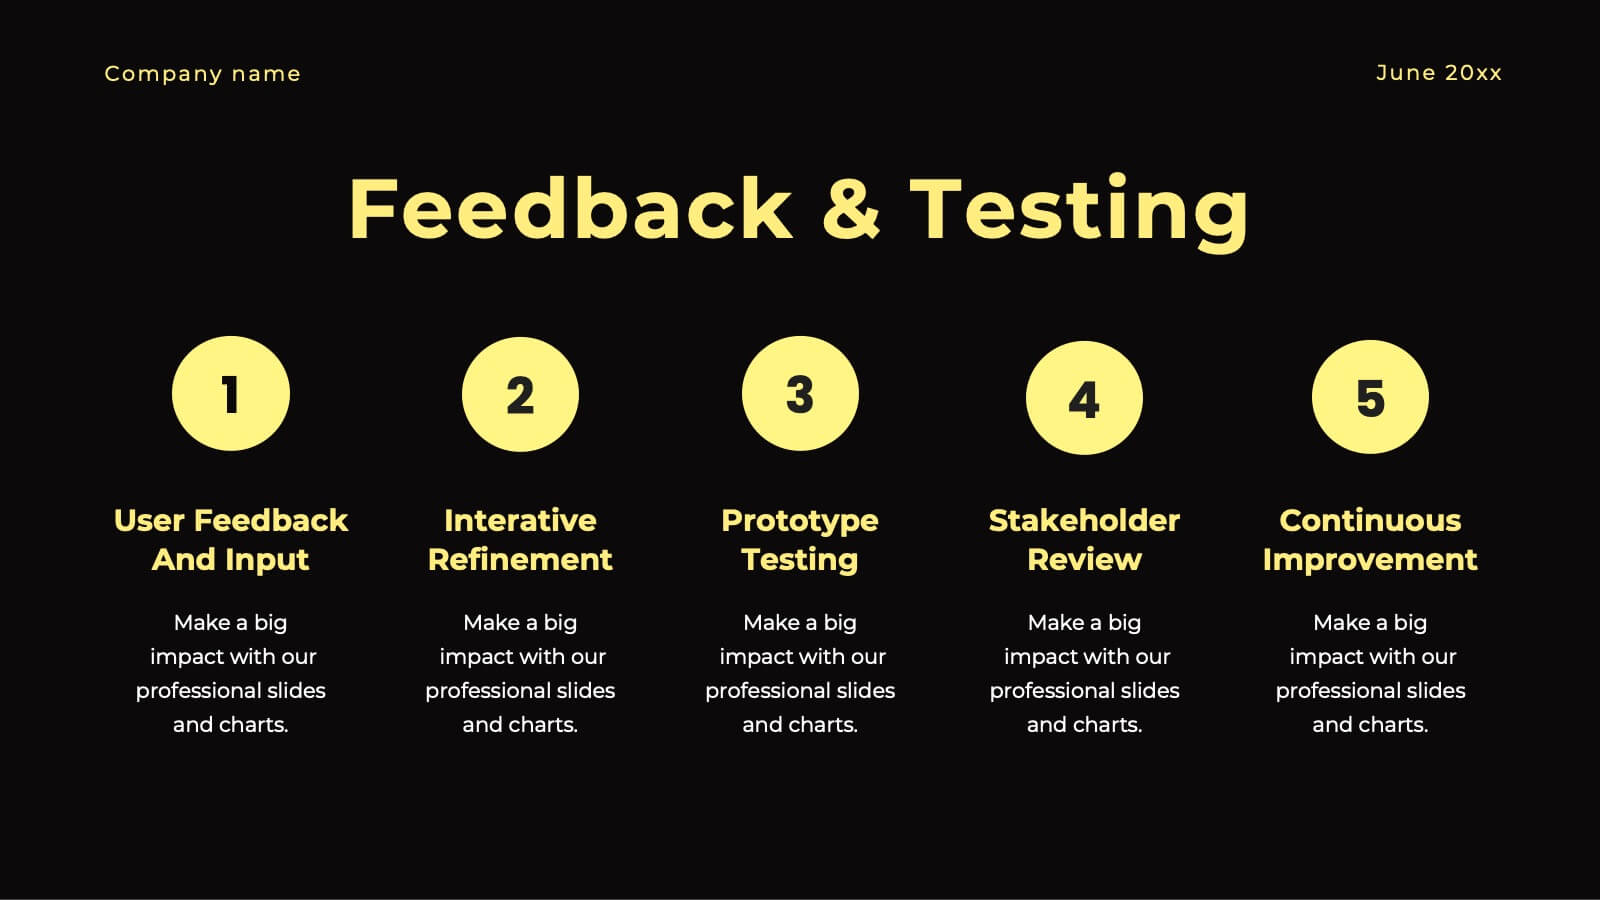
Break down agile sprints with this clean, circular cycle layout. Ideal for scrum teams and product managers to illustrate sprint planning, task flow, and iterative progress. Includes five key stages with icon support. Fully customizable in PowerPoint, Keynote, and Google Slides for agile ceremonies, planning sessions, or team training.


5 slides
Strategic HR Planning with Skills Gap Analysis
Lead with insight. The Strategic HR Planning with Skills Gap Analysis slide is your go-to tool for aligning talent strategy with organizational needs. Ideal for showcasing workforce priorities, skill readiness, and actionable development plans—fully editable in PowerPoint, Keynote, and Google Slides.


8 slides
Task Management Process Presentation
Bring clarity and momentum to every workflow with this clean, step-by-step layout designed to break down tasks, handoffs, and progress stages. This presentation helps teams visualize responsibilities and streamline execution with ease. Fully customizable and ready to use in PowerPoint, Keynote, and Google Slides.


7 slides
Chart Comparison Infographic Presentation
Chart Comparison is the process of comparing different charts or graphs to identify similarities. It involves analyzing multiple sets of data by visually presenting them in charts. Use this template to show the comparison of various charts and how things look when they are compared. This template will help you create a professional Infographic presentation that highlights the key differences between data sets. Each chart can have it's own color, so you can use any color you want. You can also add text in the chart with your own content, and edit in Powerpoint, Keynote, or Google Slides.


4 slides
Green Business and Climate Goals Presentation
Bring your sustainability message to life with a fresh and vibrant layout that guides viewers through key milestones. This template helps communicate eco-friendly initiatives and climate strategies in a simple timeline format. Ideal for showcasing goals, progress, and impact. Fully compatible with PowerPoint, Keynote, and Google Slides for easy editing.


10 slides
Customer Satisfaction and Smile Rating Presentation
Visualize customer experience in a clear and engaging way with this Customer Satisfaction and Smile Rating slide. Featuring a vertical feedback meter and 5 customizable rating levels, this template is ideal for highlighting user sentiment, service evaluations, or feedback summaries. Perfect for performance reviews, UX reports, or NPS breakdowns. Compatible with PowerPoint, Keynote, and Google Slides.


6 slides
McKinsey Strategy Implementation Model Presentation
Visualize organizational alignment with the McKinsey 7S Model slide. Featuring a clean circular layout, it highlights Strategy, Structure, Systems, Shared Values, Style, Staff, and Skills. Ideal for consulting, planning, or leadership presentations. Fully editable and compatible with PowerPoint, Google Slides, and Keynote for easy customization and branding.


6 slides
Value Chain Optimization and Analysis
Highlight each step that powers your business with this clean and modern value chain template. Ideal for mapping processes, identifying improvement areas, and aligning strategy with operations, this layout makes analysis simple and visual. Fully compatible with PowerPoint, Keynote, and Google Slides.


21 slides
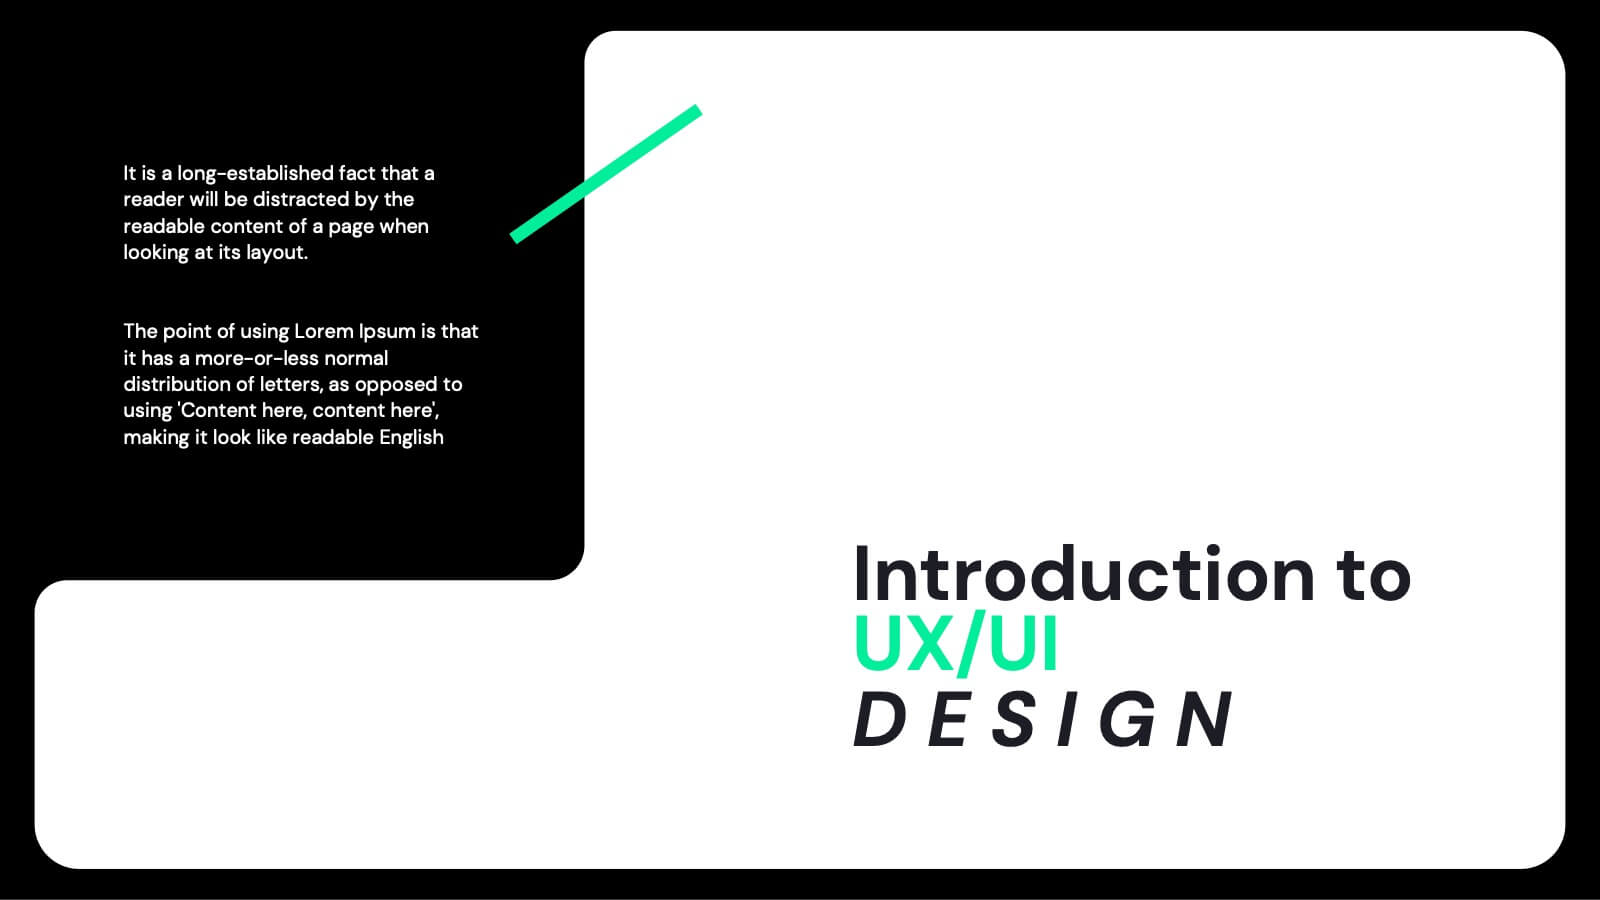
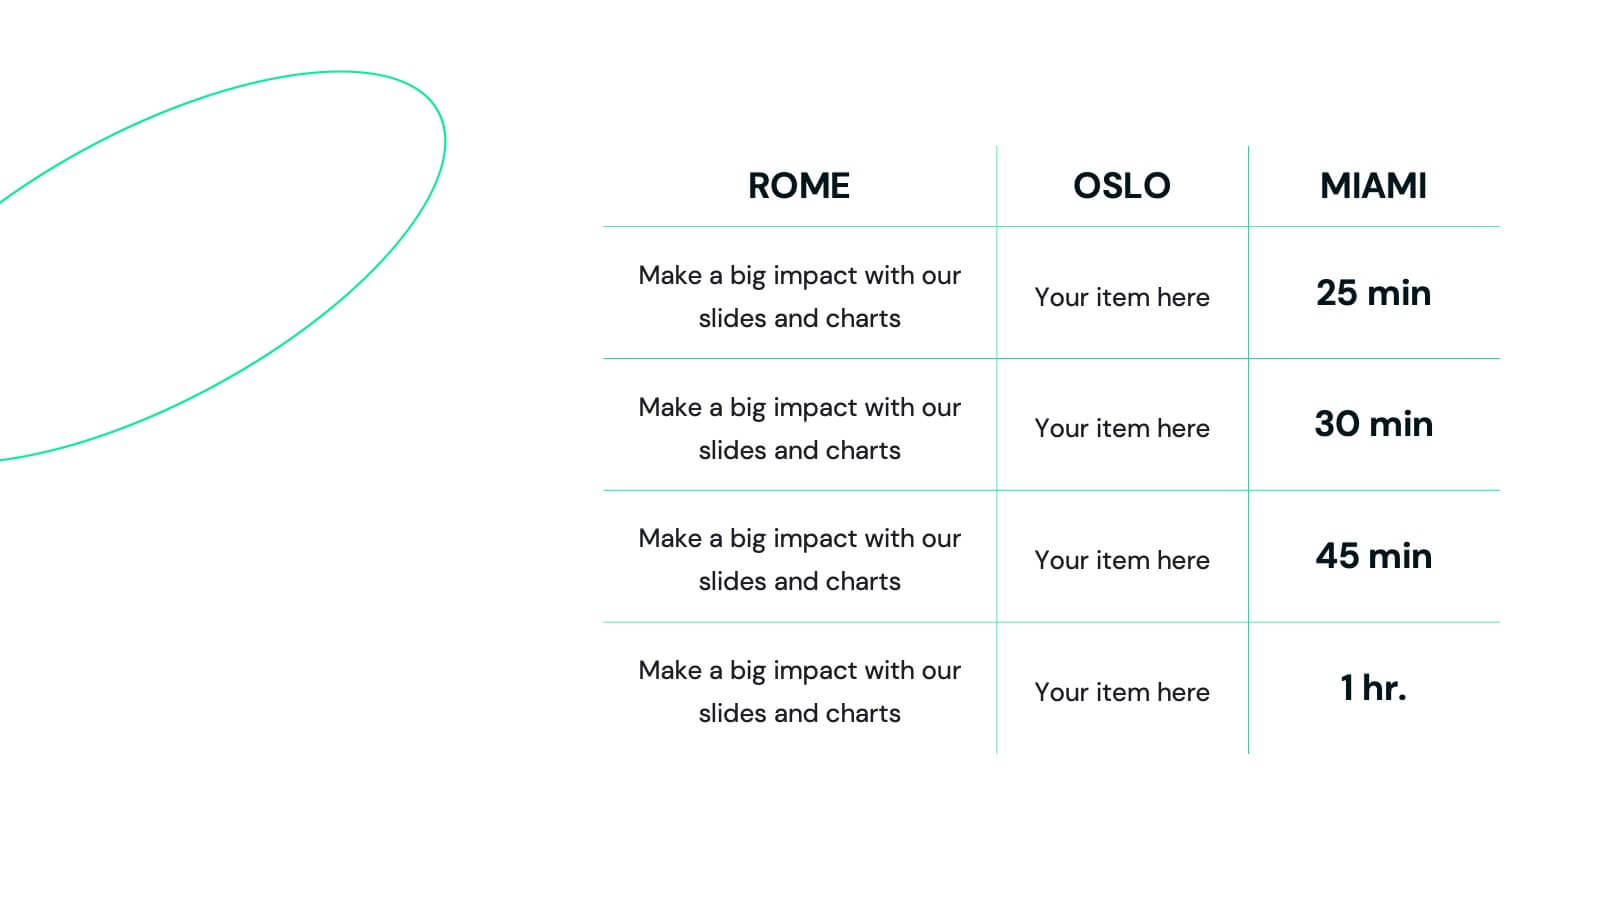
Juno UX Case Study Presentation
Enhance your UX presentations with this sleek, user-friendly template designed for showcasing detailed case studies and user research. With a modern layout and clear sections for user journey mapping, prototyping, and usability guidelines, this template ensures a professional and engaging presentation. Compatible with PowerPoint, Keynote, and Google Slides, it's perfect for any platform.


5 slides
Employee Performance Reviews Presentation
Celebrate growth, track progress, and visualize achievements with a clean and modern review layout that makes performance evaluation engaging and transparent. Designed to showcase employee milestones, skill development, and measurable outcomes, this template enhances clarity and communication. Fully customizable in PowerPoint, Keynote, and Google Slides for professional HR presentations.


6 slides
Concentric Circles Study Infographic
Concentric circles are a set of circles with the same center point but different radii (plural of radius). This Infographic provides visual insights into the concept of concentric circles, their properties, and applications. These circles are arranged in such a way that one circle is surrounded by another, forming a pattern that resembles a target or a bullseye. This illustrates various concepts, making the infographic a versatile and engaging geometric pattern. Fully customizable and compatible with Powerpoint, Keynote, and Google Slides. Design an organized layout that guides the viewer's eye through the infographic.


7 slides
Demographic Traits Infographic
Dive deep into the world of demographics with our demographic traits infographic. Painted in hues of white, yellow, and blue, this infographic expertly visualizes population data within a map layout, ensuring a cohesive understanding of varied traits across regions. Tailored for market researchers, sociologists, business analysts, and educators, this tool is designed to make complex demographic data comprehensible and engaging. Whether you're using PowerPoint, Keynote, or Google Slides, our infographic will seamlessly fit, elevating the quality and clarity of your presentation.


6 slides
Break Even Analysis Rate Infographics
Analyze your business's break-even point effectively with our Break-Even Analysis Rate infographic template. This template is fully compatible with popular presentation software like PowerPoint, Keynote, and Google Slides, allowing you to easily customize it to illustrate and communicate critical break-even analysis concepts. The Break-Even Analysis Rate infographic template offers a visually engaging platform to calculate and display the point at which your business covers all its costs and begins to generate a profit. Whether you're an entrepreneur, financial analyst, or business owner, this template provides a user-friendly canvas to create informative presentations and reports on your break-even analysis. Optimize your financial decision-making with this SEO-optimized Break-Even Analysis Rate infographic template, thoughtfully designed for clarity and ease of use. Customize it to showcase your break-even calculations, assumptions, and scenarios, helping you make informed decisions about pricing, costs, and profitability. Start crafting your personalized infographic today to enhance your break-even analysis skills and strategies.


5 slides
Cryptocurrency Investment Overview Presentation
Capture the excitement of digital investing with this clean, modern layout designed to visualize market performance, asset insights, and portfolio trends. Perfect for financial analysts, startups, and educators, it simplifies complex data into engaging visuals. Fully compatible with PowerPoint, Keynote, and Google Slides for seamless editing and presentation delivery.