


Features
- 6 Unique slides
- Fully editable and easy to edit in Microsoft Powerpoint, Keynote and Google Slides
- 16:9 widescreen layout
- Clean and professional designs
- Export to JPG, PDF or send by email


Do you have any questions?
Recommend


7 slides
Value Chain Business Infographic
The value chain is a concept used in business management to describe the full range of activities that businesses go through to bring a product or service from conception to delivery to customers. This infographic template is designed to showcase the various activities and processes that add value to your product or service, enlightening your audience about the holistic journey from start to finish. Compatible with Powerpoint, Keynote, and Google Slides. Present a visual representation of a value chain analysis, emphasizing the importance of evaluating each activity's contribution to the overall value.


5 slides
Best Travel Planning Template
Bring wanderlust to life with a slide that turns trip planning into a clear, engaging journey. This presentation breaks down key travel steps—documents, packing, routes, and timing—using simple visuals that keep details organized and easy to follow. Fully customizable and compatible with PowerPoint, Keynote, and Google Slides.


5 slides
Cryptocurrency Scams Infographics
Navigate the intricate world of digital currency with our cryptocurrency scams infographics template. This essential tool, designed with an informative and vertical style, serves as a beacon for investors, financial advisors, and digital currency enthusiasts, providing safeguarding strategies against the rising tide of cryptocurrency scams. Set against a bold palette of purple, yellow, and green, the template employs crisp graphics, decipherable icons, and strategic image placeholders to break down complex scam methodologies and preventive measures. Compatible with Powerpoint, Keynote, and Google Slides. Promote informed decision-making in the volatile cryptocurrency market.


5 slides
Pet Health Clinic Workflow Presentation
Guide your audience through each stage of care with the Pet Health Clinic Workflow presentation. This engaging slide features a horizontal visual of a dog segmented into four workflow stages, making it ideal for explaining clinical procedures, pet treatment plans, or wellness programs. Each section includes editable text areas for customizable labels and descriptions. Perfect for veterinary clinics, pet hospitals, and animal health professionals. Fully compatible with PowerPoint, Keynote, and Google Slides.


5 slides
Regional Economic Growth in Asia Map Presentation
Explore economic landscapes with the "Regional Economic Growth in Asia Map" template, an essential tool for visualizing economic data across Asia. Designed for business strategists and policymakers, it offers detailed insights and regional analysis to support informed decision-making. Compatible with PowerPoint and Google Slides, this template is flexible for both academic and professional uses.


5 slides
Team Roles and Responsibilities Matrix Presentation
Define accountability with this Team Roles and Responsibilities Matrix. Clearly map tasks to team members using RACI codes (Responsible, Accountable, Consulted, Informed). Ideal for project planning, cross-functional alignment, and team coordination. Fully editable and compatible with PowerPoint, Keynote, and Google Slides to suit any workflow or team structure.


6 slides
Company Profile Growth Infographic
The collection of templates presented offers a valuable resource for businesses aiming to articulate their growth and current market standing comprehensively. These templates are designed to deliver essential information through a well-structured and visually appealing format, ideal for engaging stakeholders effectively. Each design is tailored to showcase various aspects of company progress, including detailed financial growth, strategic direction, and key achievements. Features such as timelines, growth charts, and key performance indicators are seamlessly integrated, providing a clear snapshot of the company's journey and ambitions. The templates are adaptable to various corporate needs, making them suitable for annual reports, investor presentations, and internal reviews across different industries. The chosen color schemes and layouts ensure that information is presented clearly and attractively, enhancing readability and projecting a professional corporate image. By facilitating customization to reflect the unique characteristics of any business, these templates serve as indispensable tools for companies eager to communicate their success stories and future prospects in a compelling manner.


6 slides
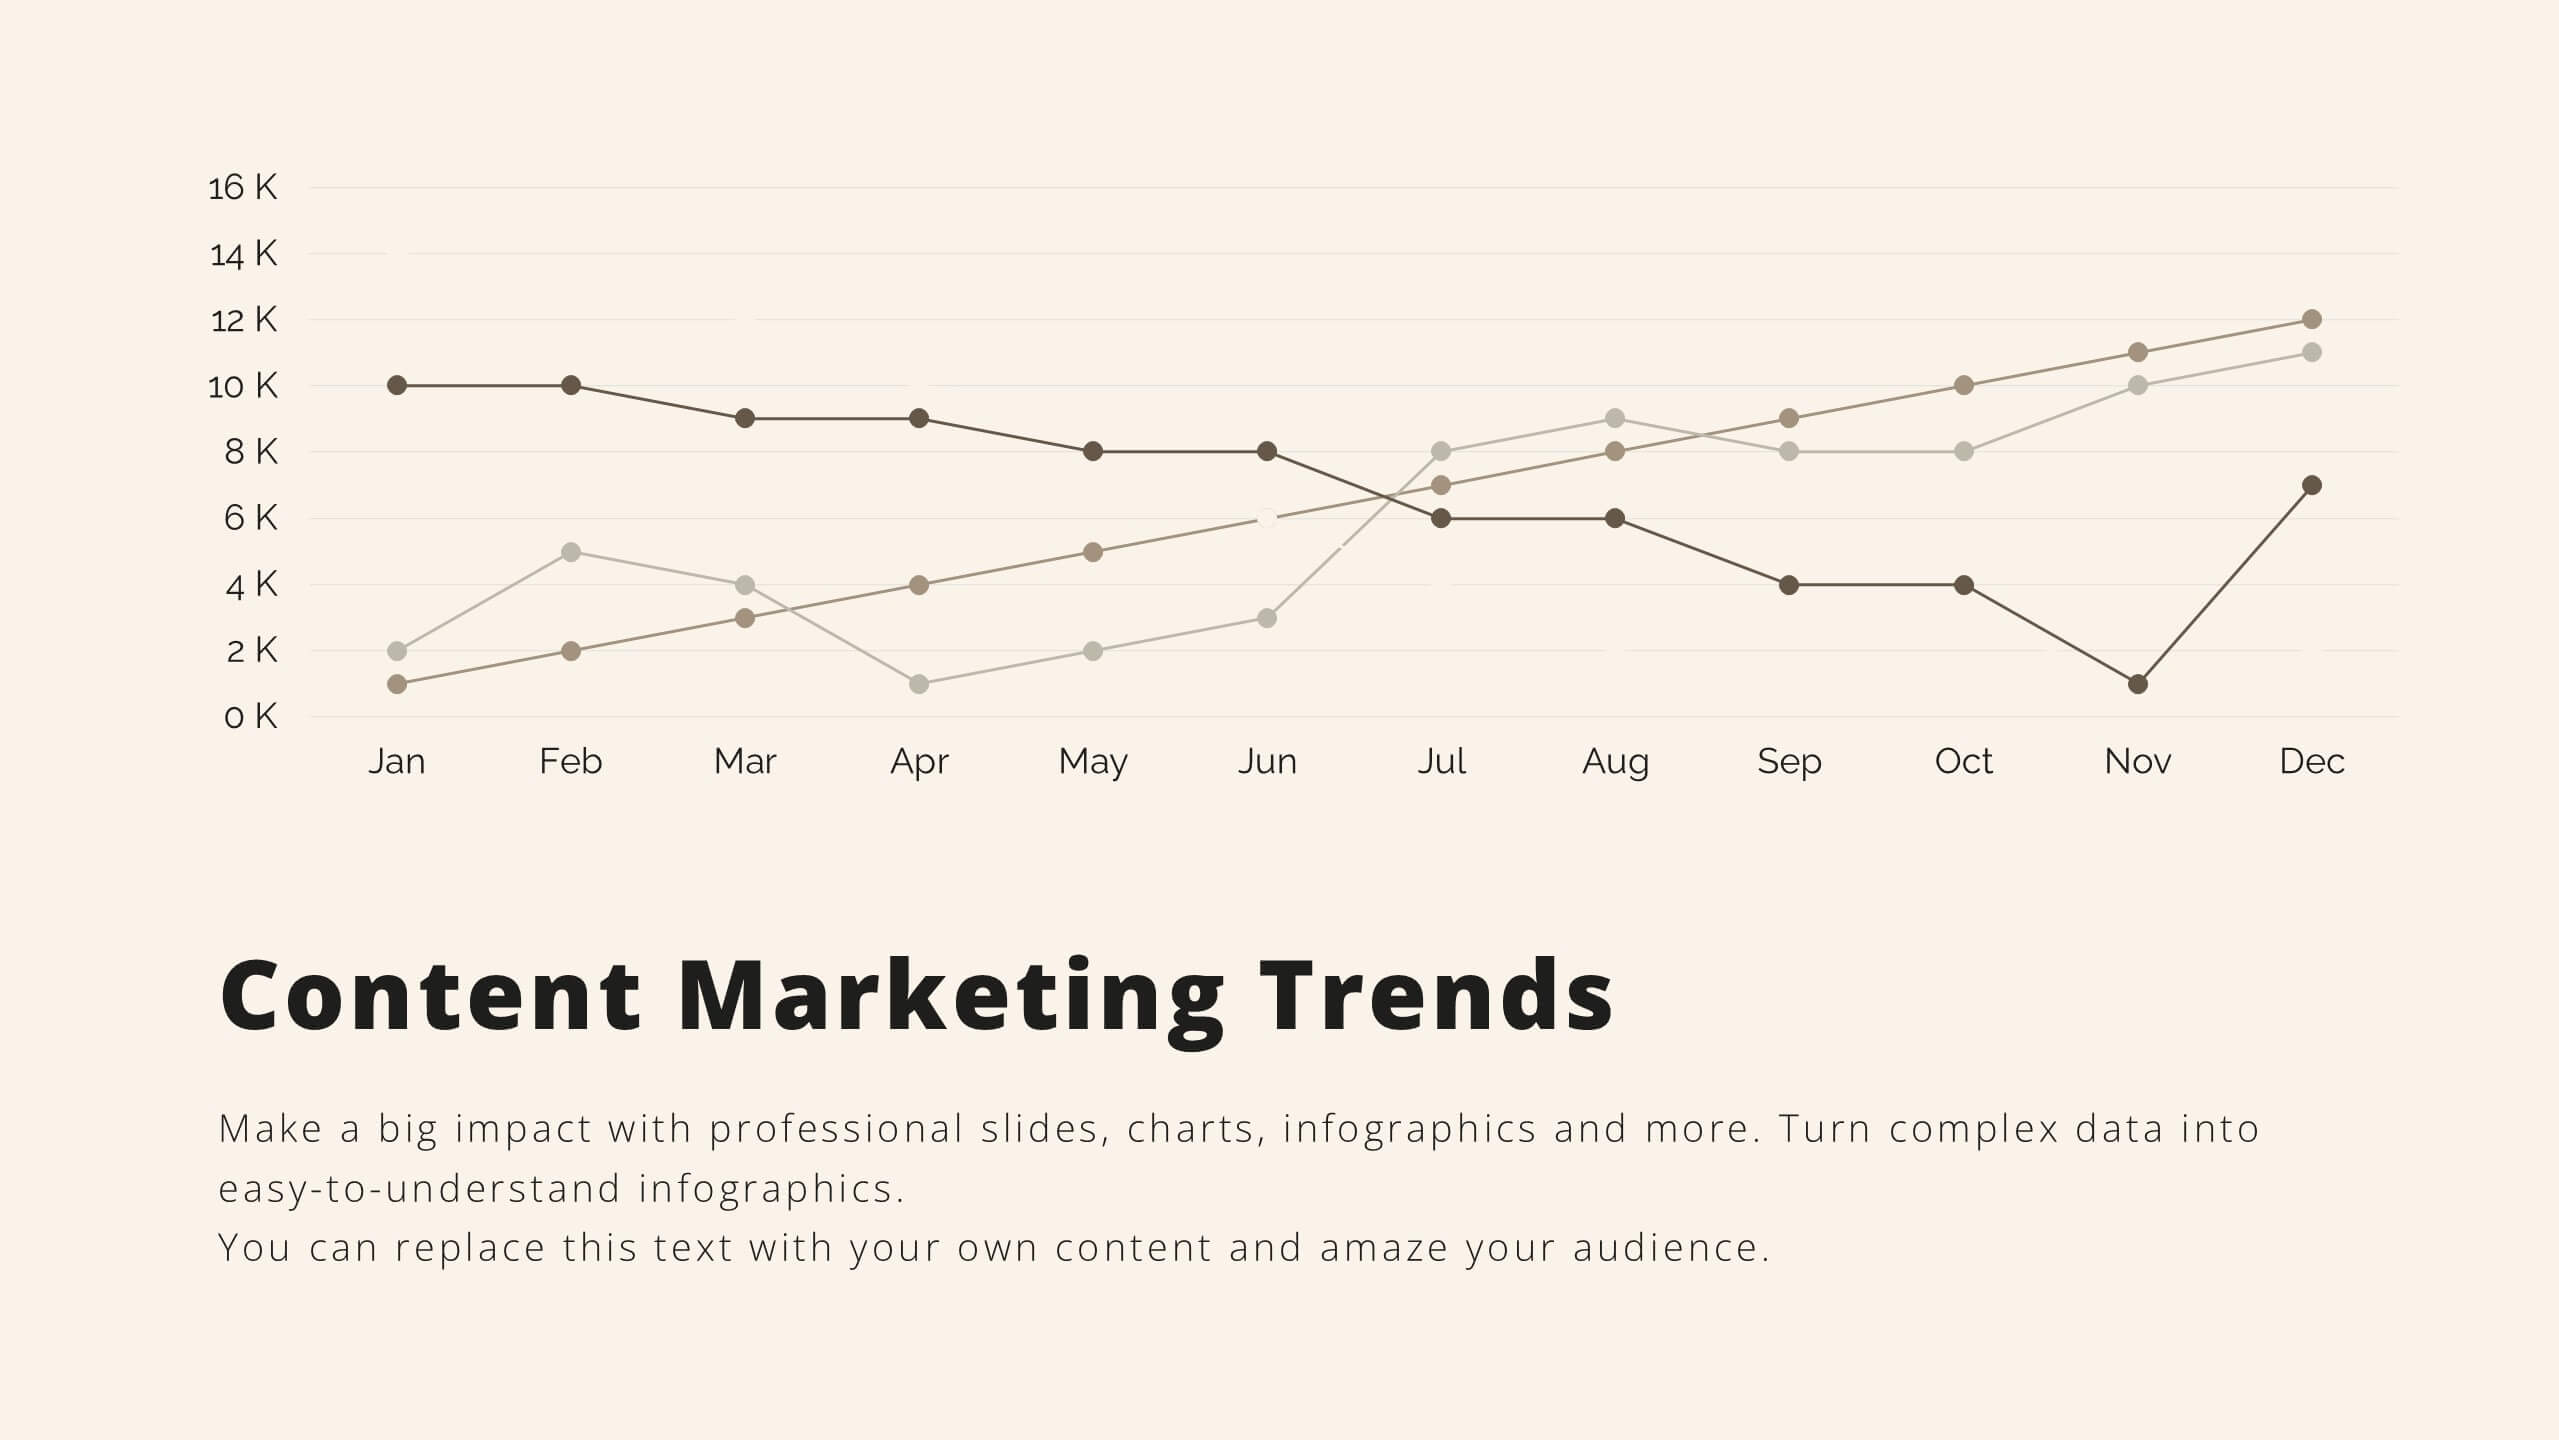
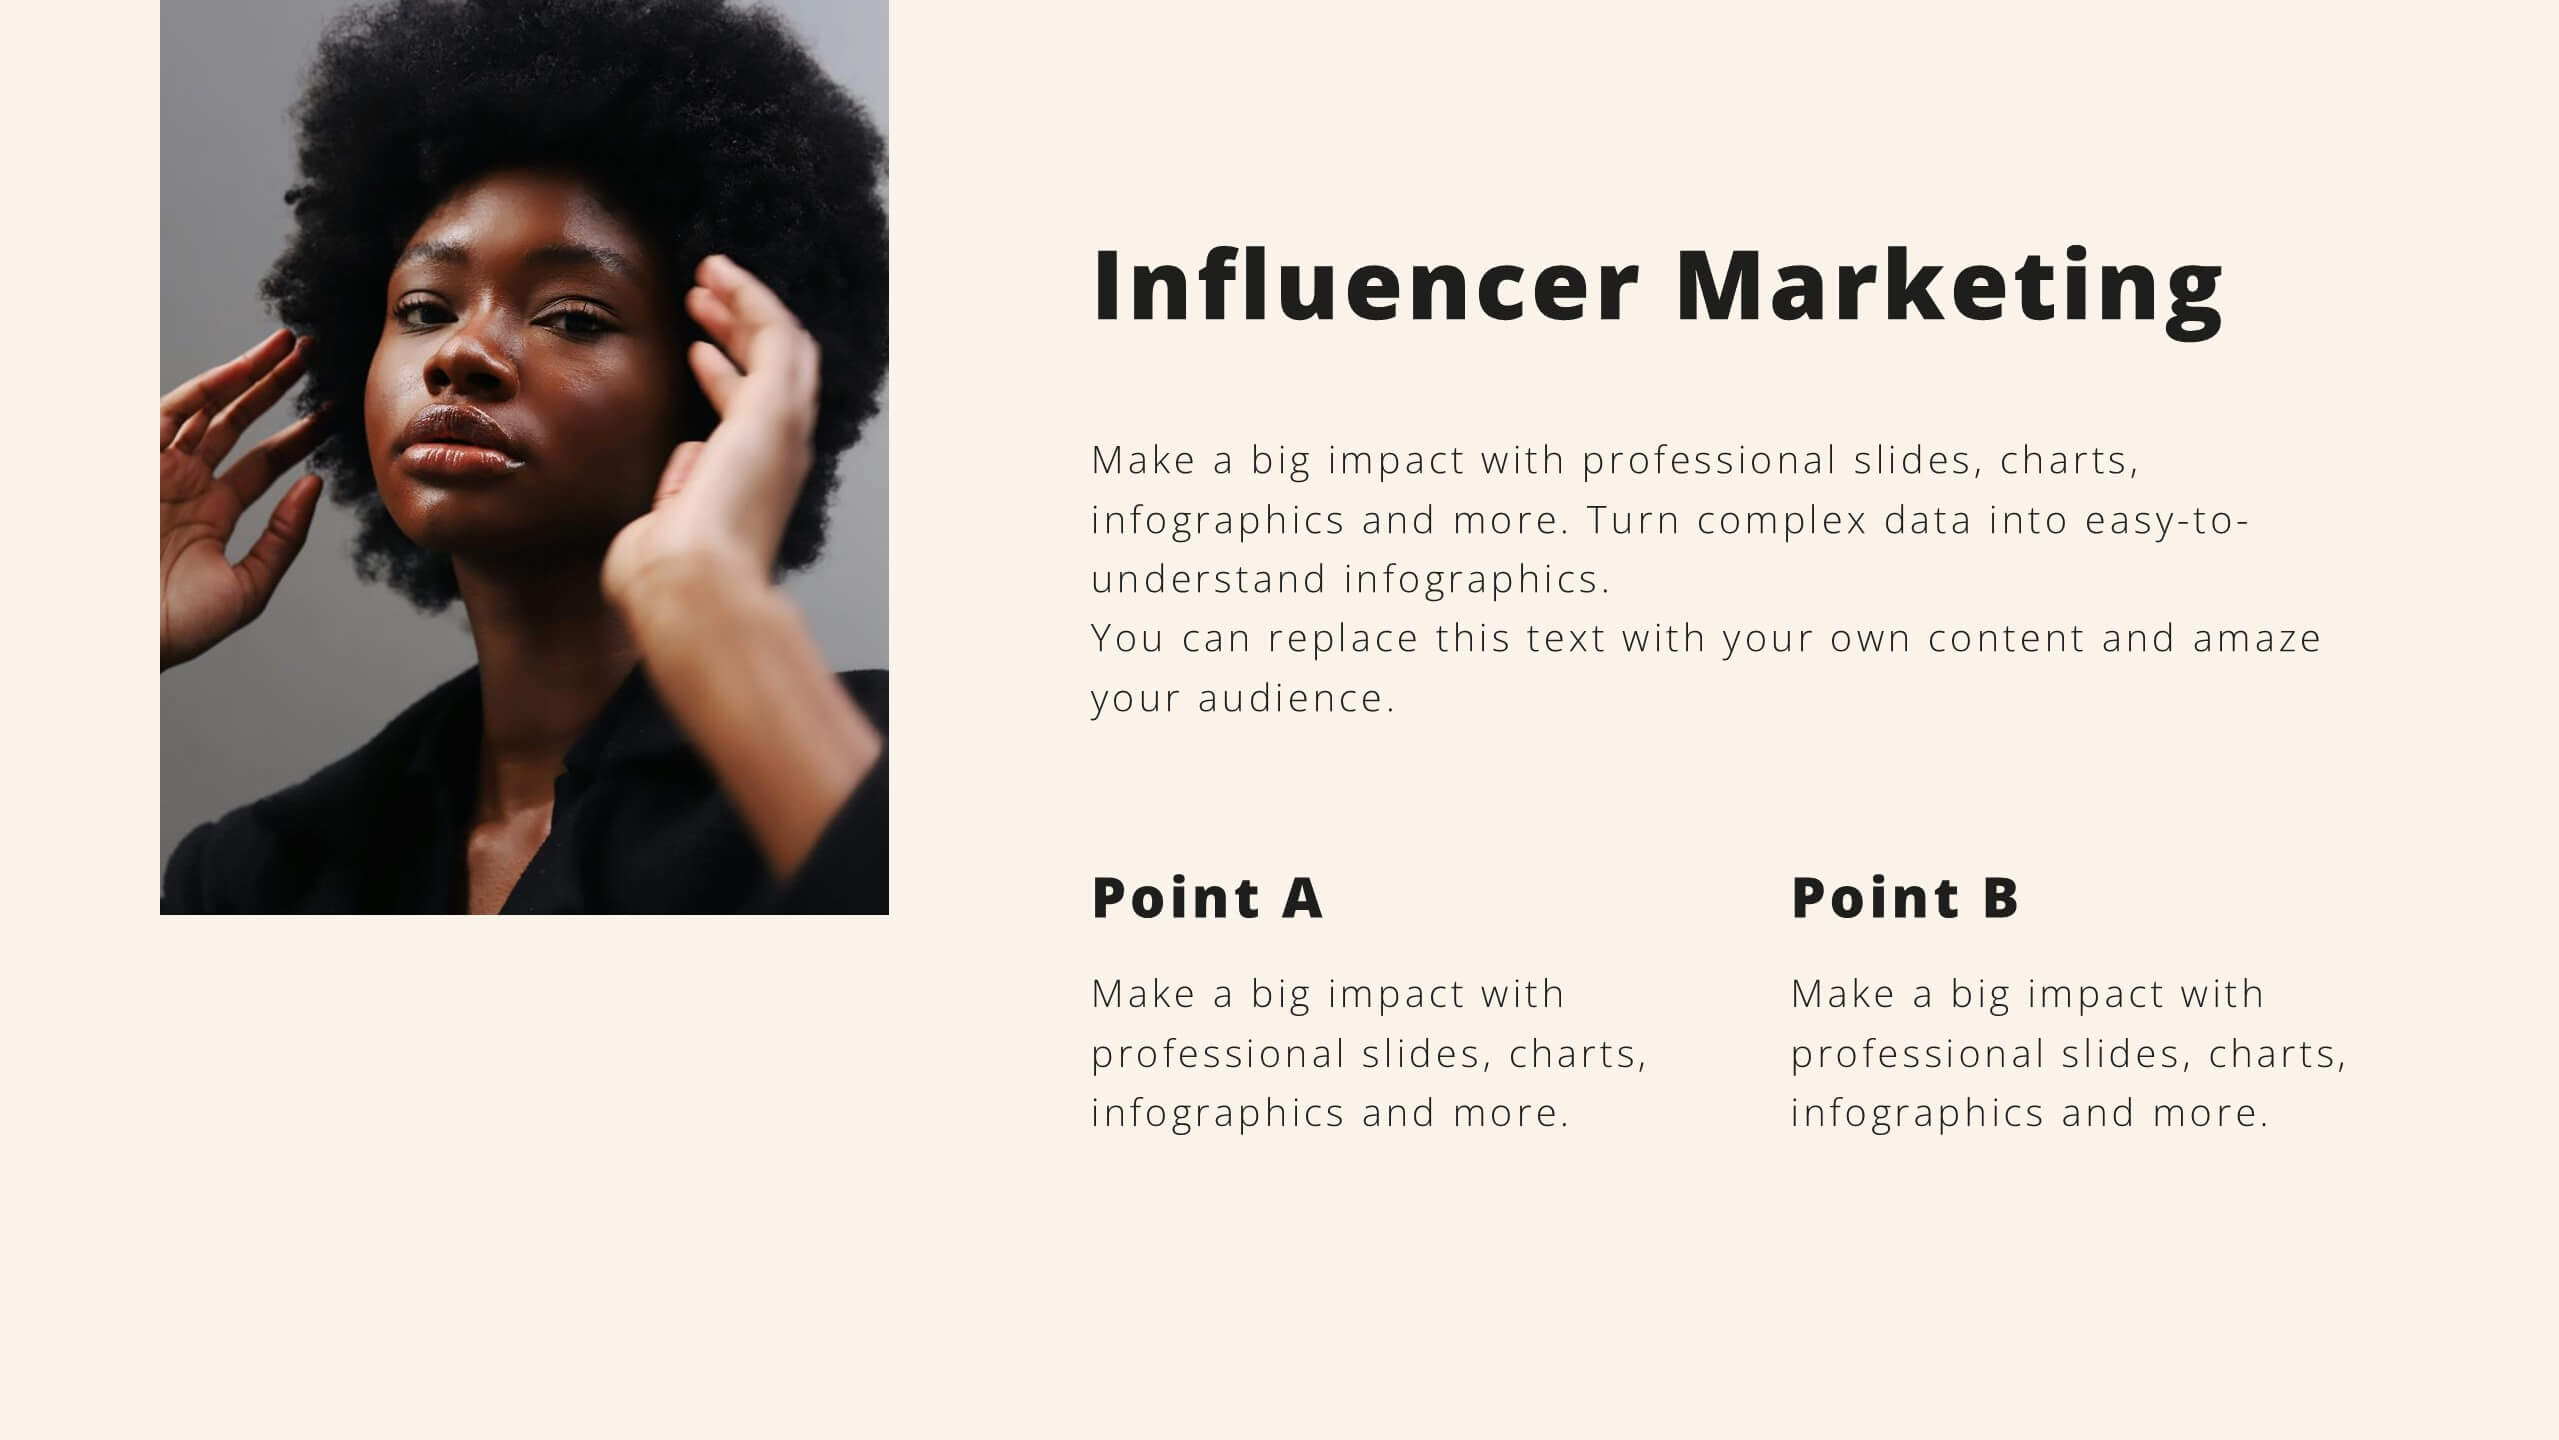
Sales Summary Infographic
Enhance your business presentations with our Infographic Templates! Designed specifically for professionals aiming to deliver impactful data insights, this collection provides an array of slides tailored to articulate complex information effortlessly. Crafted to showcase performance metrics, analyze market trends, and outline strategic directions, these templates turn data into narratives. Featuring unique designs ranging from sophisticated circular diagrams to innovative hexagonal lists and visually engaging photo integrations, each slide ensures your data is both comprehensive and compelling. You can customize colors and text to seamlessly align these designs with your corporate identity, enhancing brand consistency across all communications. Ideal for use in PowerPoint, Google Slides, and Keynote, these templates serve as essential tools for marketers, team leaders, and analysts. They facilitate clearer understanding, promote informed decision-making, and boost presentation impact, making them invaluable in any professional setting.


5 slides
Geographic Oceania Overview Presentation
Visualize your regional data with a sleek, easy-to-read map highlighting key areas across Oceania. Perfect for presenting geographic insights, business distribution, or market trends, this clean layout ensures every detail stands out clearly. Fully compatible with PowerPoint, Keynote, and Google Slides for simple editing and professional presentations.


7 slides
Supply Chain Solutions Infographic
Supply chain refers to the entire process of producing and delivering a product or service, from the procurement of raw materials to the distribution of the final product to customers. This infographic template elucidates the complexities of supply chain management, guiding you through strategies and innovations that pave the way for an optimized, efficient, and resilient supply chain network. Fully customizable and compatible with Powerpoint, Keynote, and Google Slides. Utilize a bold and commanding color palette, reflecting the strength and authority essential in managing a successful supply chain.


2 slides
App Design Mockup Presentation
Present your mobile app in style with the App Design Mockup slide. This sleek and modern template features a large smartphone frame to showcase your UI/UX designs with a creative touch. Ideal for app developers, designers, and pitch decks. Fully customizable and compatible with PowerPoint, Keynote, and Google Slides.


5 slides
Stakeholder Mapping and Engagement Plan Presentation
Visualize stakeholder priorities with clarity using the Stakeholder Mapping and Engagement Plan Presentation. This slide features a 2x2 quadrant grid ideal for categorizing stakeholders by power and interest, helping you define appropriate engagement strategies. Great for project managers, corporate strategists, and communication teams. Fully editable in PowerPoint, Keynote, and Google Slides.


7 slides
Consecutive Numbers Infographic
Dive into the world of mathematics with our Consecutive Numbers Infographic! Employing an array of serene blues and greens, this visually appealing tool breaks down the concept of consecutive numbers in a fun and comprehensible manner. It's an educator's dream, designed to captivate and engage, making the topic accessible for students of various age groups. Beyond the classroom, it's a handy reference for professionals and enthusiasts alike. With compatibility spanning PowerPoint, Keynote, and Google Slides, this infographic is poised to elevate any presentation, workshop, or lecture it graces.


20 slides
Amethyst Marketing Proposal Template Presentation
Bring your marketing ideas to life with this eye-catching amethyst-themed presentation! Tailored for presenting your marketing proposals, this template helps you outline key strategies, campaigns, and target audiences in a sleek, professional design. Its bold layout ensures your message shines through. Compatible with PowerPoint, Keynote, and Google Slides.


7 slides
TAM SAM SOM Analysis Infographic Presentation
A TAM SAM SOM Infographic is a visual representation of a business concept that is used to describe a company's potential market size and growth opportunities. TAM stands for Total Addressable Market, SAM stands for Serviceable Addressable Market, and SOM stands for Serviceable Obtainable Market. This template includes a series of concentric circles, rectangles, and other shapes with the TAM being the largest circle, followed by the SAM and SOM. This infographic also includes text, icons, and other graphic elements to help illustrate key points and communicate your growth strategy.


10 slides
Territorial Insights with South America Map Presentation
Unlock regional clarity with the Territorial Insights with South America Map Presentation. This editable slide visualizes country-specific highlights using a modern grid-based map layout, customizable color zones, and label connectors to break down key insights. Ideal for sales analysis, market entry strategies, or logistics reporting. Compatible with PowerPoint, Keynote, Google Slides, and Canva.


12 slides
5 Steps Timeline Template
Visualize your project's progress with our vibrant "5 Steps Timeline Template." This infographic template guides you through the years 2030 to 2070, with colorful, distinct markers for each milestone. Ideal for long-term planning, each slide offers a clear path forward, ensuring your goals are both visual and attainable. Compatible with PowerPoint, Keynote, and Google Slides, this template is perfect for professionals eager to showcase their strategic vision in a memorable way.