


Features
- 4 Unique slides
- Fully editable and easy to edit in Microsoft Powerpoint, Keynote and Google Slides
- 16:9 widescreen layout
- Clean and professional designs
- Export to JPG, PDF or send by email


Do you have any questions?
Recommend


8 slides
Restaurant Menu Design Presentation
Showcase your menu items with style using this bold, modern restaurant menu infographic. Designed to highlight pricing, meal categories, and featured items, this layout is perfect for restaurant presentations, promotions, or digital signage. Includes editable text areas and food-themed icons. Works seamlessly in PowerPoint, Keynote, and Google Slides.


5 slides
Sustainable Growth and Green Policy Presentation
Showcase your eco-initiatives with the Sustainable Growth and Green Policy Presentation. This unique leaf-shaped diagram highlights four key environmental pillars—ideal for presenting climate strategies, energy policies, or green development goals. With a sleek and modern design, it’s perfect for NGOs, government briefings, or corporate sustainability reports. Editable in Canva, PowerPoint, Keynote, and Google Slides.


7 slides
Lean Startup Strategy Presentation
Present your investment strategy with clarity and impact using this triangle diagram slide. Ideal for showcasing the relationship between key funding stages, investor types, or business milestones, this layout offers a clean structure with labeled nodes (A, B, C) and supporting icons. Fully editable in PowerPoint, Keynote, and Google Slides for seamless customization.


20 slides
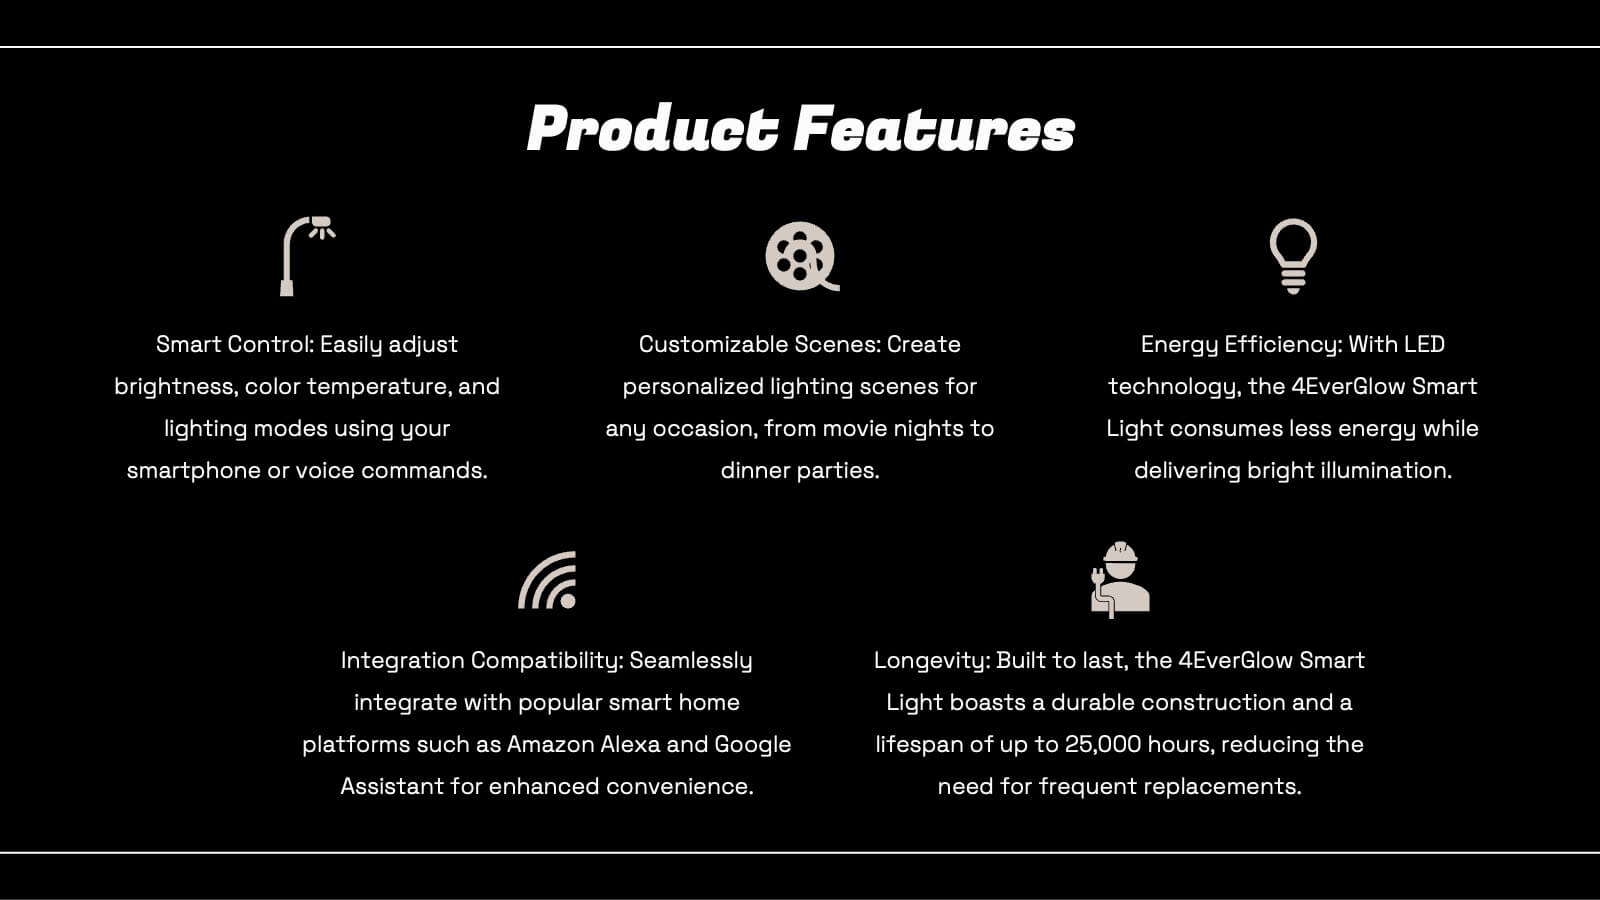
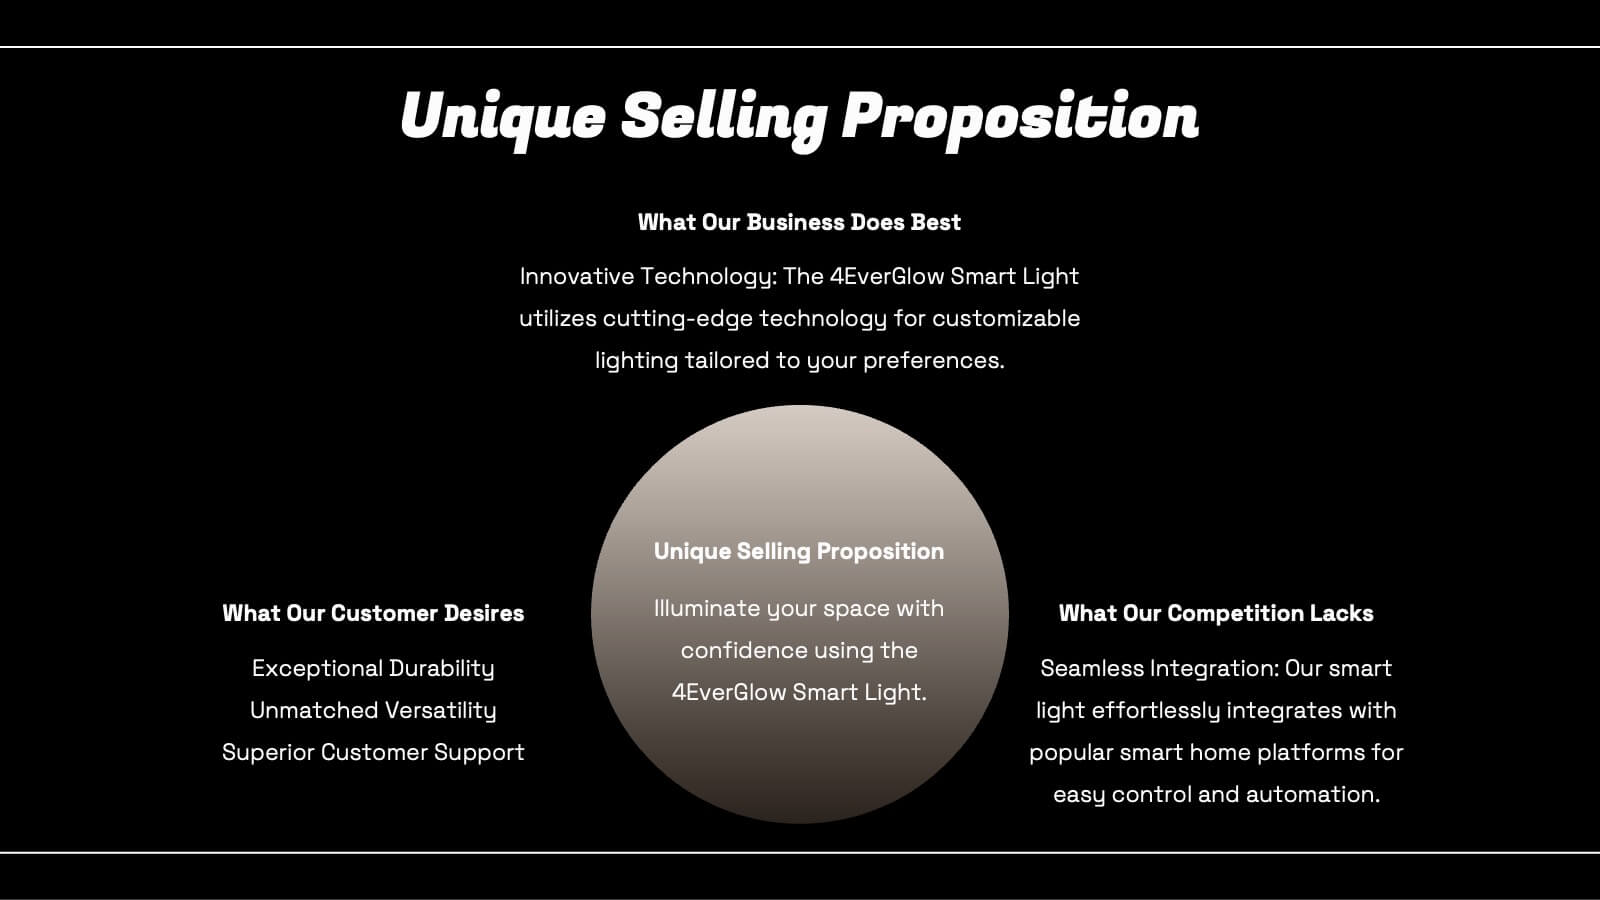
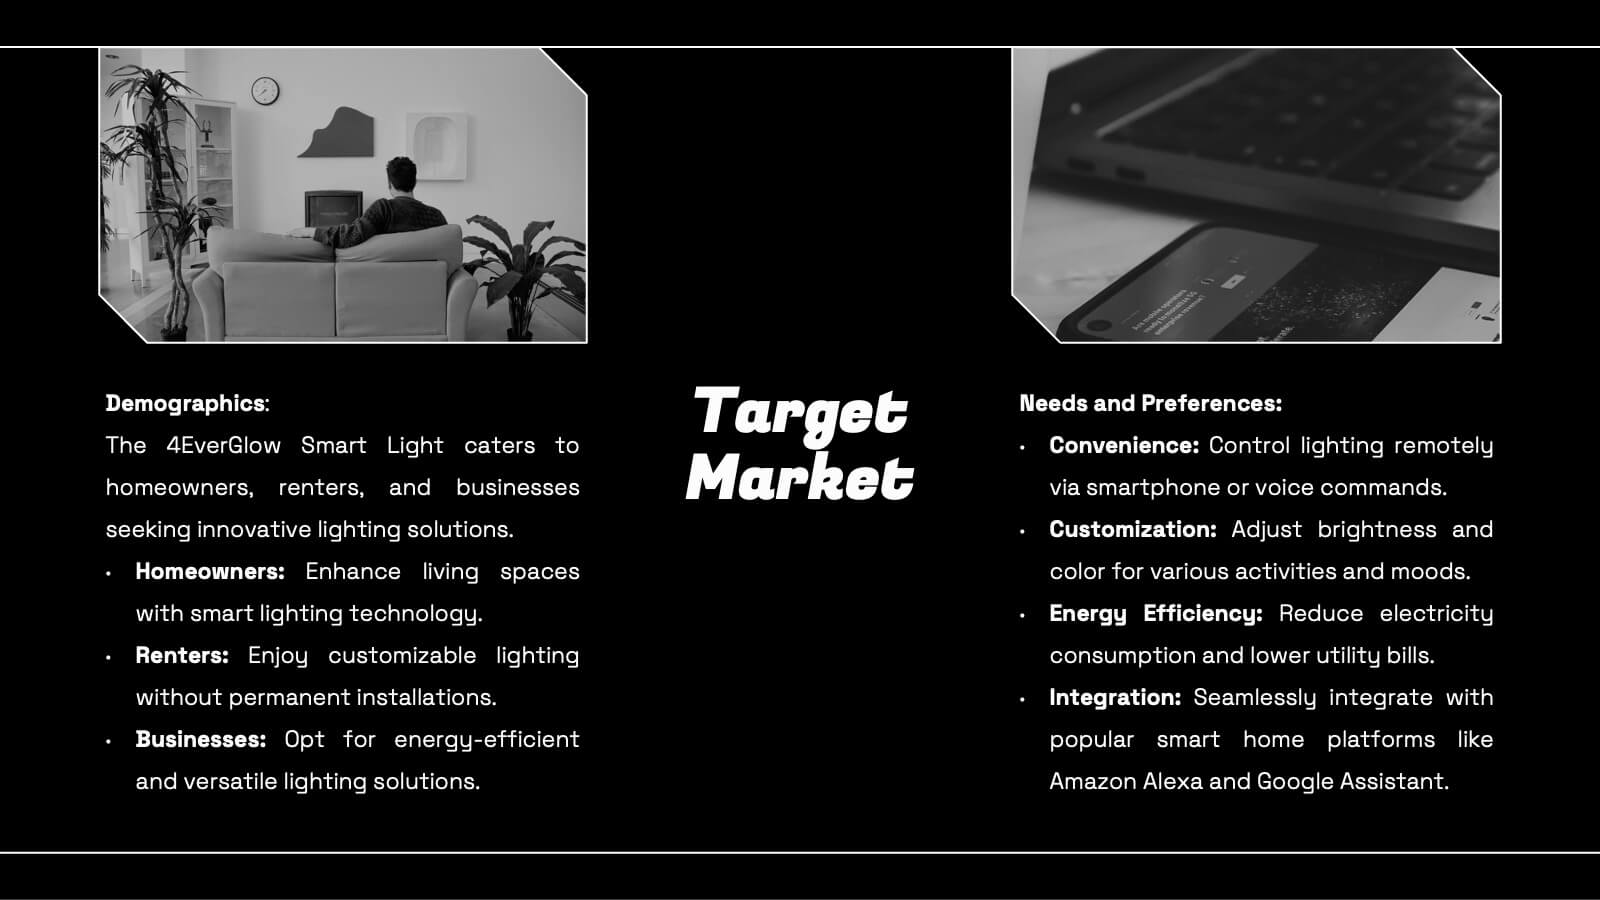
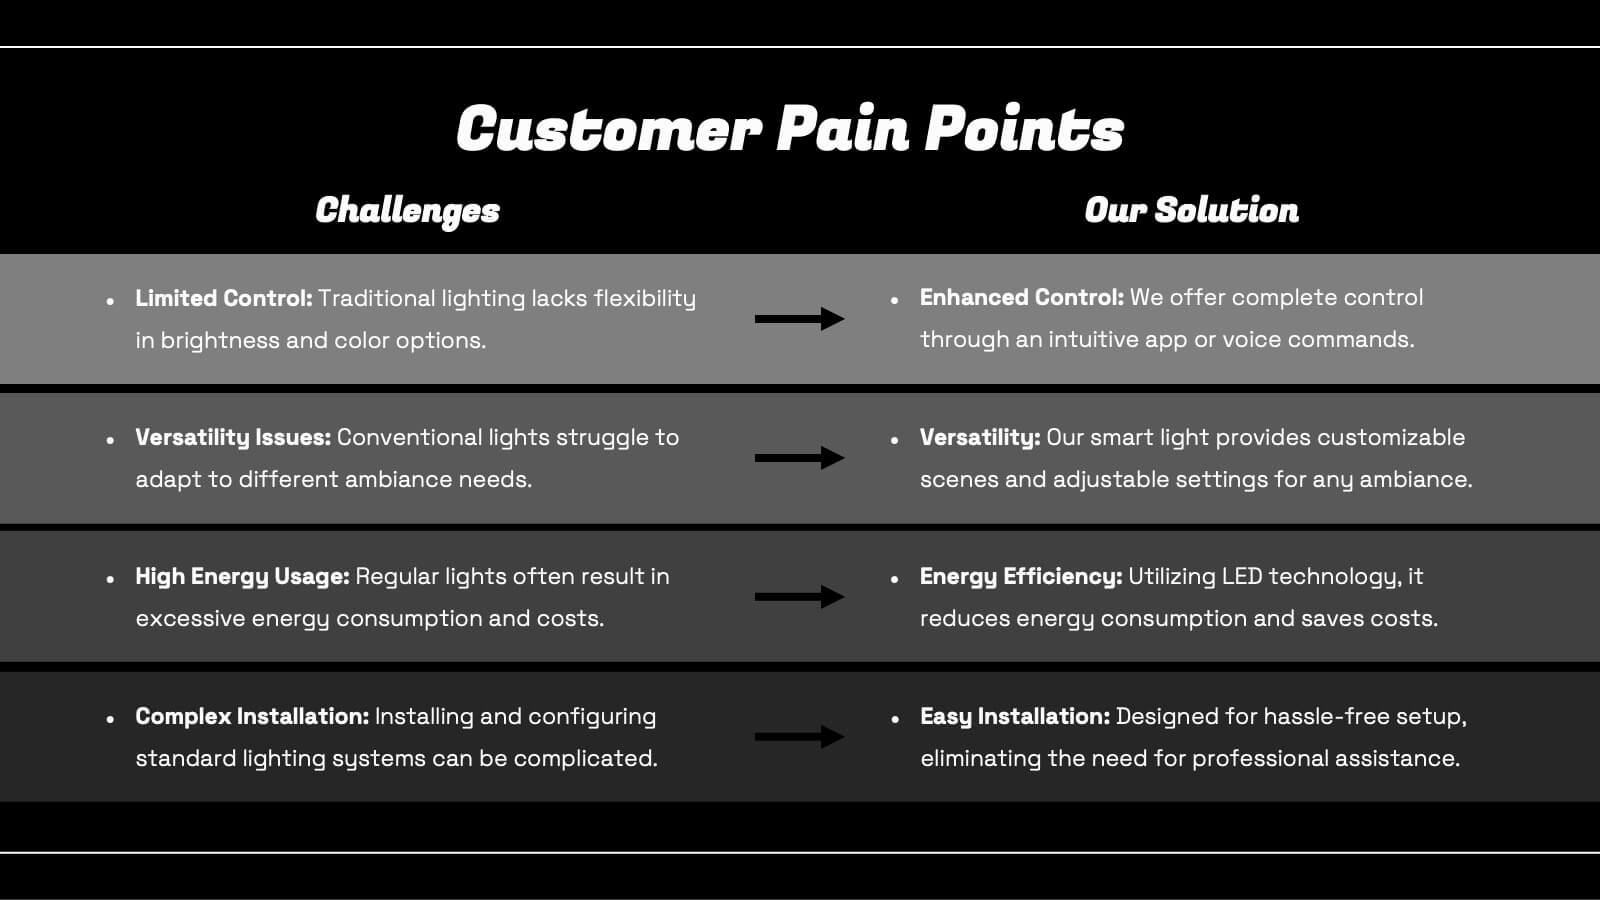
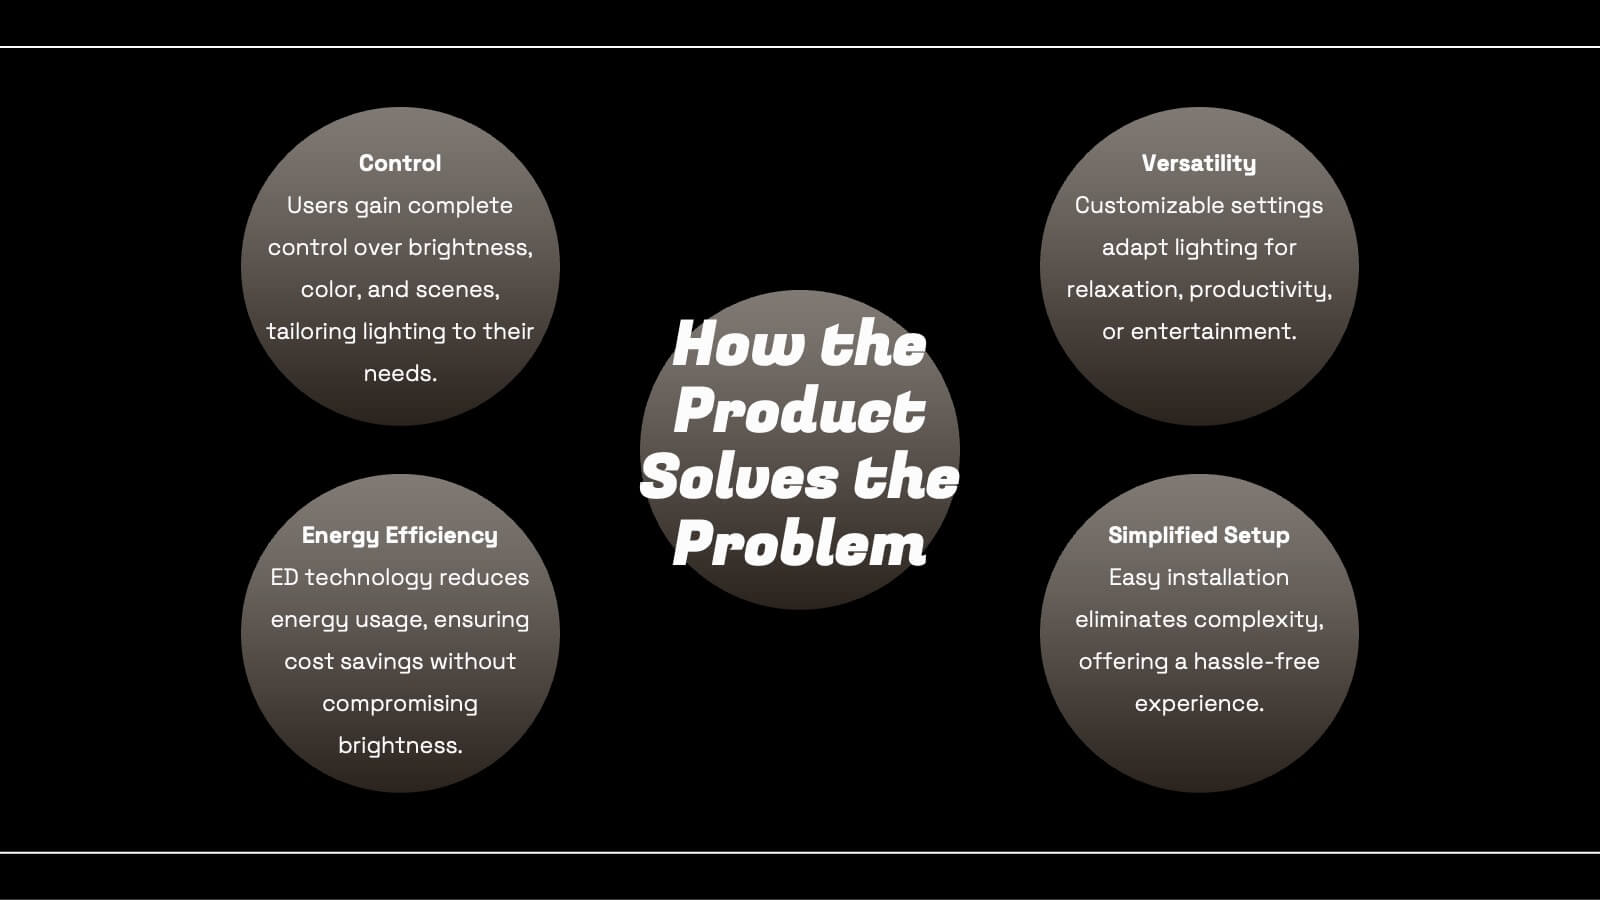
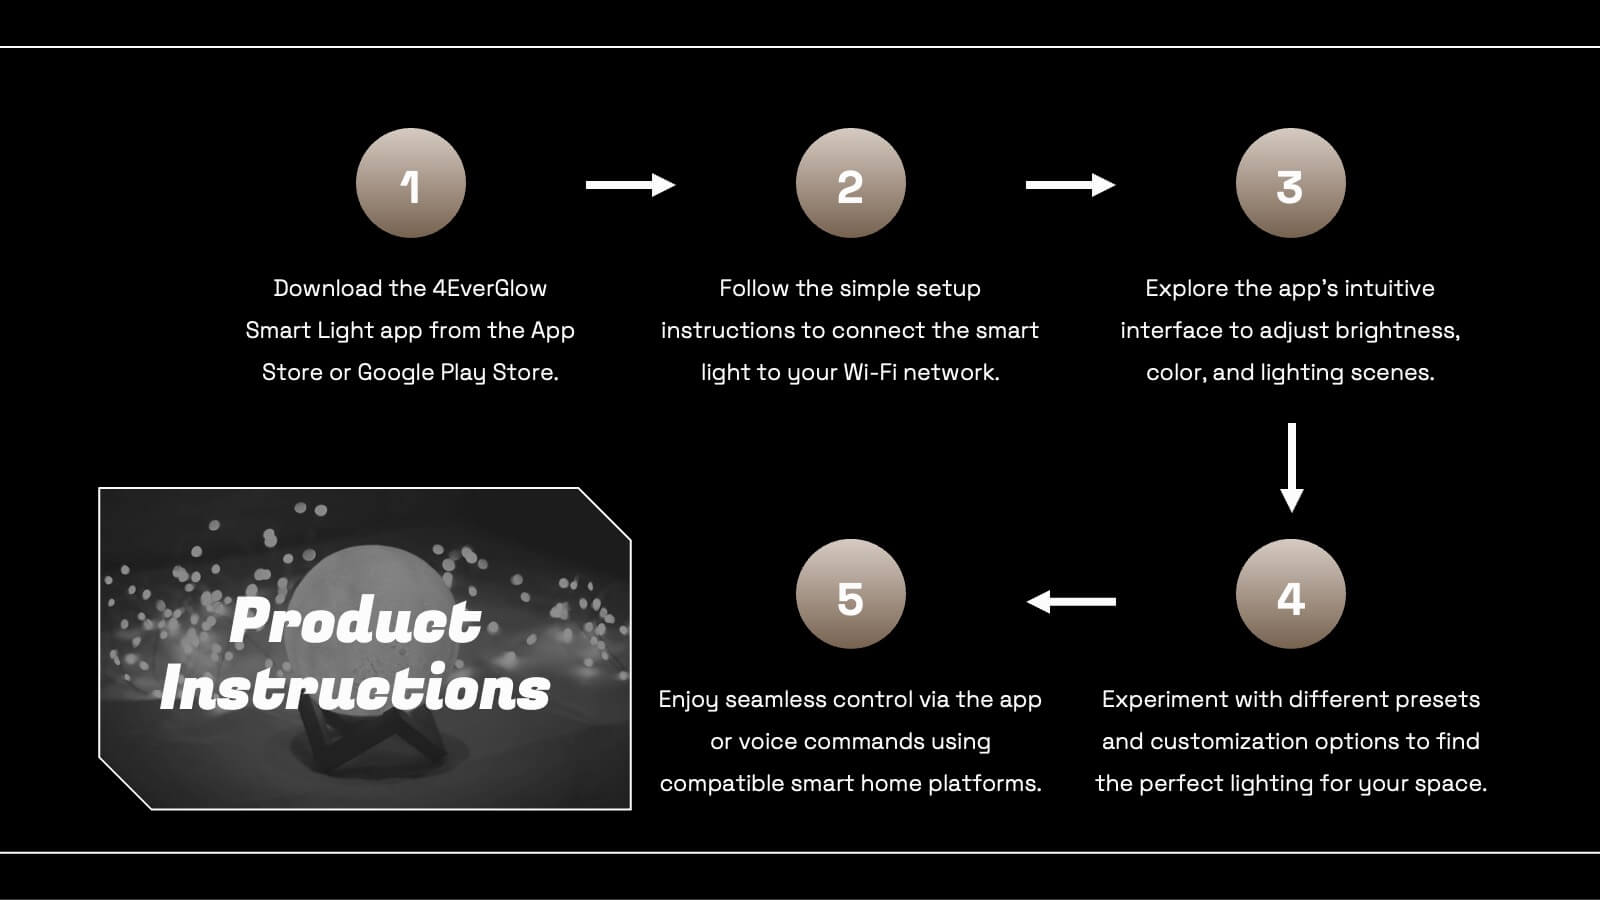
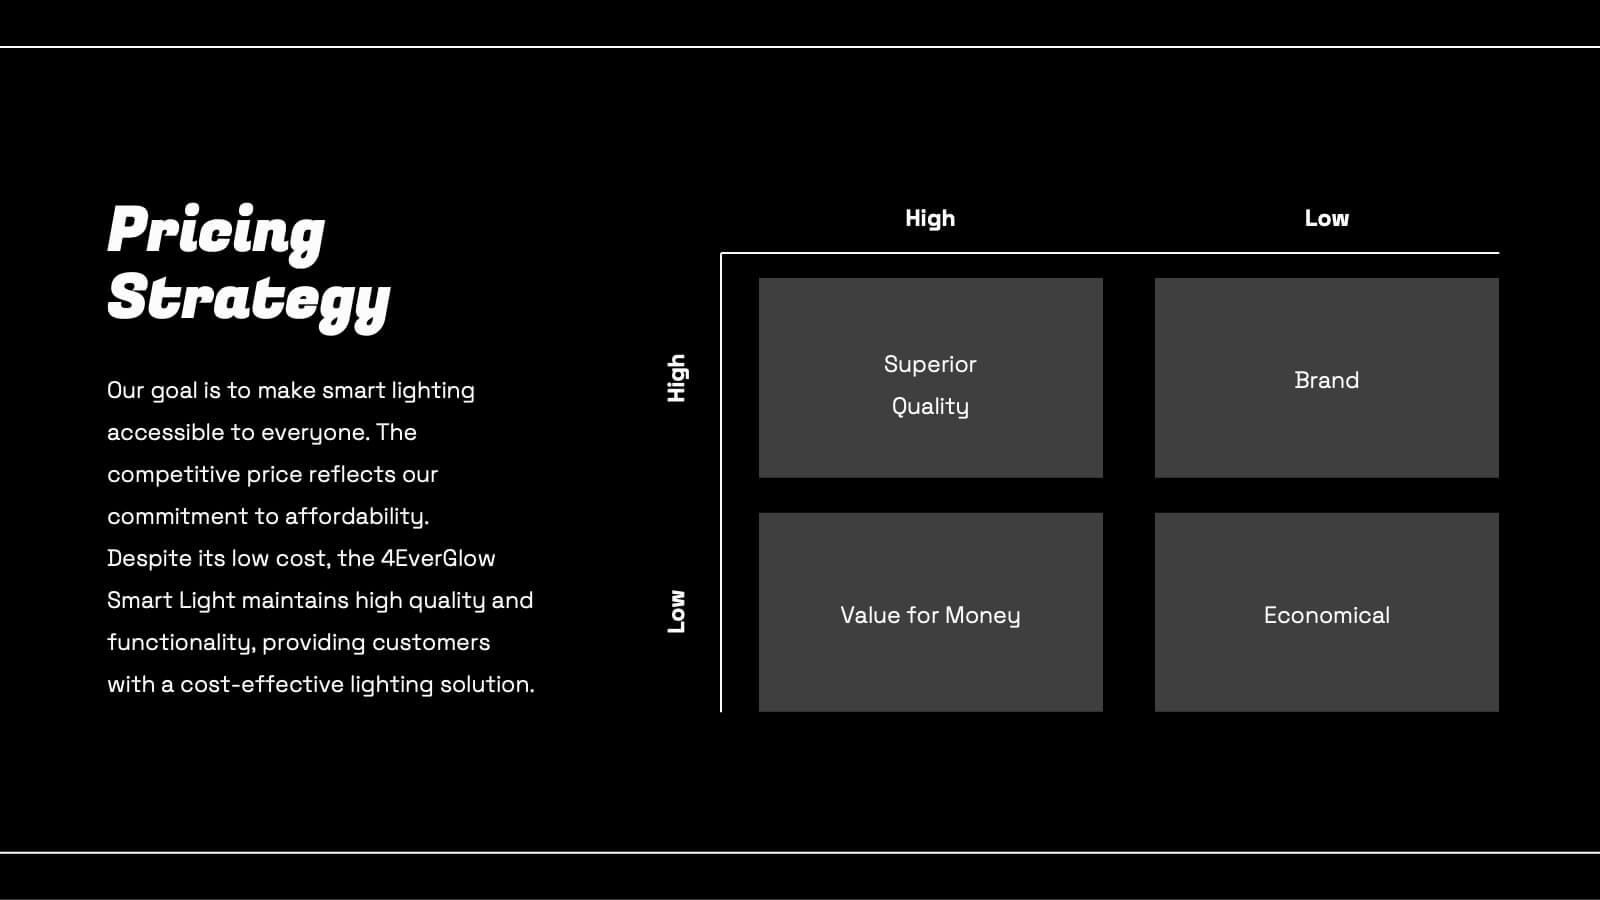
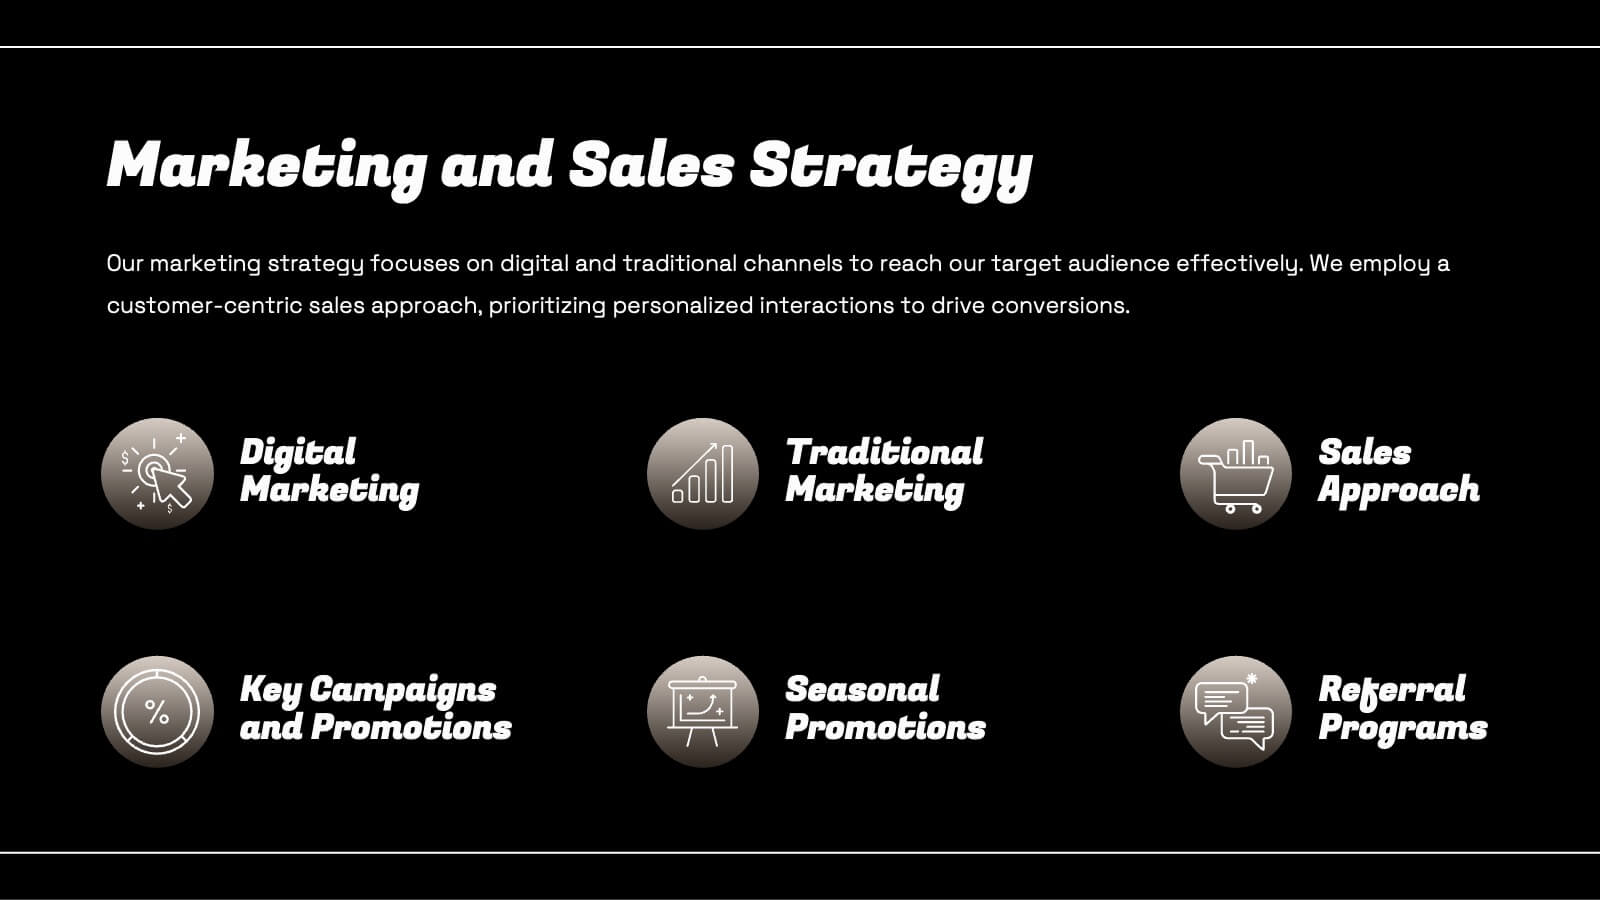
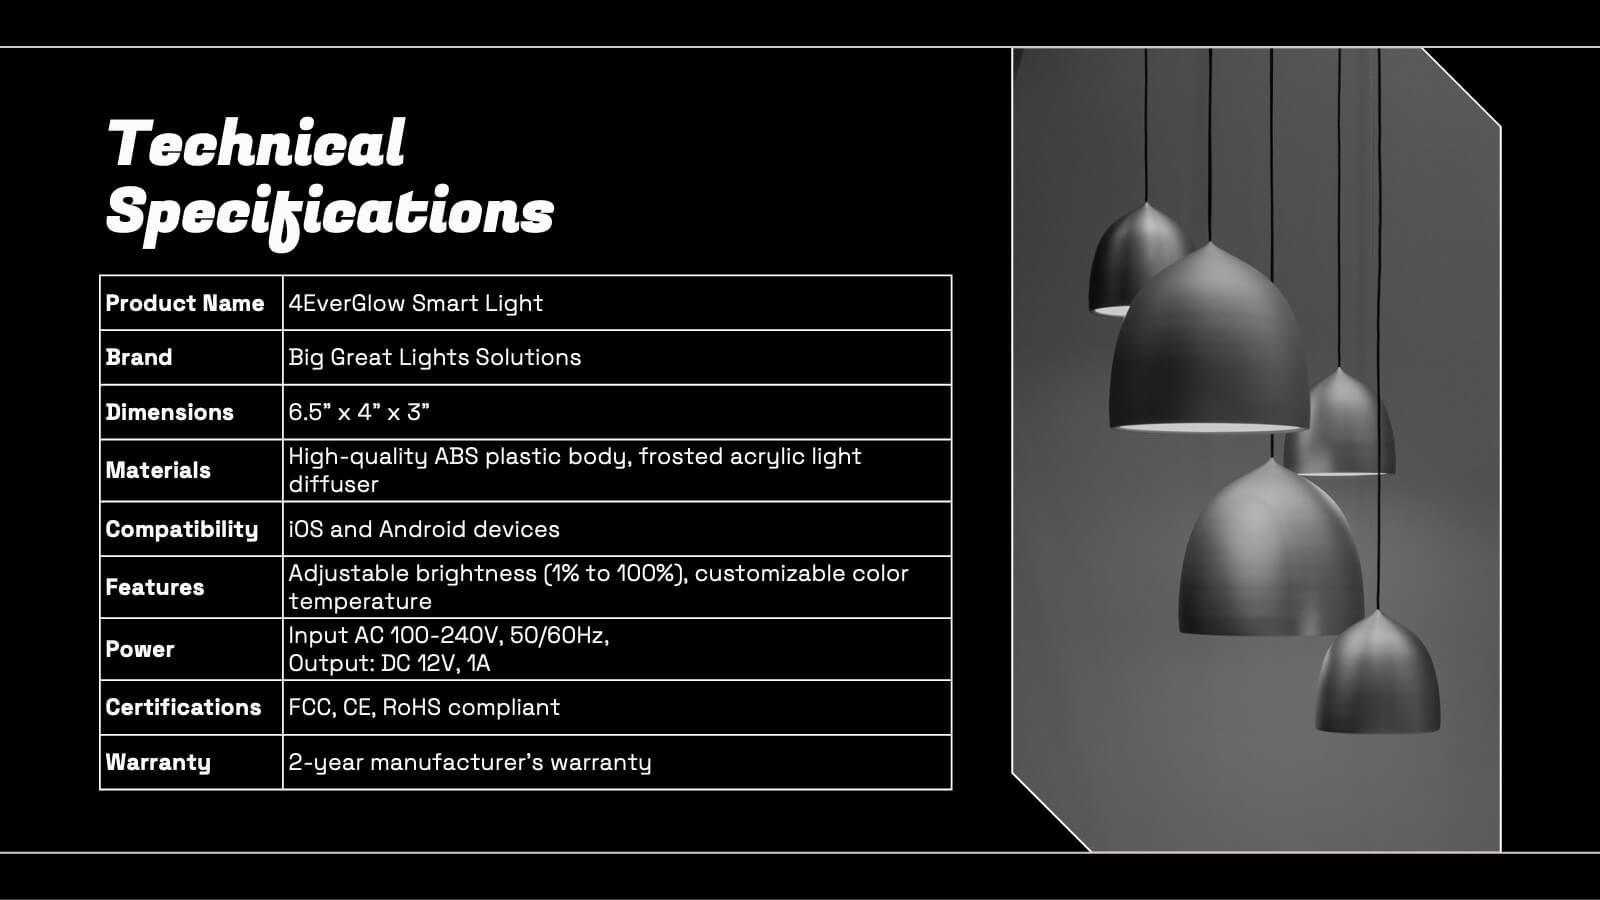
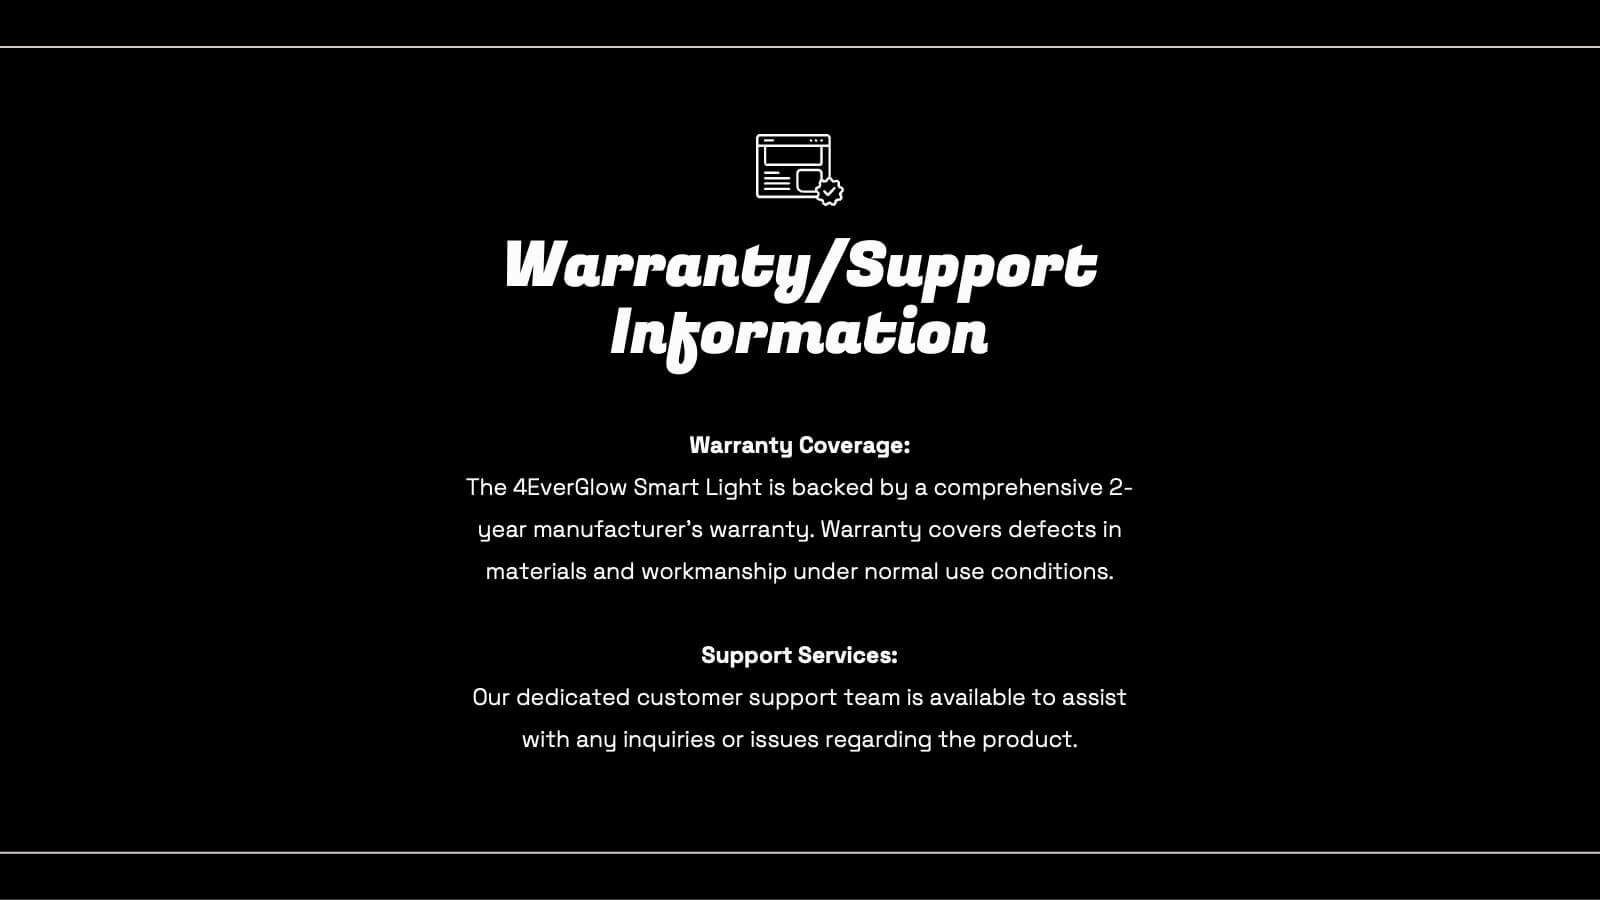
Smart Light Product Presentation
Enhance your product presentations with this Smart Lighting template. Designed for clarity and aesthetic appeal, it includes slides detailing product features, market analysis, technical specifications, and pricing strategies. Ideal for tech products, it's compatible with PowerPoint, Keynote, and Google Slides, ensuring broad accessibility and ease of use.


7 slides
KPI Software Dashboard Infographic
Maximize the effectiveness of your performance analysis with our KPI Software Dashboard infographic, optimized for use in Powerpoint, Keynote, and Google Slides. This dynamic infographic is an indispensable tool for business analysts, project managers, and data-driven professionals seeking to present key performance indicators (KPIs) in an insightful and engaging manner. Our KPI Software Dashboard infographic offers a clear, visual representation of critical data points that influence business decisions. With its diverse array of charts, graphs, and meters, it provides an at-a-glance overview of company performance across various metrics. The design is tailored to enhance readability and comprehension, allowing your audience to quickly grasp complex data trends and patterns. Whether you're reviewing sales figures, monitoring customer satisfaction, or tracking project progress, this infographic is designed to streamline the presentation of your data. The compatibility with popular presentation platforms ensures a smooth integration into your slide deck, making it a breeze to communicate the insights that matter. Utilize this infographic to turn your KPI data into compelling narratives that drive strategic business actions.


26 slides
Quantum Computing Presentation
Step into the future of technology with this fascinating presentation on quantum computing. Covering key concepts like quantum bits, superposition, entanglement, and real-world applications, this template helps simplify complex ideas for any audience. Fully customizable and compatible with PowerPoint, Keynote, and Google Slides for a seamless and insightful presentation experience.


5 slides
Project Milestone Timeline Presentation
Bring your project’s journey to life with this vibrant and organized presentation layout. Designed to showcase milestones, releases, and key phases clearly, it helps teams stay aligned and focused on goals. Fully editable and compatible with PowerPoint, Keynote, and Google Slides for smooth, professional presentations every time.


8 slides
Investor Business Plan Presentation
The "Investor Business Plan Presentation" template is innovatively designed to illustrate the balance and interdependence of various business elements critical for attracting investors. Utilizing a seesaw mechanism as a metaphor, this template vividly demonstrates how key aspects like Partners, Resources, Activities, and Channels contribute to maintaining a stable and functional business model. Each section of the seesaw is colored differently to distinguish between the categories, providing a clear visual hierarchy. This presentation format is excellent for startups and existing businesses preparing to pitch to investors, highlighting how each strategic component is vital for overall success and stability in the market.


6 slides
Territorial Analysis of US Regions Presentation
Present clear regional insights with this Territorial Analysis of US Regions template. Ideal for market segmentation, sales reporting, or demographic studies. Each region is color-coded for quick comparison and fully editable to match your data. Compatible with PowerPoint, Keynote, and Google Slides—perfect for marketers, strategists, or analysts.


10 slides
Hierarchy Tree Structure Slide Presentation
Bring your ideas to life with a dynamic visual flow that connects every stage of your business strategy. Perfect for mapping growth, processes, or team structures, this clean and modern layout keeps your data clear and engaging. Fully compatible with PowerPoint, Keynote, and Google Slides for effortless customization.


22 slides
Zephyr Product Launch Pitch Deck Presentation
Step into the spotlight with this modern and captivating product launch pitch deck! Designed to showcase your ideas with clarity, it covers every key aspect from market opportunities to financials. Impress investors with strategic insights and sleek visuals that guide them through your business plan. Perfect for PowerPoint, Keynote, and Google Slides!


4 slides
Market Entry Strategic Plan Layout
Break down your go-to-market strategy with the Market Entry Strategic Plan Layout Presentation. This slide is designed to help you visually outline four key initiatives or phases in your market entry approach, anchored by a central launch icon. The horizontal color-gradient layout ensures clarity while guiding viewers through each step. Fully editable in PowerPoint, Keynote, and Google Slides.


3 slides
Triangle Diagram for Strategic Layers Presentation
Visualize interconnected processes or layered strategies with the Triangle Diagram for Strategic Layers Presentation. This slide features three dynamic triangle shapes arranged in a circular flow, perfect for representing cycles, frameworks, or pillars of a system. Each point includes space for a title, icon, and supporting text. Great for illustrating collaboration, dependencies, or strategic pillars. Compatible with PowerPoint, Keynote, and Google Slides.


6 slides
Section Breakdown Table of Content Presentation
Present your topics in a clear, structured way with the Section Breakdown Table of Content template. Featuring a two-column layout with colorful icons and labeled sections, it’s perfect for outlining multiple categories. Fully editable in Canva, PowerPoint, and Google Slides to match your brand style and improve presentation flow.


4 slides
Athlete Performance Metrics Presentation
Track and display key performance data with this Athlete Performance Metrics slide. Featuring a semi-circular layout with sports icons, percentages, and editable text areas, this template helps visualize stats clearly. Ideal for coaching reports or sports analysis. Compatible with PowerPoint, Keynote, and Google Slides for easy customization and use.


2 slides
Creative Business Presentation
Showcase your ideas with energy and style using this bold, contemporary presentation layout. Featuring dynamic visuals and clean typography, this template is ideal for business proposals, portfolios, and startup pitches. Easily customizable in PowerPoint, Keynote, and Google Slides to suit your brand's identity.


4 slides
Social Media Content Strategy Presentation
Engage your audience with this Social Media Content Strategy Presentation. Featuring side-by-side thumbs-up icons, this template visually contrasts two key focus areas—ideal for comparing campaign goals, content pillars, or platform strategies. Each section includes editable text blocks to outline insights clearly. Fully customizable and compatible with PowerPoint, Keynote, and Google Slides.