


Features
- 5 Unique slides
- Fully editable and easy to edit in Microsoft Powerpoint, Keynote and Google Slides
- 16:9 widescreen layout
- Clean and professional designs
- Export to JPG, PDF or send by email


Do you have any questions?
Recommend


6 slides
Hexagonal Grid for Process Mapping Presentation
Visualize your workflow with structure using the Hexagonal Grid for Process Mapping Presentation. This clean, geometric layout guides viewers through each phase of your process with clarity and consistency. Ideal for outlining steps, stages, or interconnected tasks in a modern format. Fully editable in Canva, PowerPoint, Keynote, and Google Slides.


5 slides
Business SWOT Infographics
Dive deep into organizational analysis with our business SWOT infographics. Crafted in engaging shades of blue and pink, this collection is an essential tool for businesses aiming to uncover their strengths, weaknesses, and threats. This template, brimming with creative graphics and icons, is specifically designed for business strategists, educational instructors, and company executives who are keen to present SWOT analysis with clarity. Compatible with Powerpoint, keynote, and Google Slides. Its vertical, creative styling makes complex information digestible, fostering understanding and strategic thinking in your business planning sessions.


5 slides
Risk and Return Investment Presentation
Navigate the high seas of finance with our captivating infographic presentation template, designed to visually break down the complex relationship between risk and return in investments. This template simplifies presenting key data points, making it ideal for financiers and investors looking to make informed decisions. Each slide is meticulously crafted to ensure clarity and impact, highlighting the balance of potential rewards against possible risks. Perfect for use in PowerPoint, Keynote, and Google Slides, this template is a must-have tool for anyone in the financial sector aiming to convey their strategy with precision and flair.


5 slides
Benefits of Yoga Infographics
Yoga offers a wide range of benefits for the mind, body, and overall well-being, these also tend to deepen with regular practice. These infographic templates highlight the numerous advantages of practicing yoga. Whether you're a yoga instructor, wellness coach, or health enthusiast, this template provides a comprehensive overview of the physical, mental, and emotional benefits of yoga. The infographics include text boxes, illustrations, and graphs that can be used to promote the advantages of incorporating yoga into one's lifestyle. Compatible with Powerpoint, Keynote, and Google Slides, these are easily customizable.


5 slides
Multi-Layer Concentric Diagram Presentation
Make a splash with your ideas using this layered ripple-style layout! Perfect for visualizing cascading strategies, phased impacts, or multi-tiered processes, this multi-layer concentric diagram turns complex data into clean, memorable visuals. Fully compatible with PowerPoint, Keynote, and Google Slides, it’s ready to elevate your next presentation.


26 slides
Katlina Presentation Template
Everyone wants to be on top of their SEO game. This Katlina presentation template provides a way for you to teach your audience about the importance of Search Engine Optimization. Start creating your own slides with this template. With fun graphics that will also make the information more interesting and easy to understand charts and timelines.This presentation will help your audience see how they can increase their sites visibility in search results. It can also be use for your presentations at work or in class due to it's customizability. Get started today makeing an impact in your industry.


6 slides
Go-to-Market Launch Plan Presentation
Launch with confidence using this Go-to-Market Launch Plan Presentation. This clean, step-by-step visual framework highlights each phase of your GTM strategy—from market research to execution metrics. Ideal for startups, product managers, and marketing teams. Fully customizable in PowerPoint, Keynote, and Google Slides.

21 slides
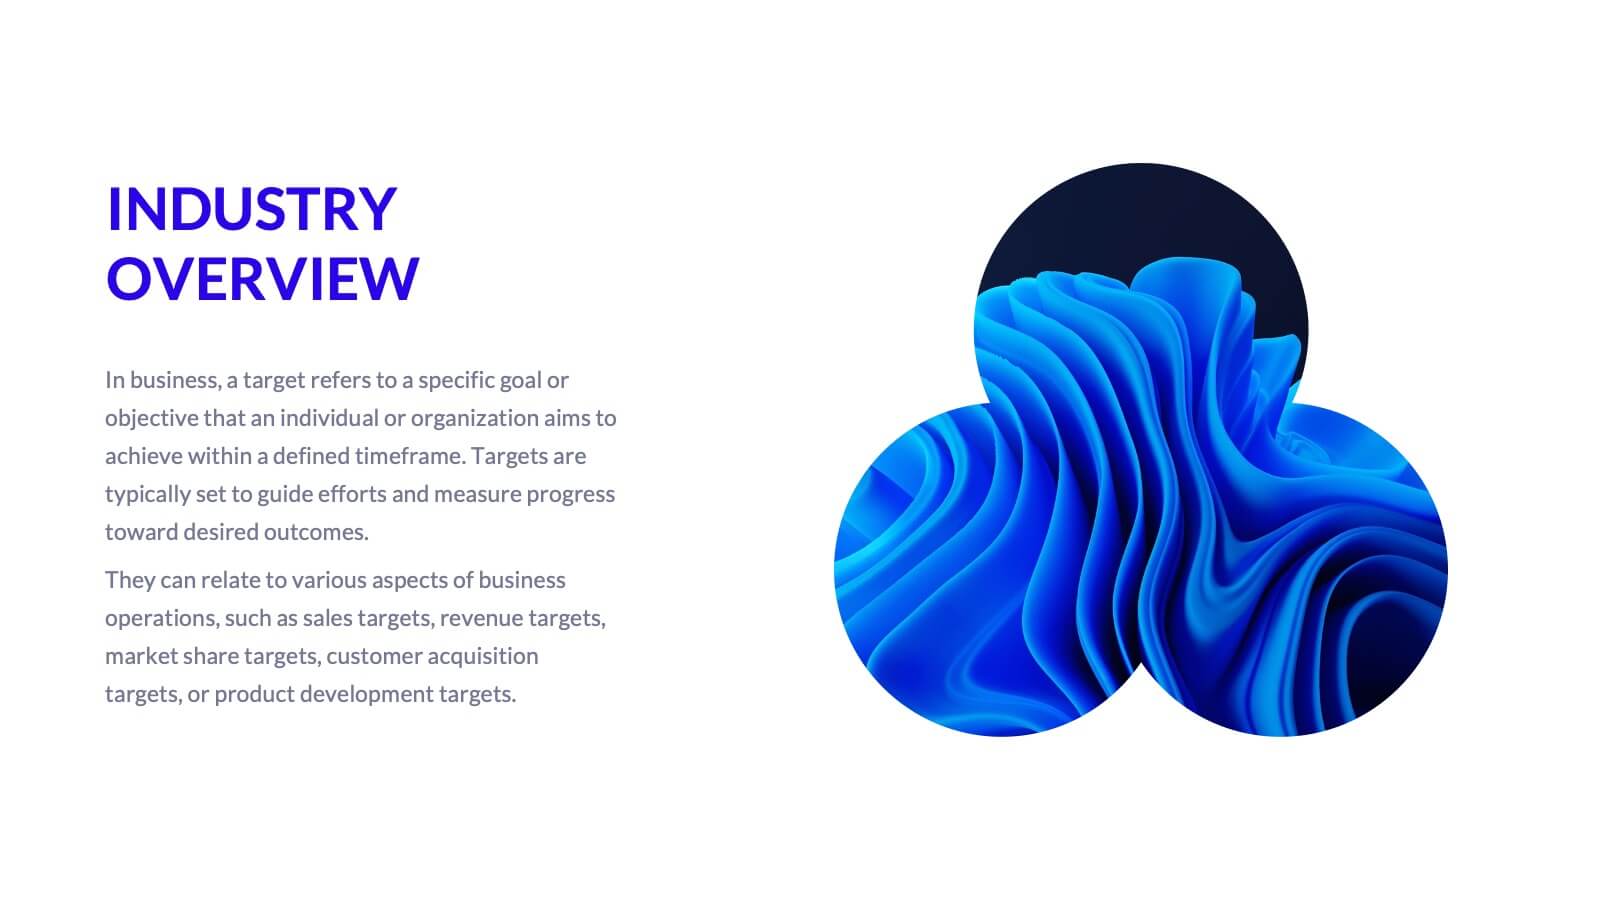
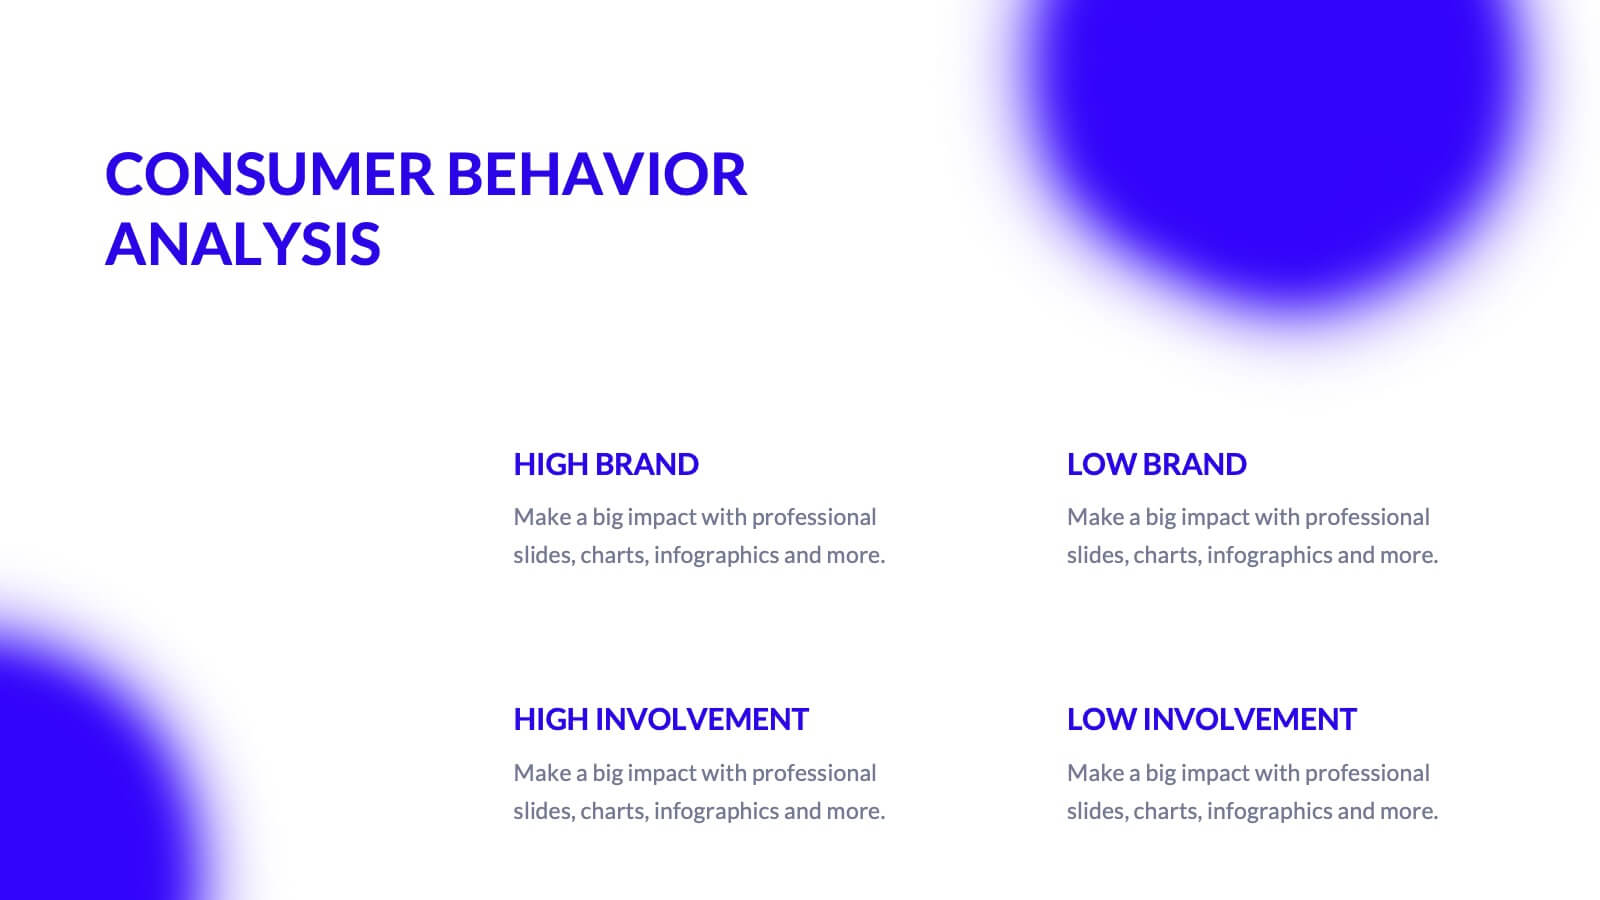
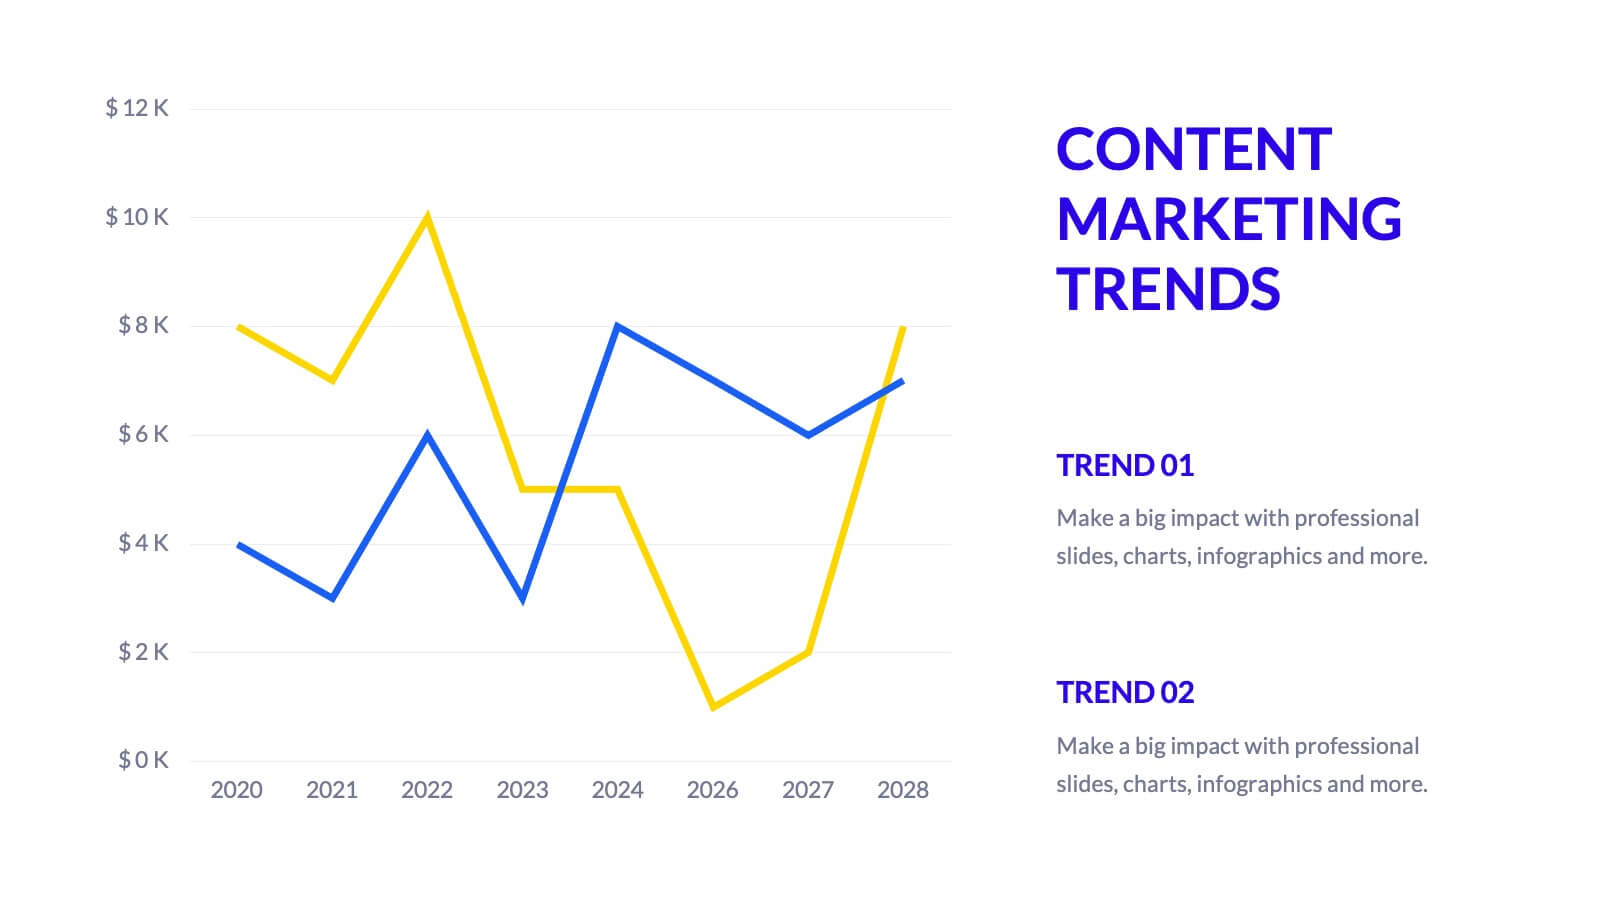
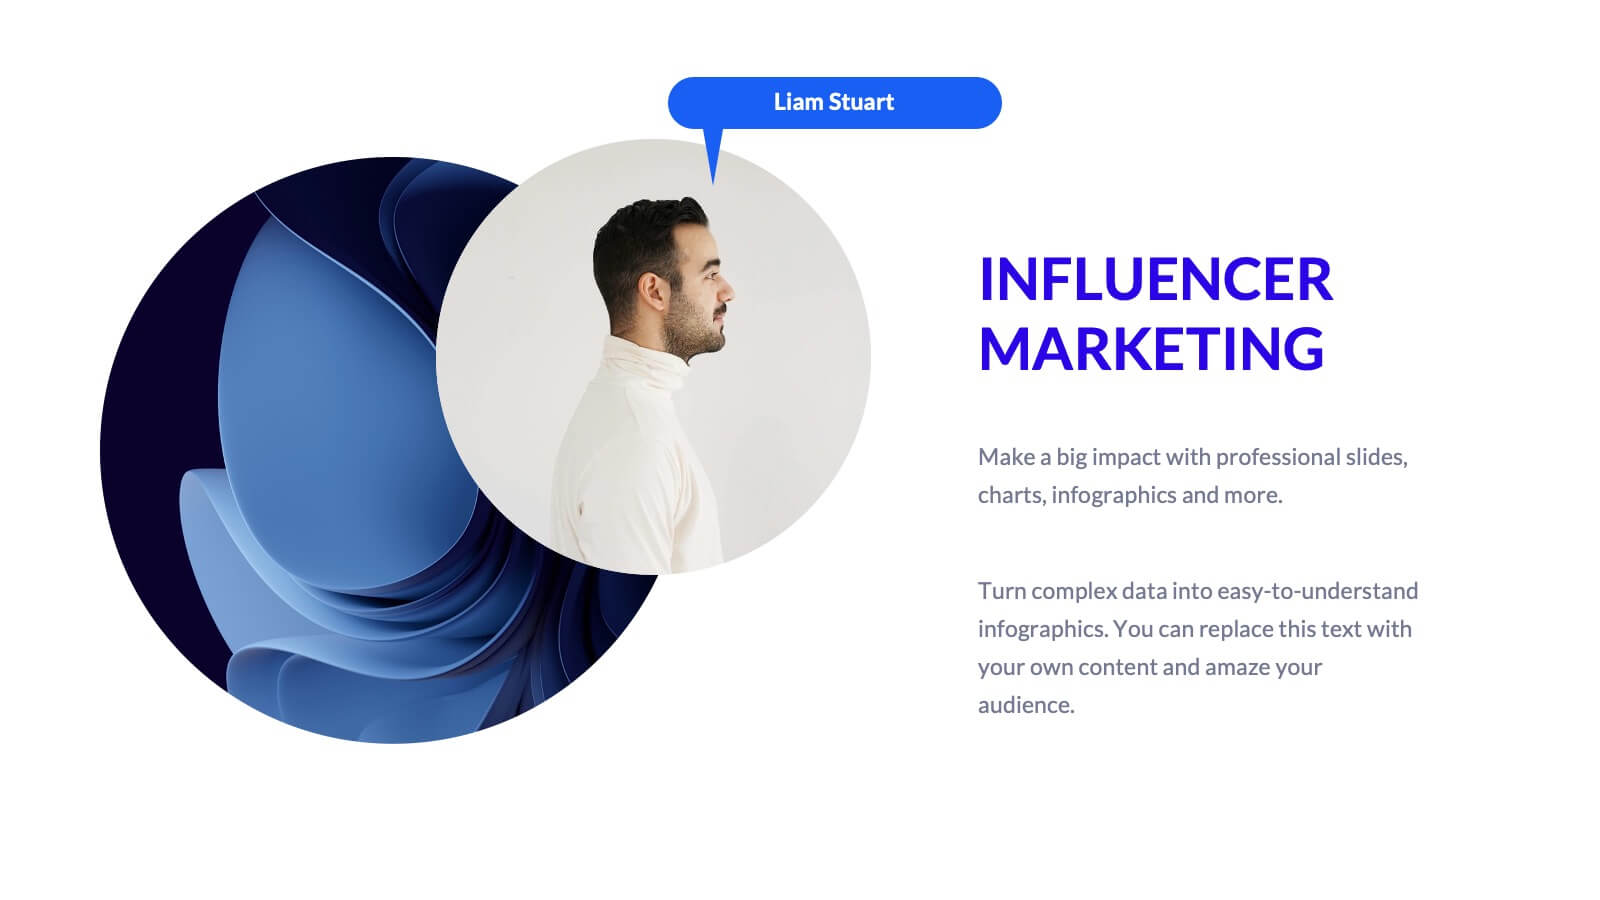
Catalyst Digital Marketing Strategy Plan Presentation
Supercharge your digital marketing strategy with this vibrant, modern presentation template. Perfect for detailing industry overviews, consumer behavior analysis, and social media strategies, it features a dynamic design that captures attention. Highlight key trends like SEO, influencer marketing, and e-commerce to engage your audience. Compatible with PowerPoint, Keynote, and Google Slides, it ensures seamless presentations on any platform.


8 slides
Biological Structure and Function Presentation
Visualize biological processes with the Biological Structure and Function infographic. Featuring a hexagonal layout, this template allows you to categorize key concepts such as molecular functions, chemical reactions, and biological systems. Fully editable and available for PowerPoint, Keynote, and Google Slides.


6 slides
Consumer Psychology in Marketing Presentation
Unlock the secrets of customer behavior with our 'Consumer Psychology in Marketing' presentation template. Tailored for marketing professionals, this template allows you to visually dissect and present consumer insights and behaviors. Engage your audience with compelling content that's perfect for workshops or client presentations, compatible with PowerPoint, Keynote, and Google Slides.


6 slides
Customer Journey Management Infographic
Map out the customer's path to purchase with our intuitive Customer Journey Management Infographic, perfect for Powerpoint, Google Slides, and Keynote. This visual tool helps businesses understand and enhance the customer experience at every touchpoint. Highlight critical stages from awareness to advocacy with distinct, easy-to-follow layouts. Customize it to fit your brand’s journey, showcasing the interactions and emotions customers encounter. Ideal for marketing strategy sessions and client presentations, it simplifies complex consumer behavior into a clear, actionable pathway.


5 slides
Freight and Shipping Optimization Presentation
Streamline your logistics narrative with this world map–inspired layout designed for international freight strategies. This infographic-style slide features four customizable location markers with icons and descriptive text, perfect for mapping routes, warehouses, or shipping hubs. Ideal for global supply chain teams, logistics consultants, and shipping analysts. Fully editable in PowerPoint, Keynote, and Google Slides.


7 slides
Problem Solving Infographic
Transform your approach to complex challenges with our Infographic Templates, crafted to facilitate effective problem-solving. This set offers a range of designs that make it simple to map out solutions, visualize decision processes, and communicate actionable strategies. With options from hexagonal designs that interlink components to sleek, linear layouts that guide the viewer through each step of the problem-solving journey, these templates are ideal for making complex information accessible and engaging. Customize each template with your choice of colors, fonts, and text to maintain a consistent brand identity. Compatible with PowerPoint, Google Slides, and Keynote, they are perfect for business strategists, project managers, and consultants who need to present solutions clearly and persuasively. Equip yourself with these templates to drive effective problem-solving and decision-making in your presentations.


5 slides
Strategic Vision for Long-Term Growth
Turn big goals into clear milestones with this upward path-style layout—perfect for illustrating your company’s strategic vision and long-term growth plan. Use each step to highlight priorities, phases, or guiding principles along the journey. Fully compatible with PowerPoint, Keynote, and Google Slides.


6 slides
Quarterly Sales Overview Presentation
Bring your numbers to life with a clear, colorful layout that makes quarterly progress instantly easy to understand. This presentation helps you break down trends, compare performance across quarters, and highlight key insights with simple bar visuals. Perfect for reports and meetings, and fully compatible with PowerPoint, Keynote, and Google Slides.


23 slides
Cycladic UX Design Presentation
The Cycladic UX Design Presentation Template is a bold and vibrant choice for showcasing your UX/UI design projects. With its striking pink and black color scheme, this template is designed to grab attention and keep your audience engaged. It covers all essential aspects of UX design, from project overviews and user research to wireframes, prototyping, and UI design principles. Each slide is thoughtfully designed to present your content clearly and effectively, making it ideal for designers who want to highlight their process, showcase their work, and communicate their design thinking.


6 slides
Business Growth and Progress Metrics Presentation
Showcase milestones, trends, and business wins with this sleek bar chart and line graph combo. Designed to illustrate upward momentum, each slide highlights progress using a trophy peak icon, 5 key steps, and editable labels. Ideal for quarterly reviews, growth tracking, and strategic updates. Fully compatible with PowerPoint, Keynote, and Google Slides.