


Features
- 4 Unique slides
- Fully editable and easy to edit in Microsoft Powerpoint, Keynote and Google Slides
- 16:9 widescreen layout
- Clean and professional designs
- Export to JPG, PDF or send by email


Do you have any questions?
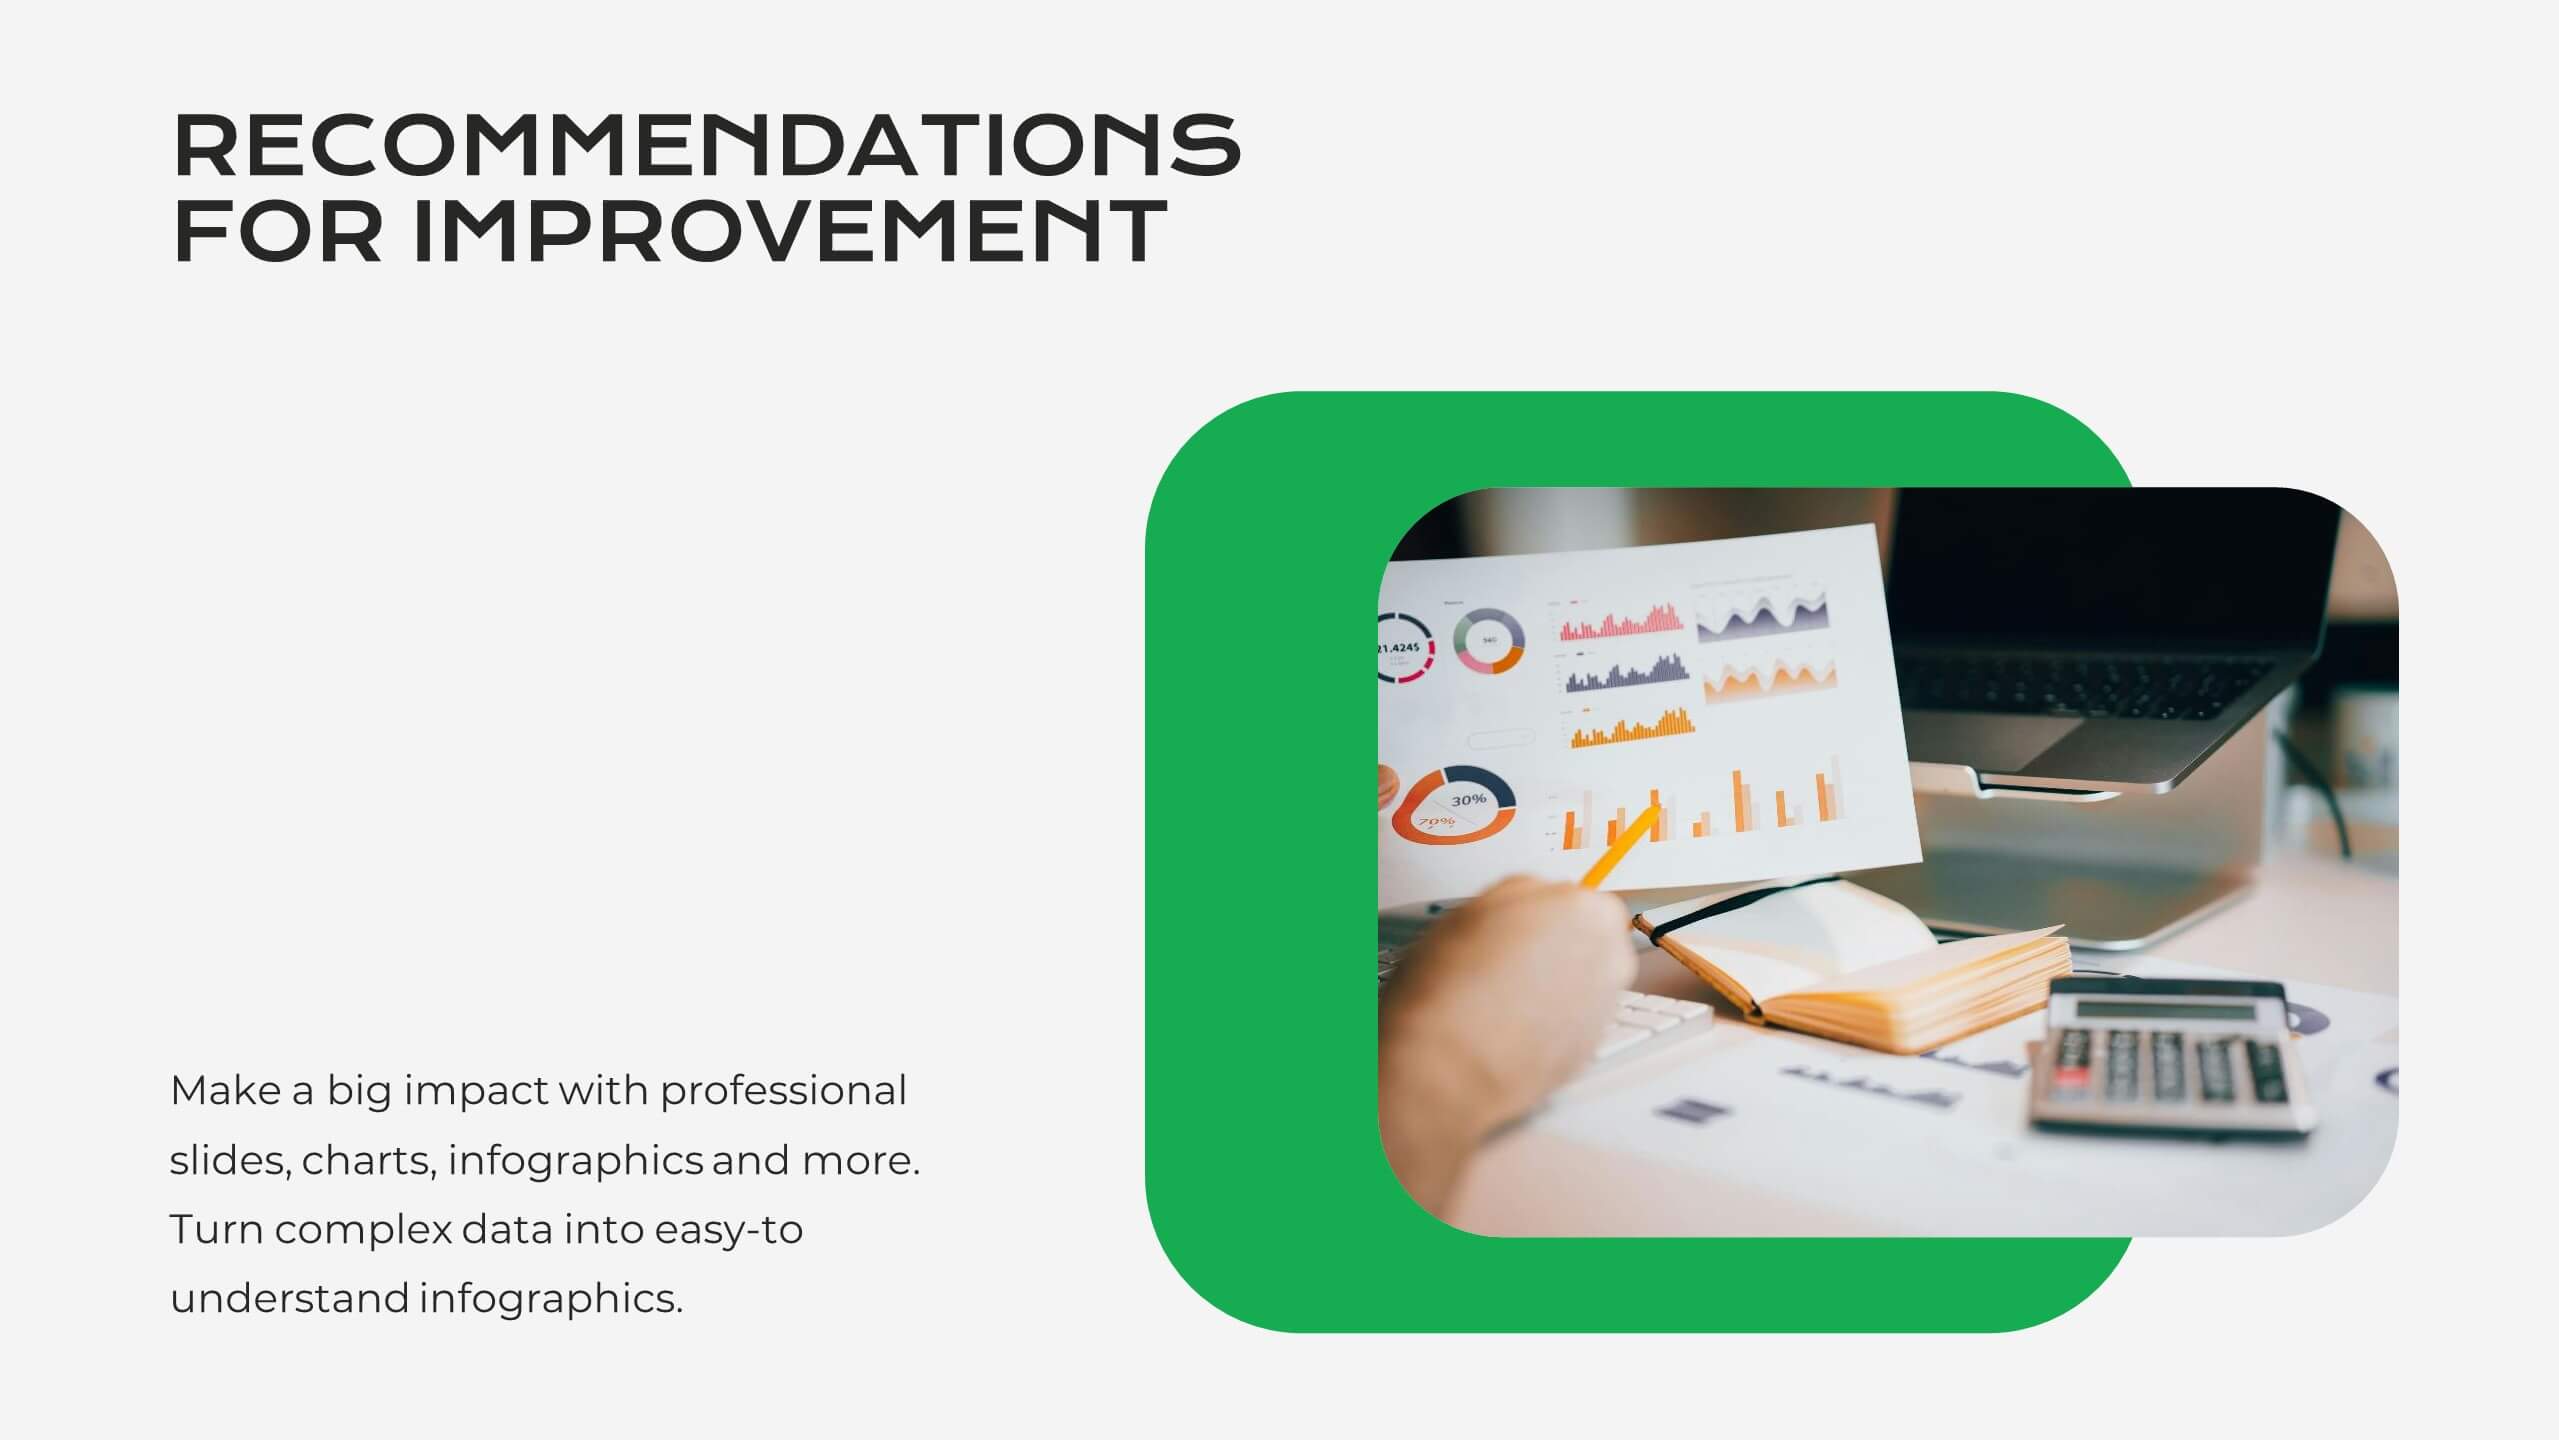
Recommend


5 slides
Meeting Minutes and Notes Presentation
Keep every discussion organized and every detail accounted for with this clean and structured layout. Perfect for summarizing key decisions, attendees, and next steps, it helps teams capture essential meeting insights efficiently. This easy-to-edit template works flawlessly with PowerPoint, Keynote, and Google Slides for a polished professional presentation.


6 slides
Strategic Business Planning Presentation
Bring your ideas to life with a slide design that makes strategic planning feel bold, focused, and easy to follow. This presentation walks through key business objectives, priorities, and action steps using clean visuals and intuitive layouts. Perfect for teams presenting strategy, goals, and long-term planning. Fully compatible with PowerPoint, Keynote, and Google Slides.


5 slides
Financial Overview and Money Flow Presentation
Showcase financial performance and money distribution with this clear, layered infographic. Each stack segment represents a key insight—ideal for budgets, cost analysis, or income flow presentations. Simple yet visually effective, it's perfect for helping stakeholders see the full picture. Fully compatible with PowerPoint, Keynote, and Google Slides.


2 slides
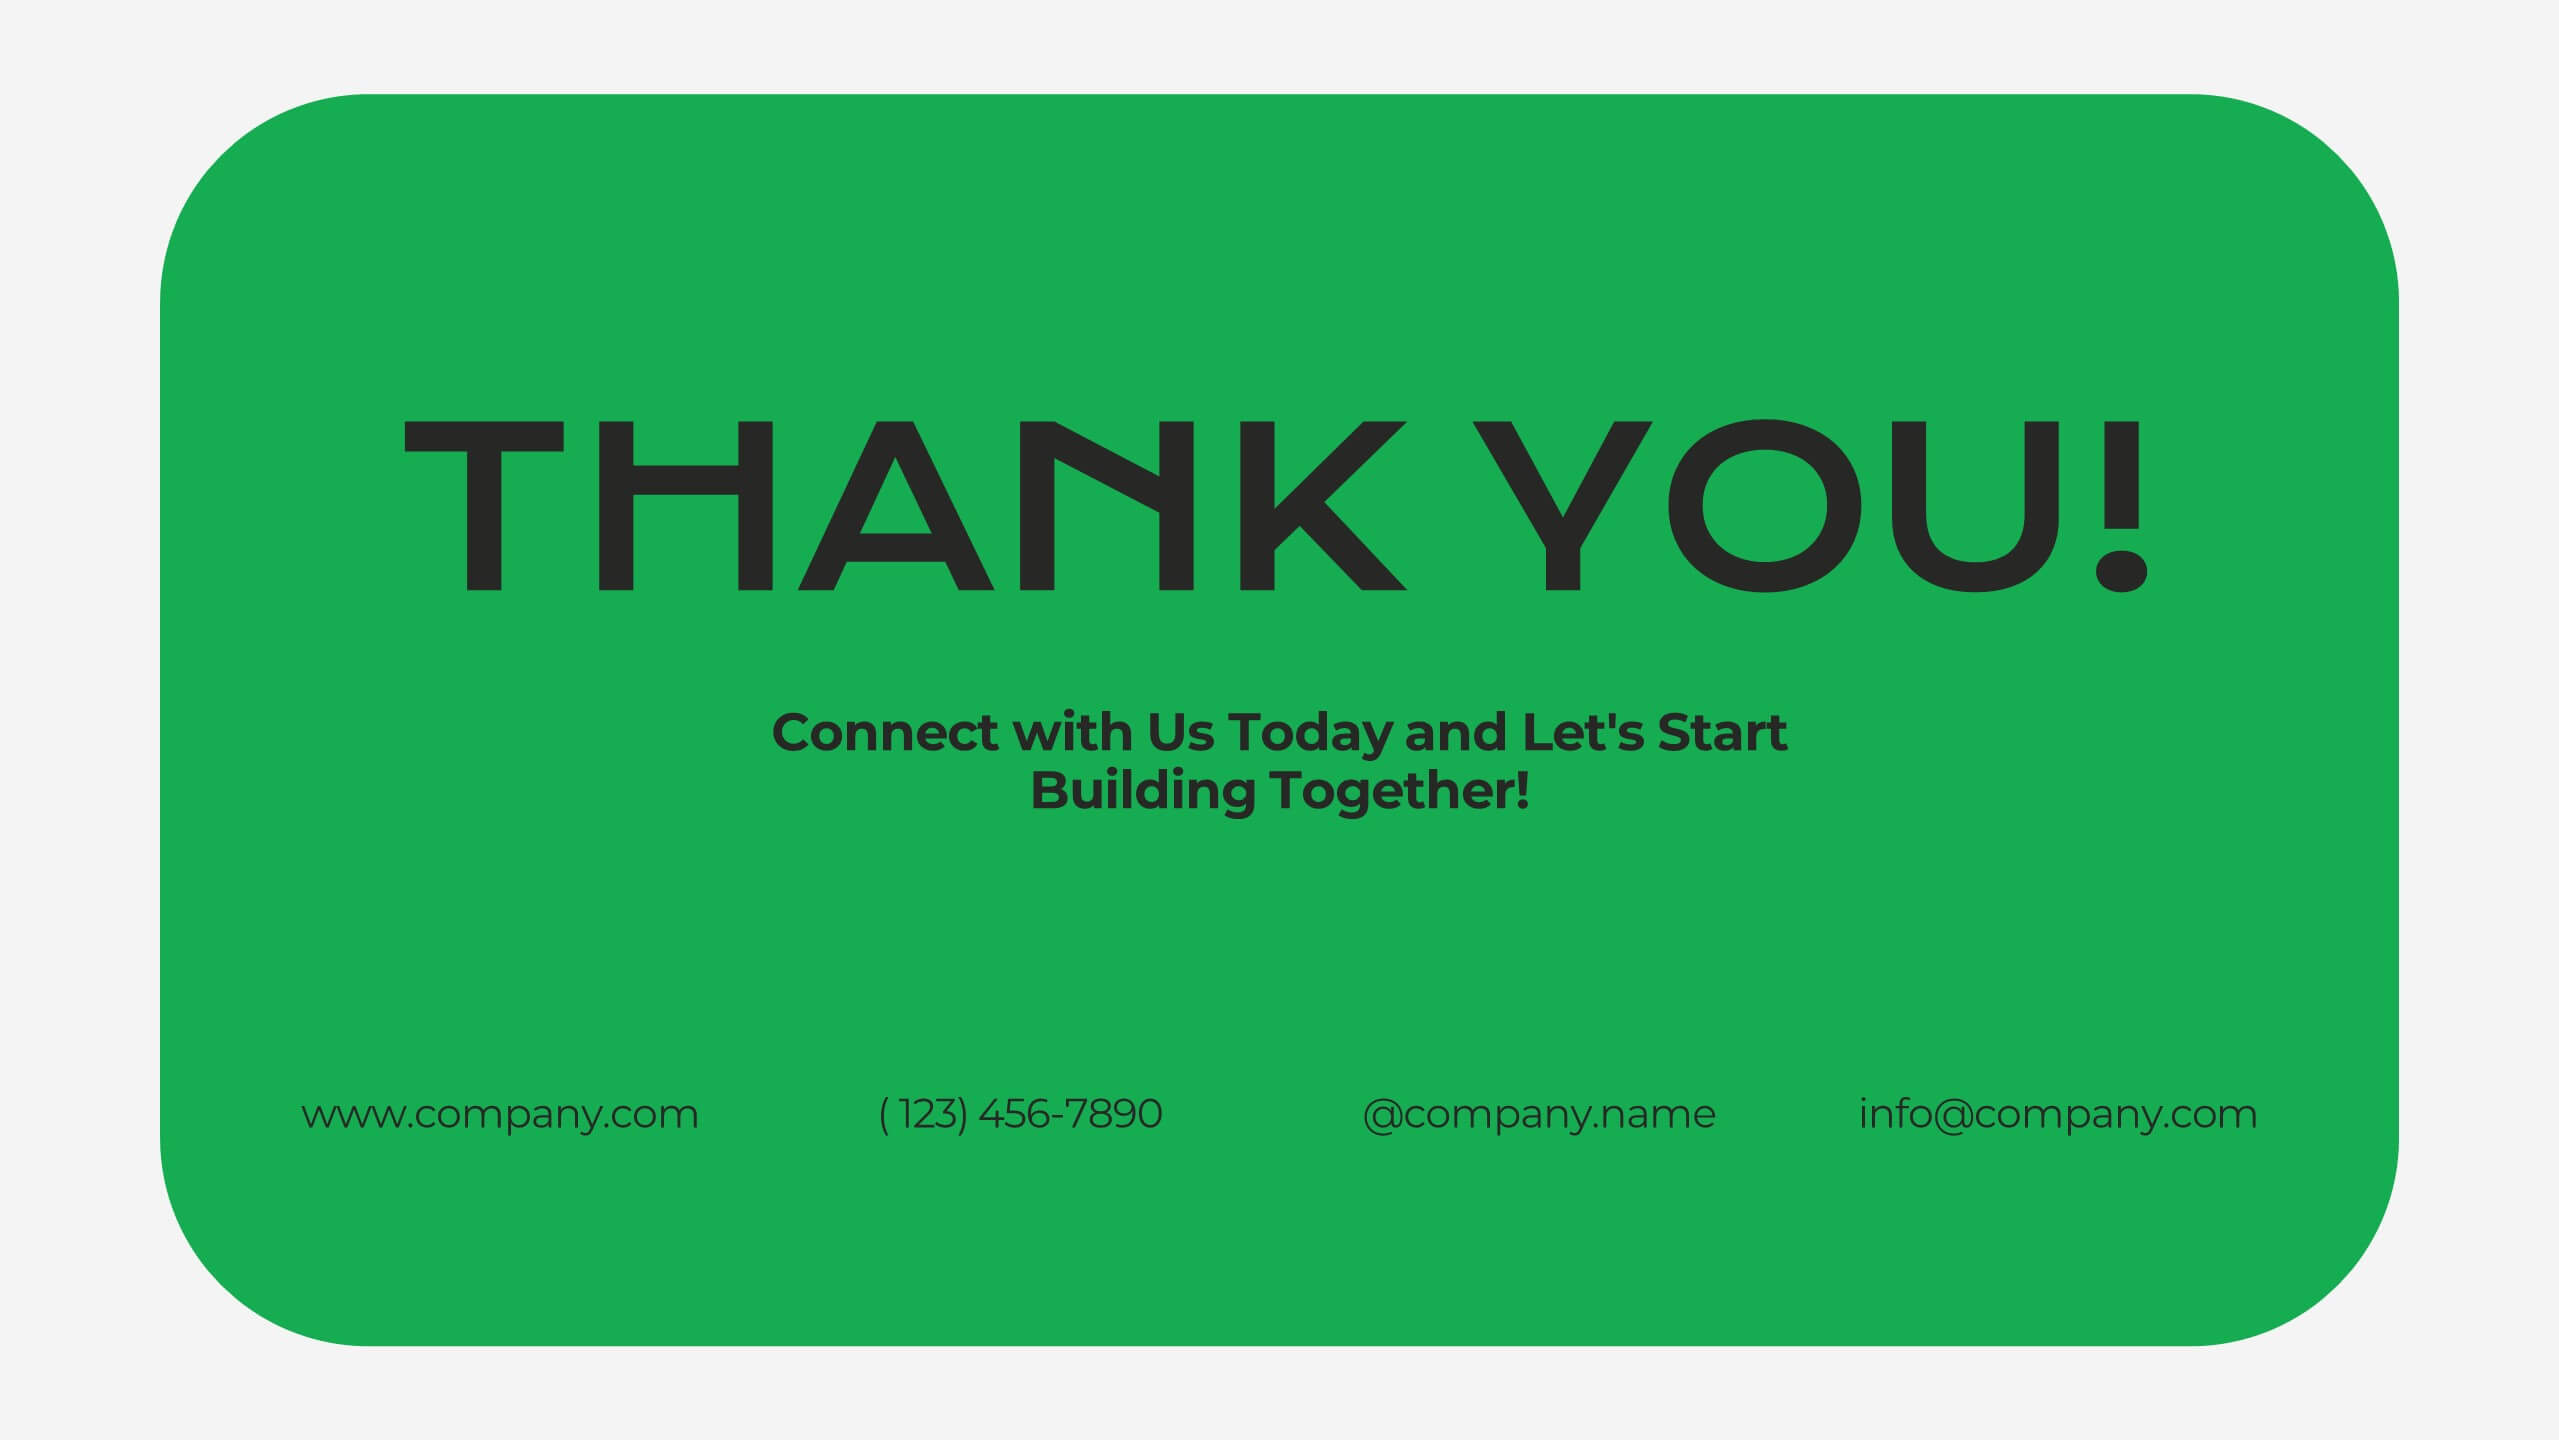
Final Gratitude Page in Deck Presentation
The Final Gratitude Page in Deck Presentation is a bold and engaging closing slide, ideal for ending your presentation with personality and professionalism. With its bright orange theme, modern photo frame, and "THANK YOU!" message in clear typography, it leaves a lasting impression on your audience. Perfect for webinars, educational talks, or business presentations. Fully customizable in PowerPoint, Keynote, and Google Slides.


5 slides
Customer Survey Results Presentation
Gain valuable insights with this Customer Survey Results Presentation. Featuring a clean and data-driven layout, this template allows you to visualize customer feedback, satisfaction scores, and key performance metrics using interactive charts, graphs, and tables. Fully customizable in PowerPoint, Keynote, and Google Slides, you can adjust colors, edit labels, and modify content to fit your survey needs.


6 slides
Career Objective Infographic
Objective slides help communicate goals, aims, and purpose of the presentation to the audience. This infographic template is a visual representation that communicates your career goals, aspirations, and the value you bring to potential employers. This template serves as a roadmap for your presentation, helping both you and your audience understand the purpose and direction of your objective. Compatible with Powerpoint, Keynote, and Google Slides. This showcases your career objectives and key qualifications. Use a design that reflects your industry and personal brand while conveying your career objectives effectively.


6 slides
Statistics and Figures Report Presentation
Present complex data with clarity using the Statistics and Figures Report Presentation template. Featuring scatter plots, radar charts, and key metric highlights, this template is perfect for performance tracking, analytics reports, and business reviews. Fully customizable for PowerPoint, Keynote, and Google Slides, it ensures professional and insightful data visualization.


4 slides
Green Initiative Report Deck Presentation
Show your sustainability story with a modern, eco-inspired presentation built to highlight green initiatives, progress reports, and environmental goals. Its clean layout makes data and insights easy to follow while maintaining a professional tone. Fully customizable and compatible with PowerPoint, Keynote, and Google Slides for effortless presentation design.


7 slides
Home Buyer Checklist Infographic
Step into your dream home with confidence using our Home Buyer Checklist Infographic Template. This visually engaging guide is meticulously designed to streamline the home-buying process, making it transparent and manageable for first-time buyers and seasoned investors alike. This template provides a comprehensive checklist that covers every important aspect of home buying, from budgeting and financing to inspecting and closing. Its intuitive layout and vibrant design elements make complex tasks approachable and easy to understand, ensuring you don’t miss a beat on your journey to homeownership. Tailor each slide to your specific needs by customizing colors, text, and graphics to reflect your personal style or brand identity. Ideal for real estate agents, mortgage advisors, and educational workshops, this template empowers users to navigate the maze of real estate transactions with ease and assurance.

21 slides
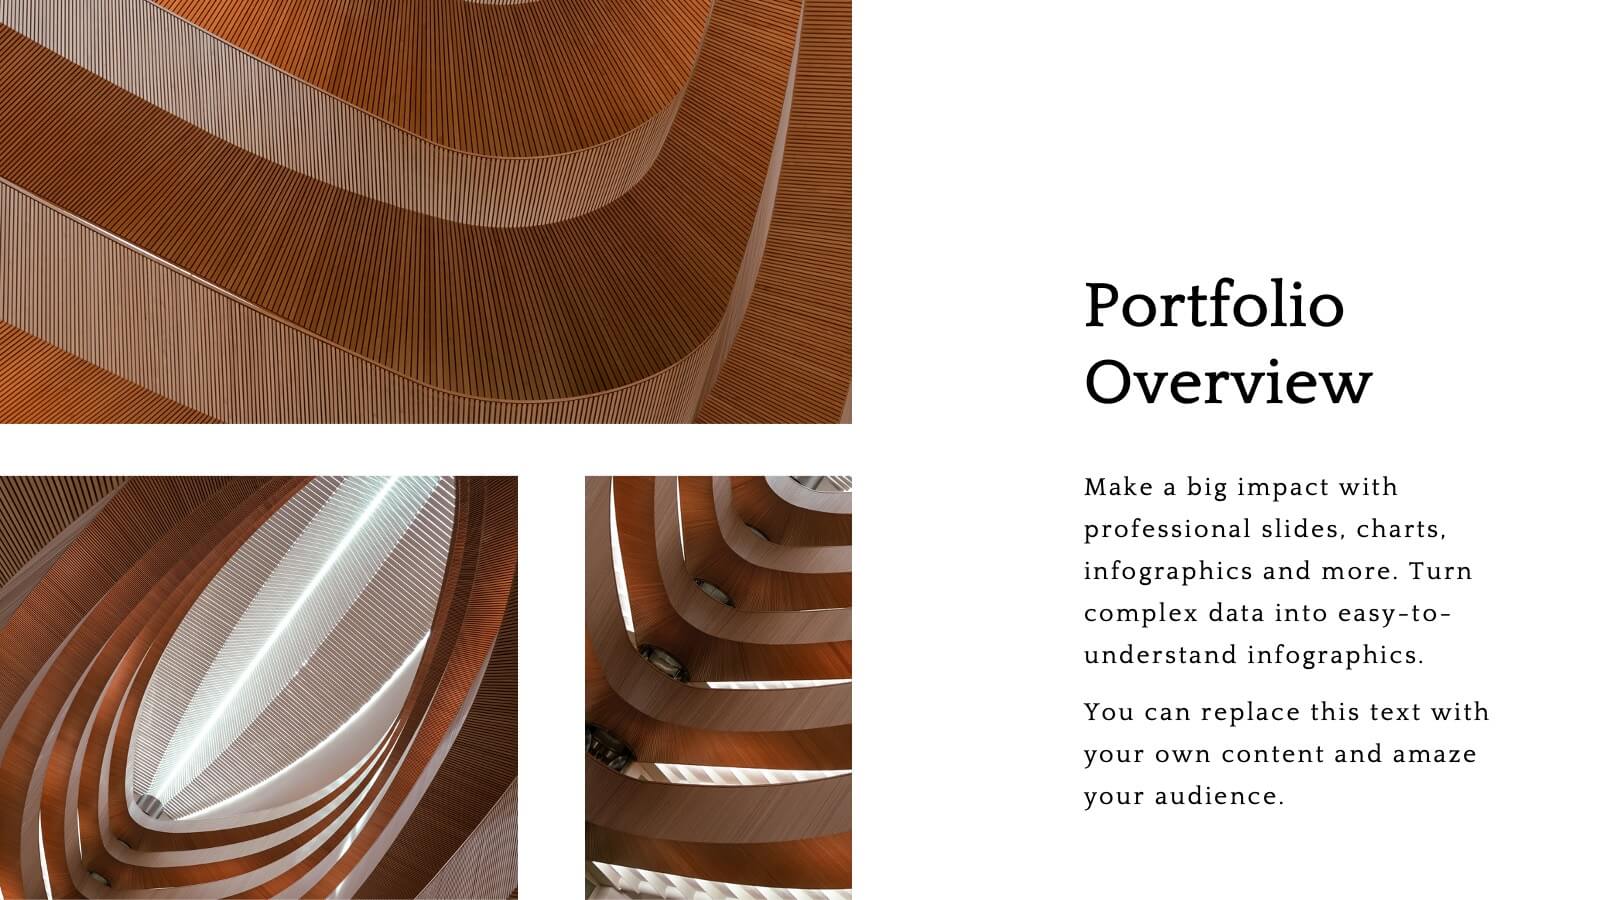
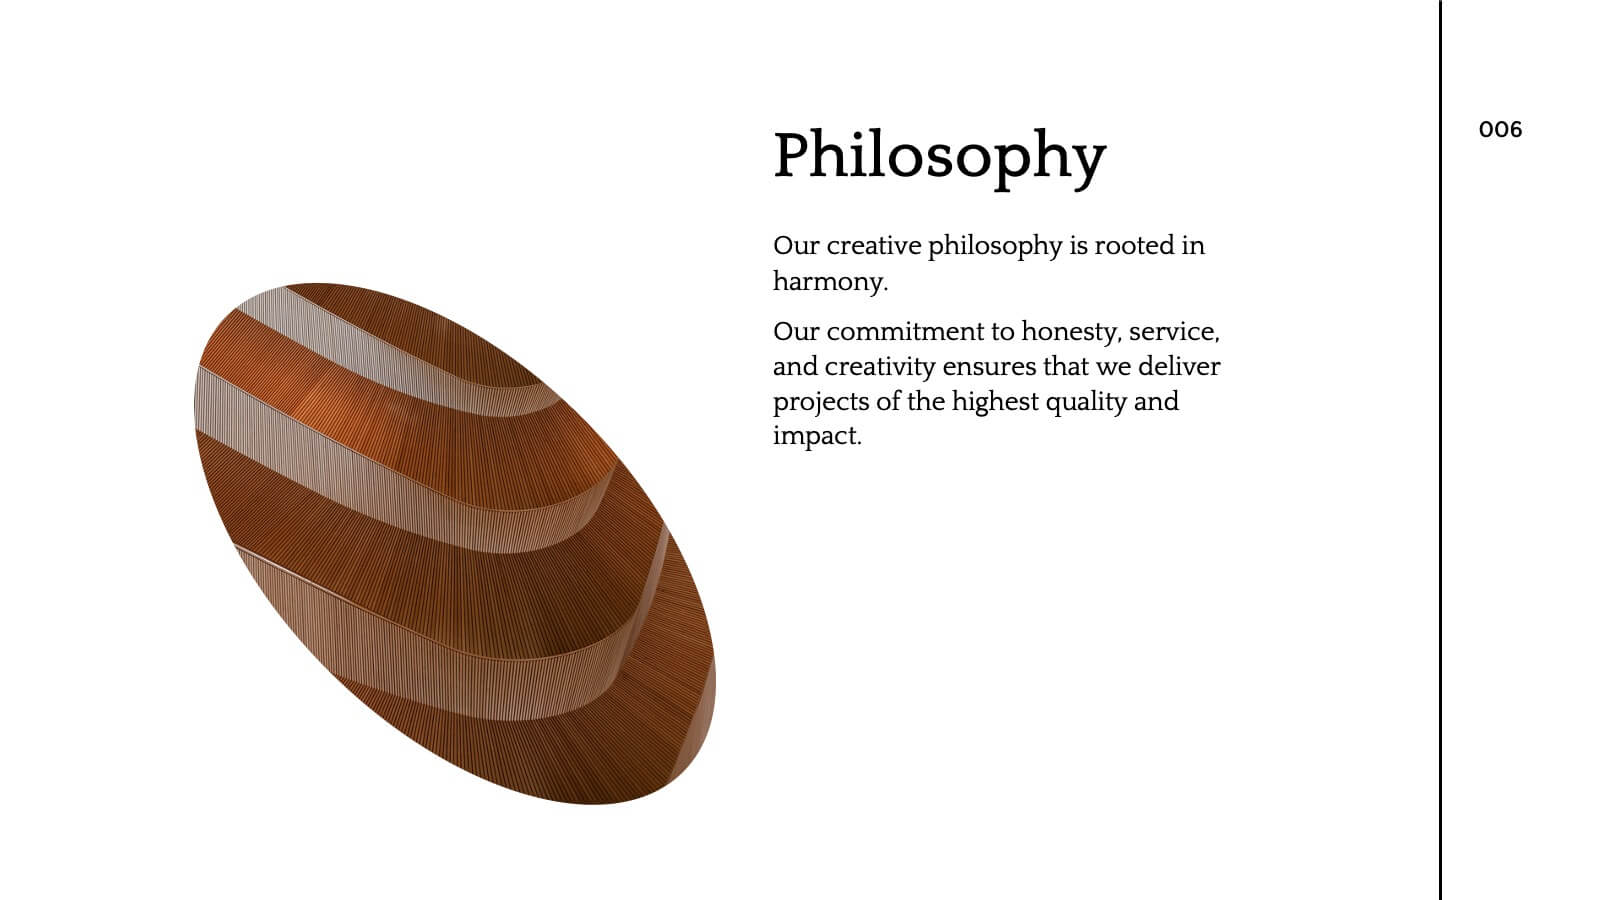
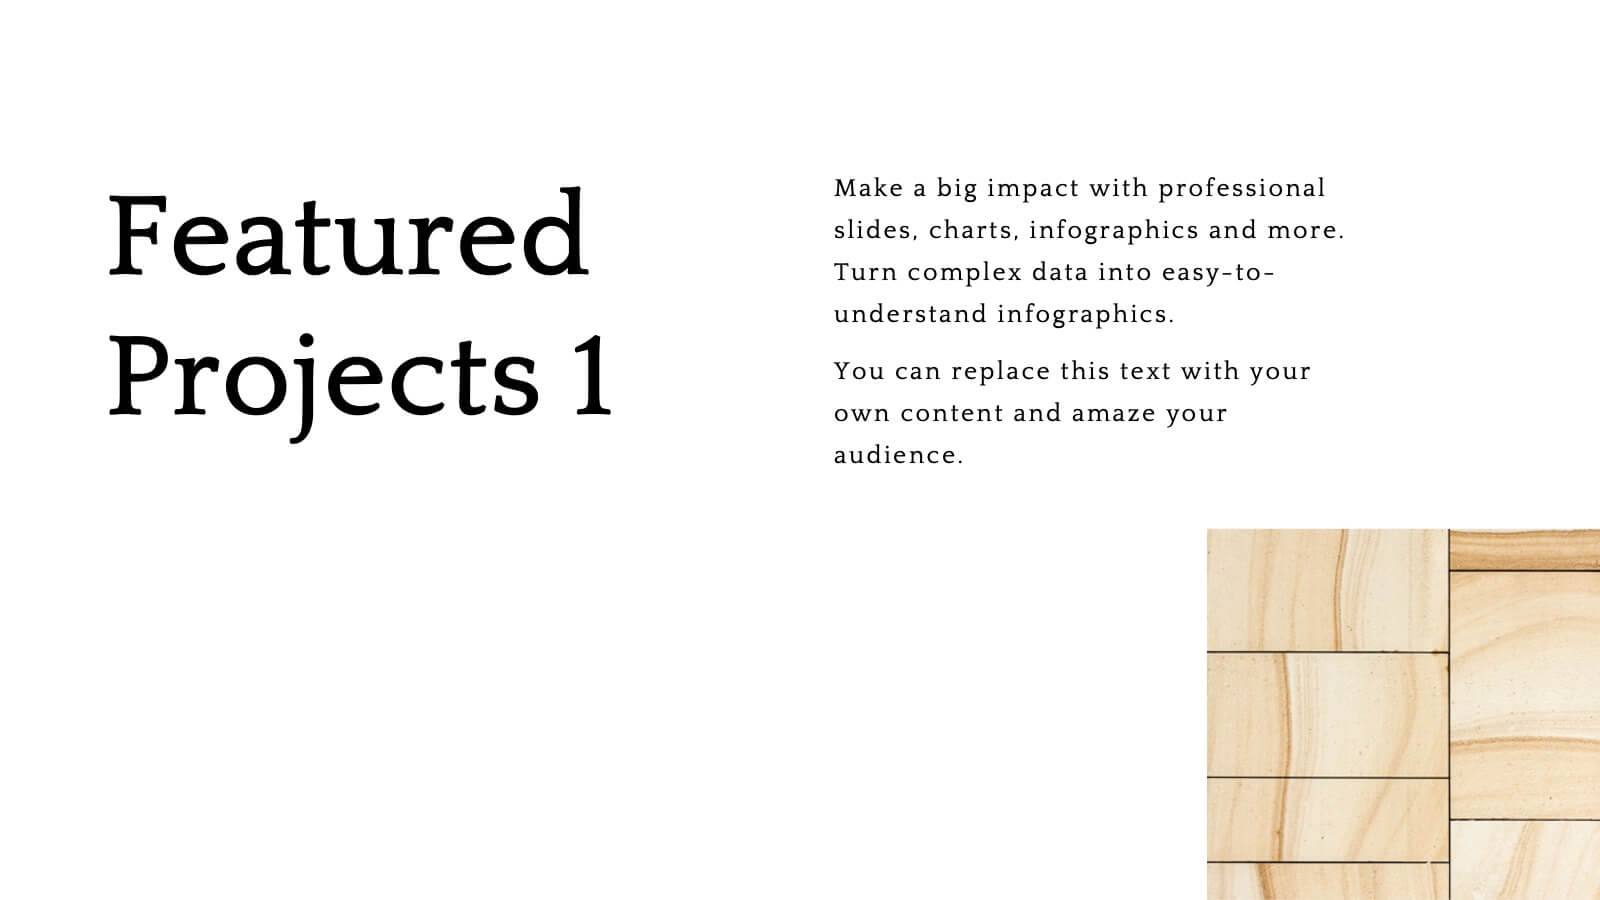
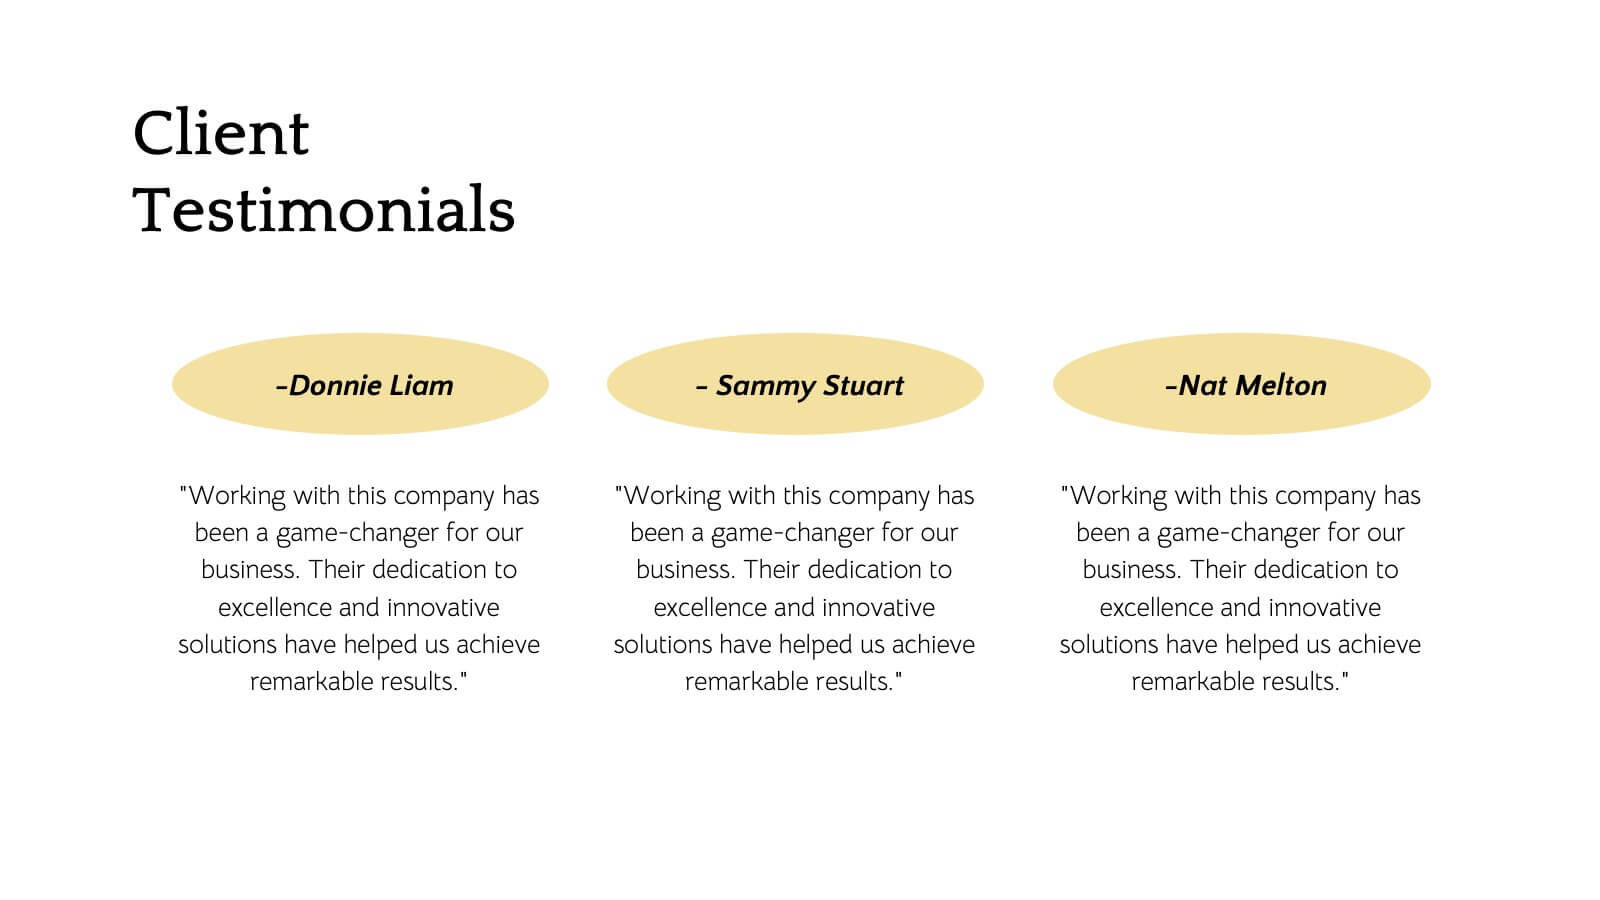
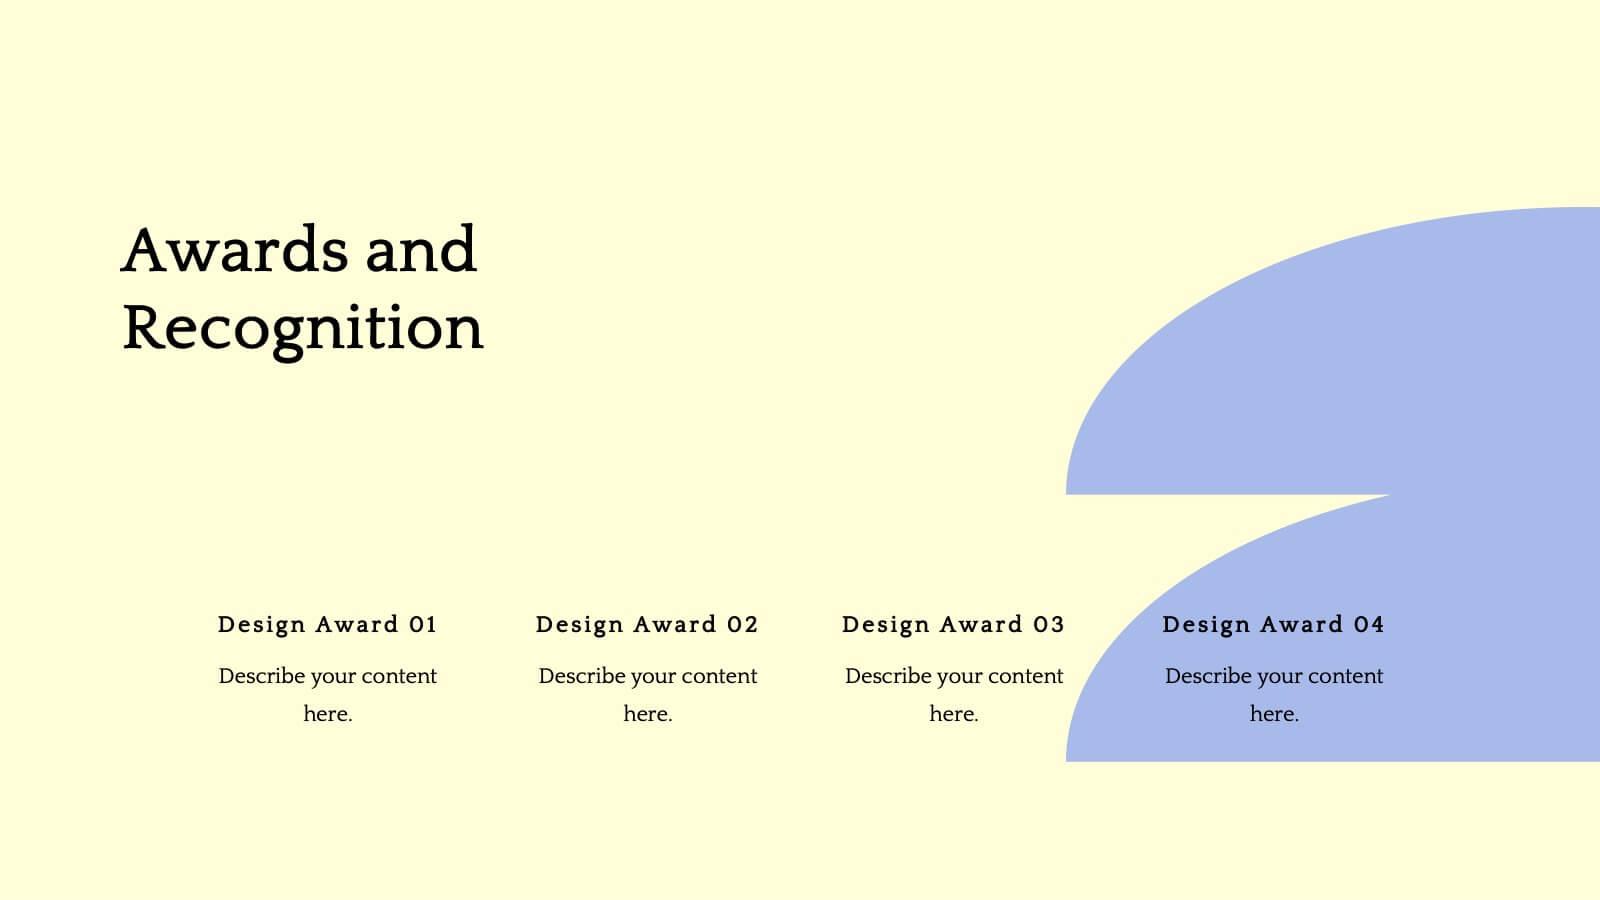
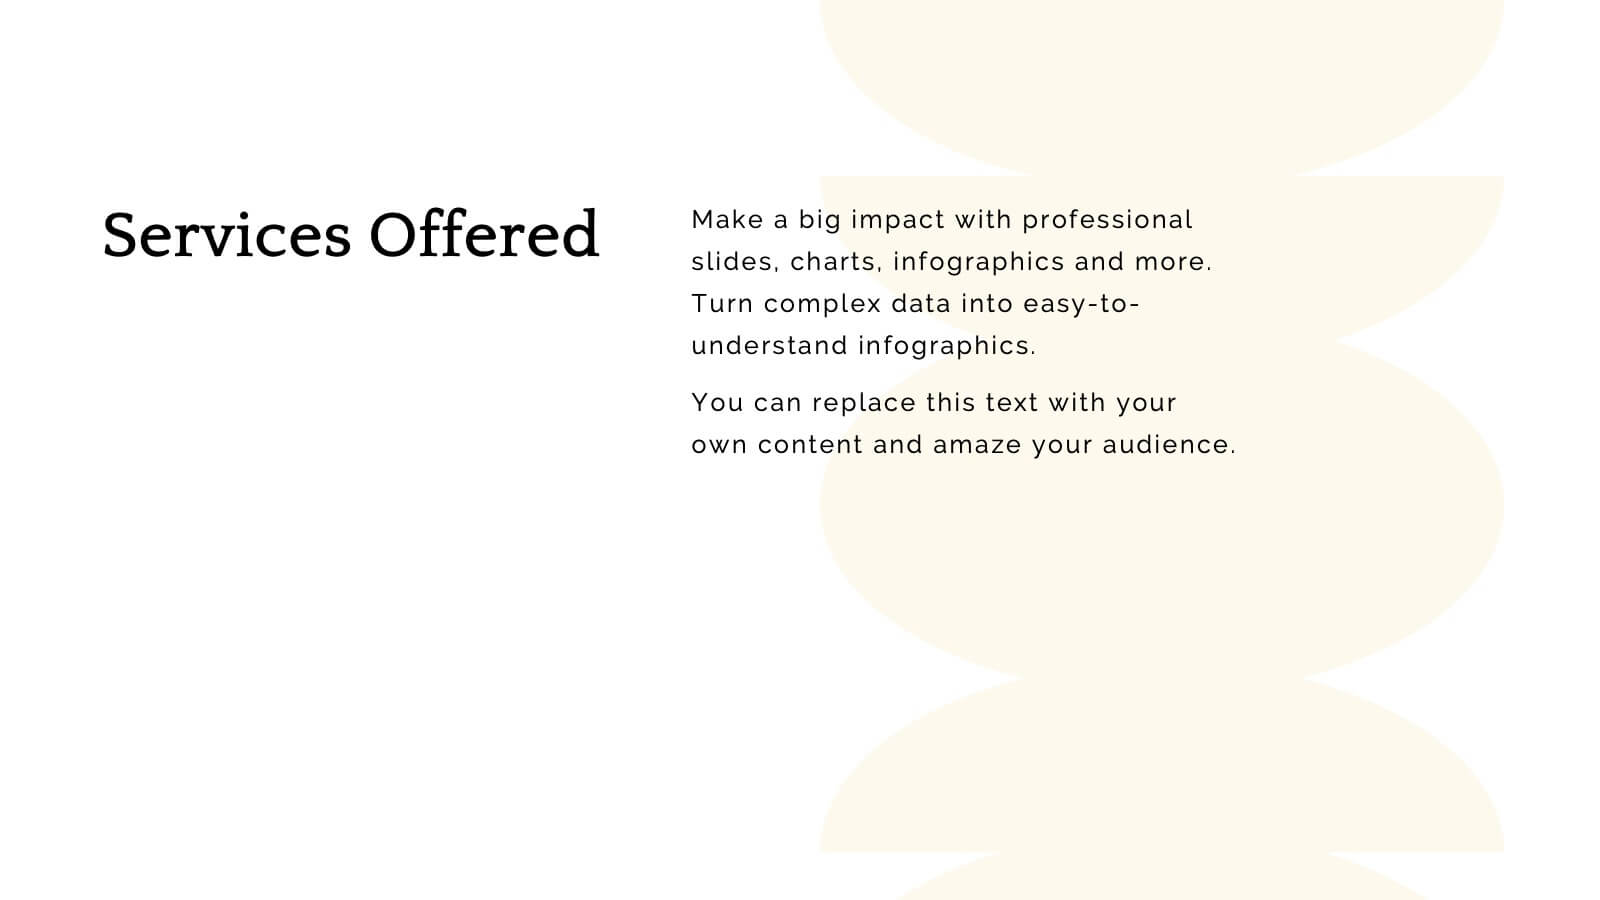
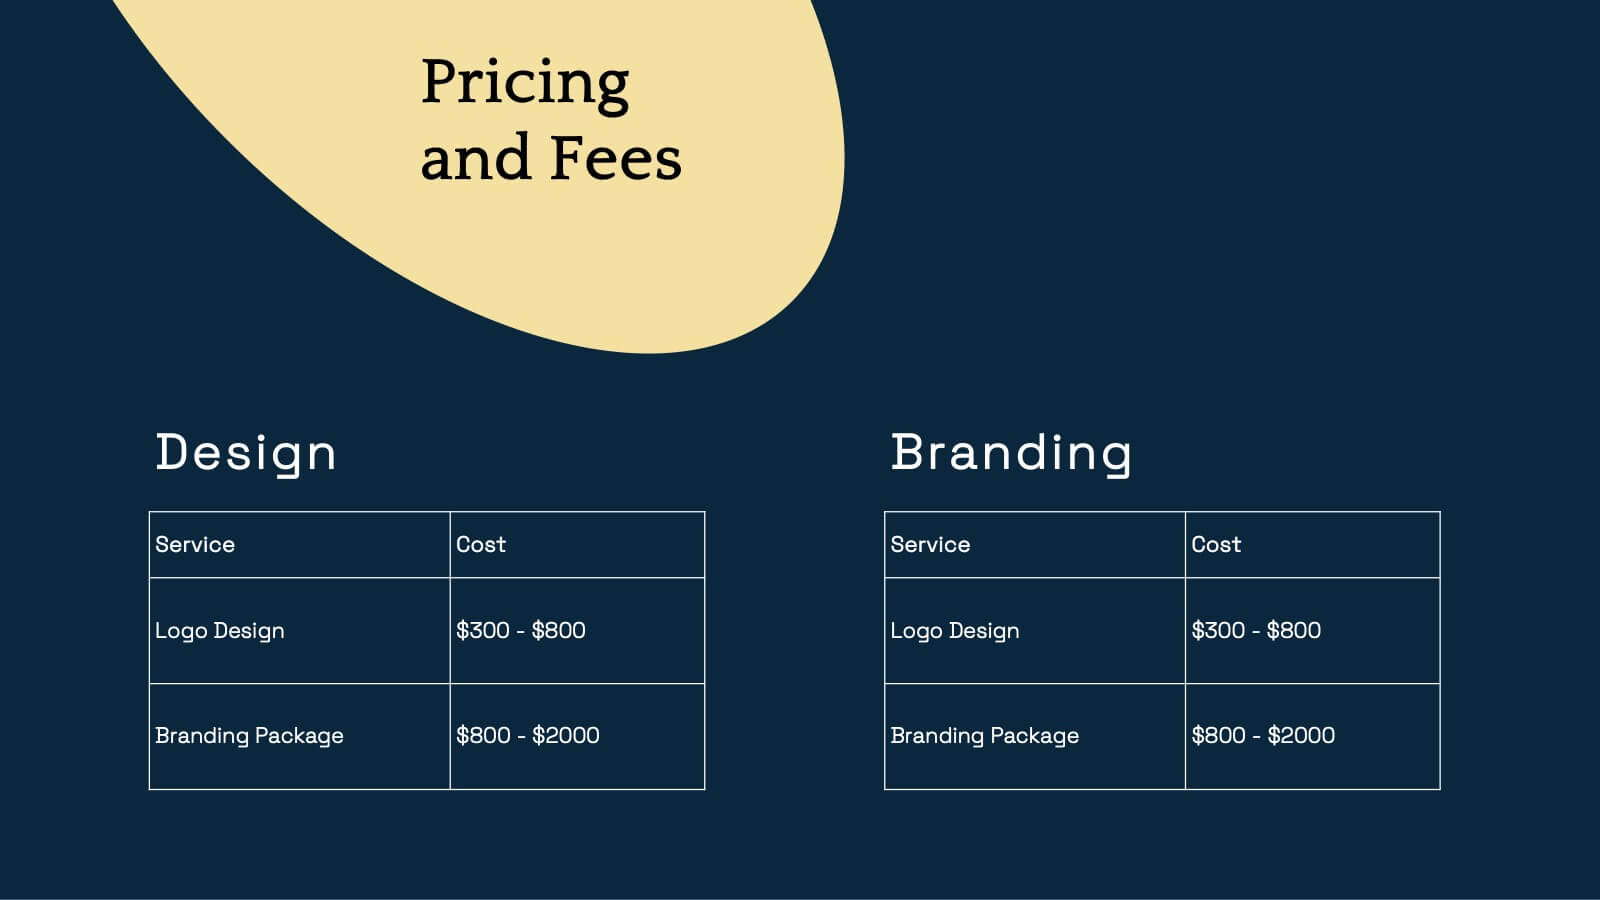
Flare Creative Portfolio Presentation
Showcase your creative work with this elegant portfolio template! Perfect for highlighting projects, client testimonials, and services offered. Ideal for artists, designers, and creatives aiming to impress clients and collaborators. Compatible with PowerPoint, Keynote, and Google Slides, this template ensures your portfolio is clear, professional, and visually stunning. Make your work shine!


5 slides
Contracts and Law Capacity Infographics
In the context of contracts and law, "capacity" refers to a person's legal ability to enter into a contract and be bound by its terms. These colorful infographics are designed to simplify the complex concepts of contracts and law capacity for the audience. This infographic template aims to provide essential information about the legal aspects of contracts and the concept of capacity in a visually appealing manner. This section provides a clear definition of contracts and highlights the essential elements. The template incorporates engaging infographics, icons, and illustrations to visualize key concepts and make the information more memorable.


21 slides
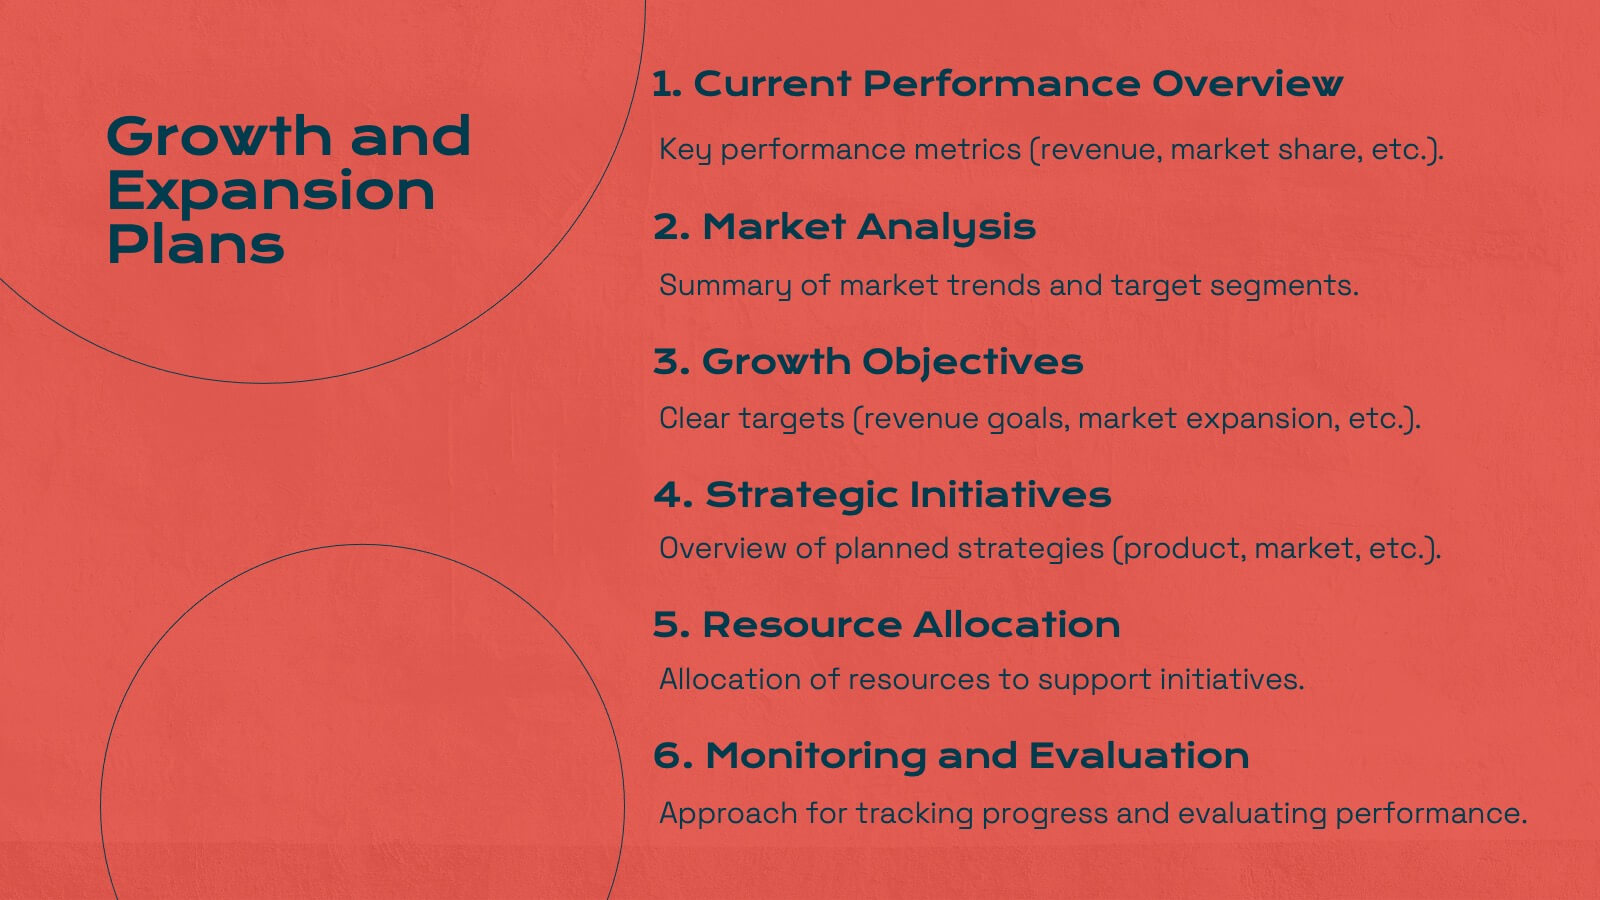
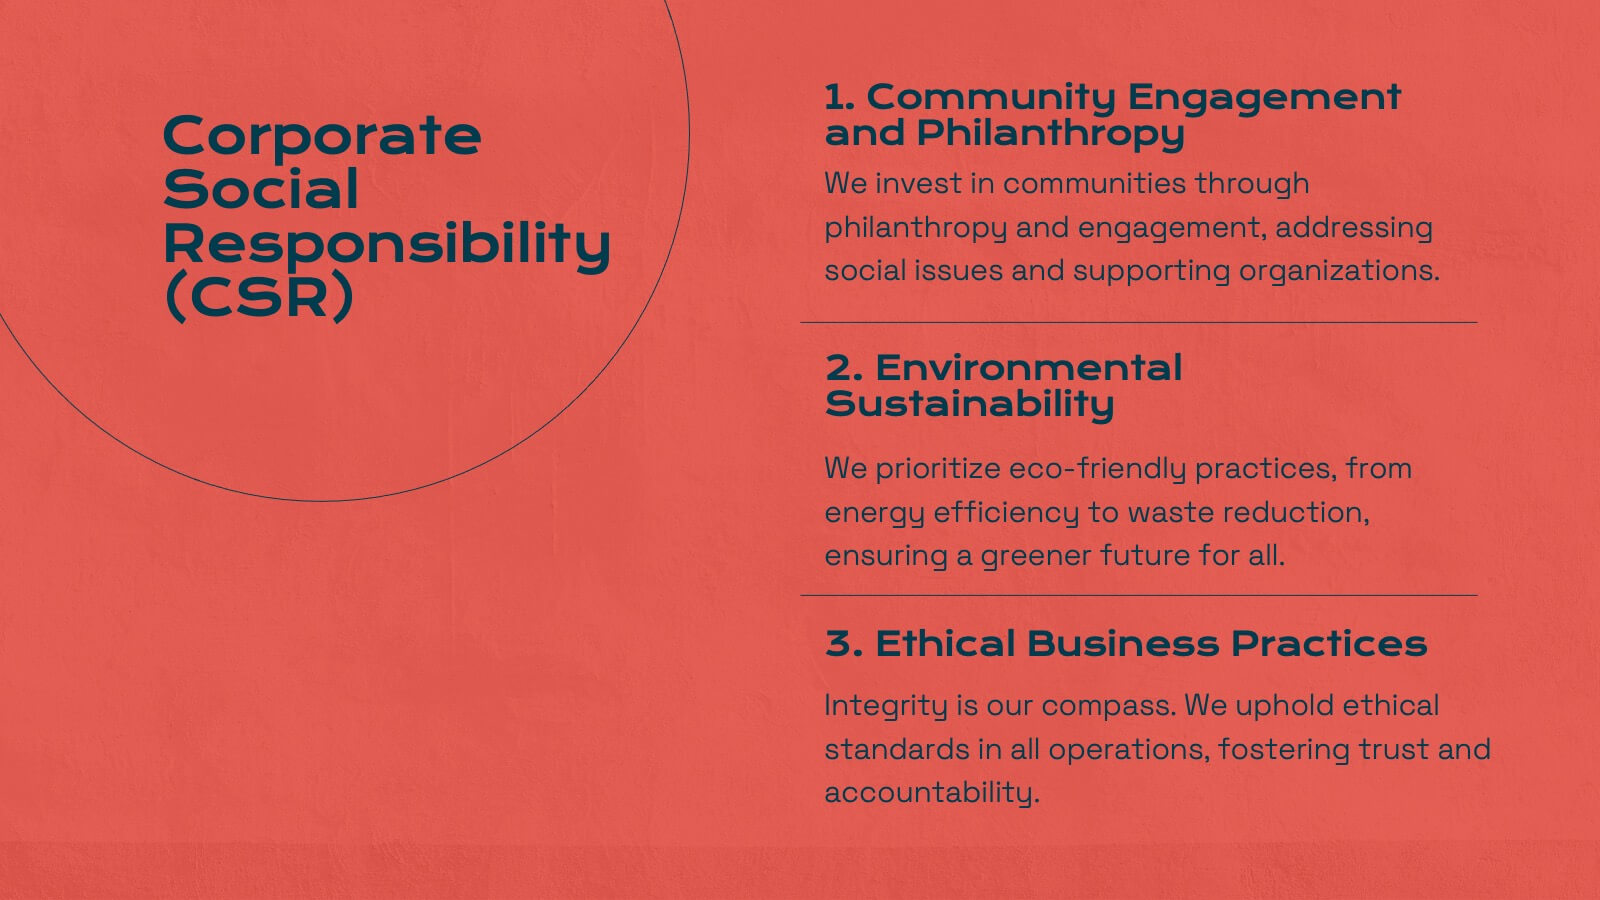
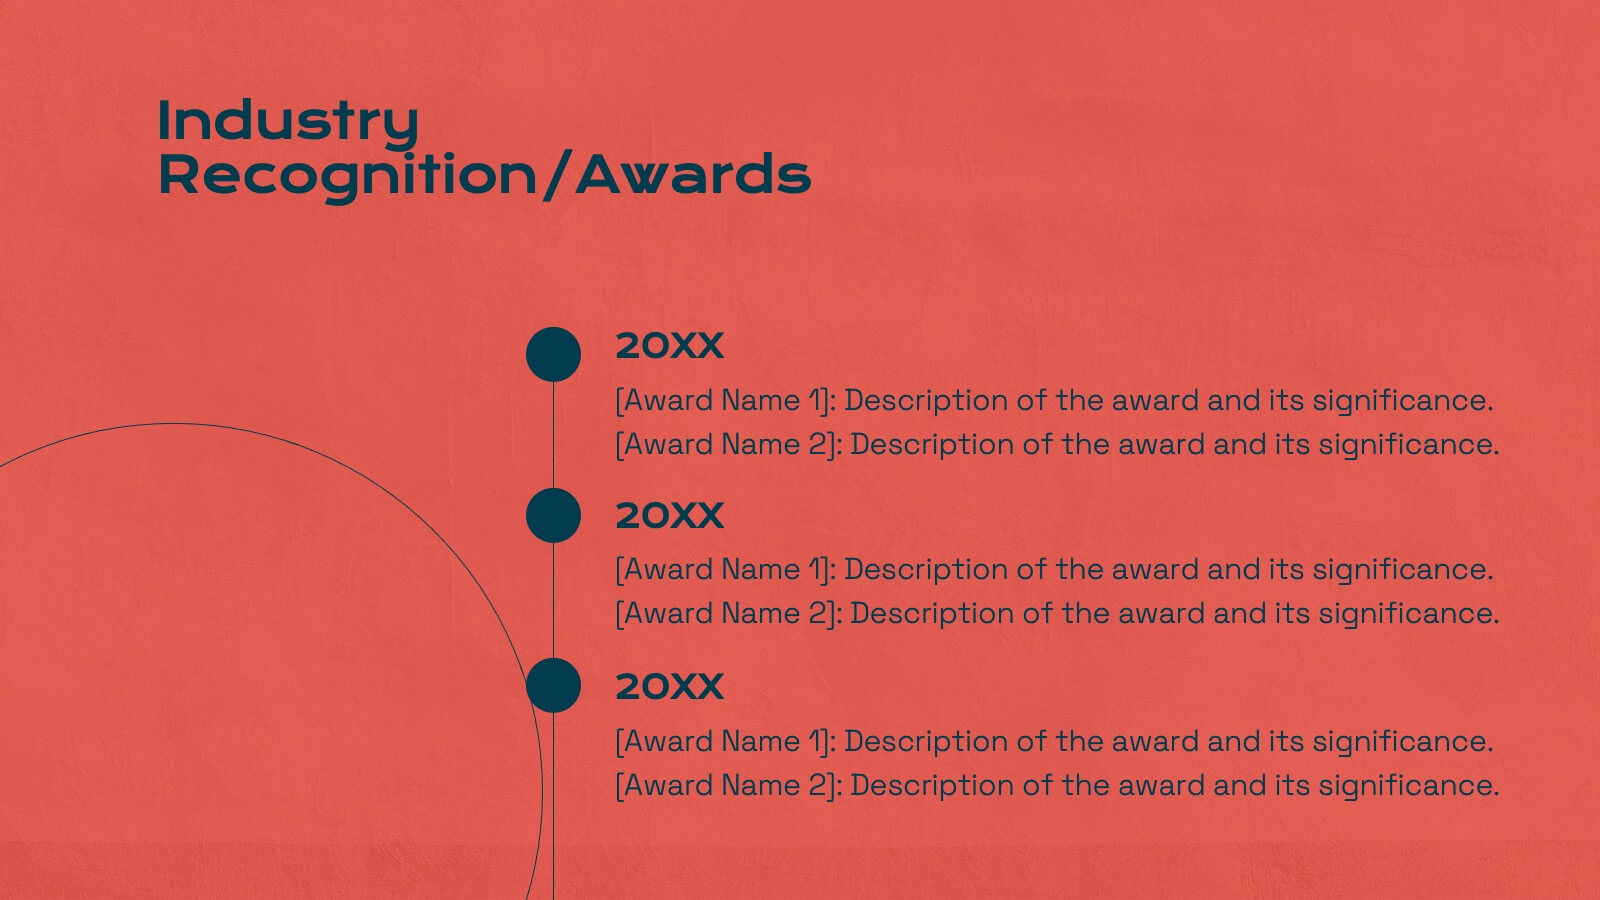
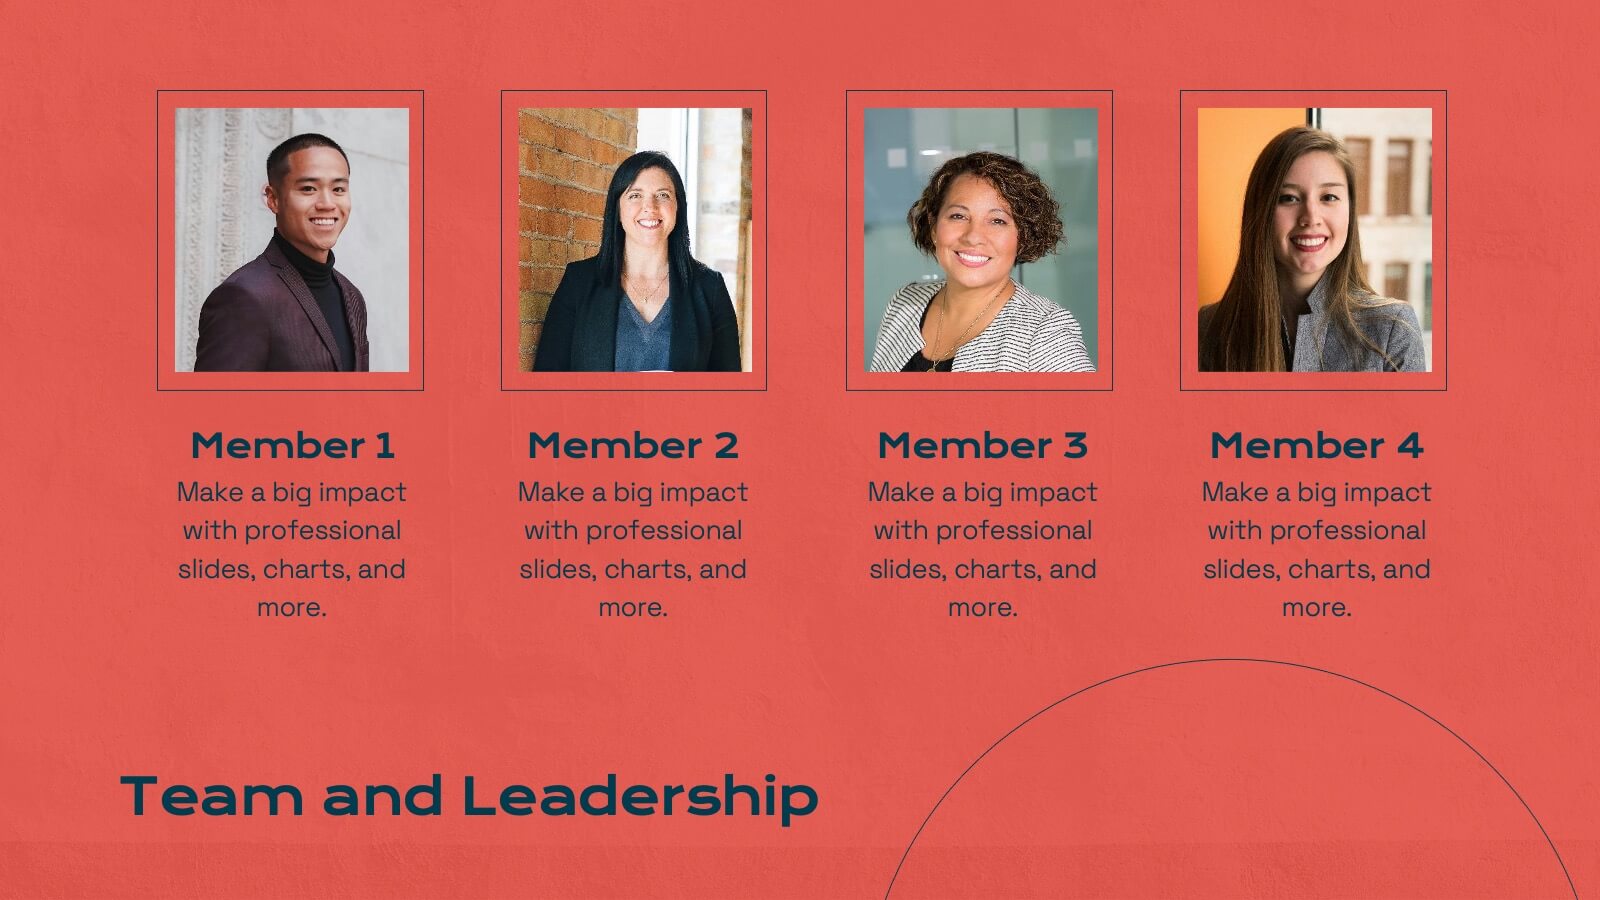
Titan Marketing Research Report Presentation
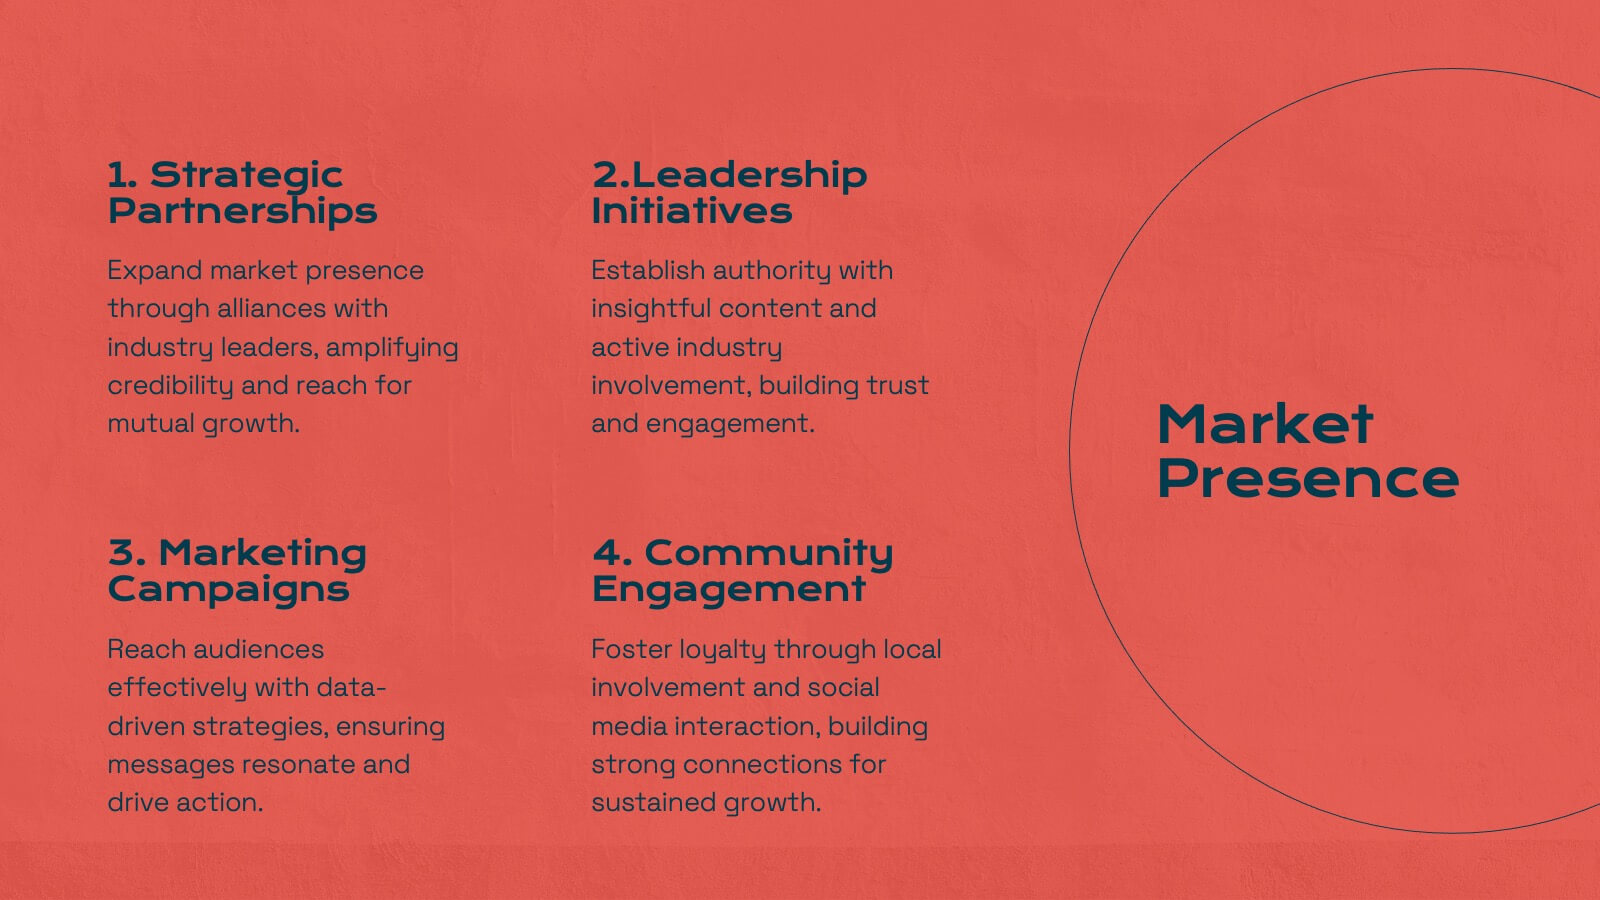
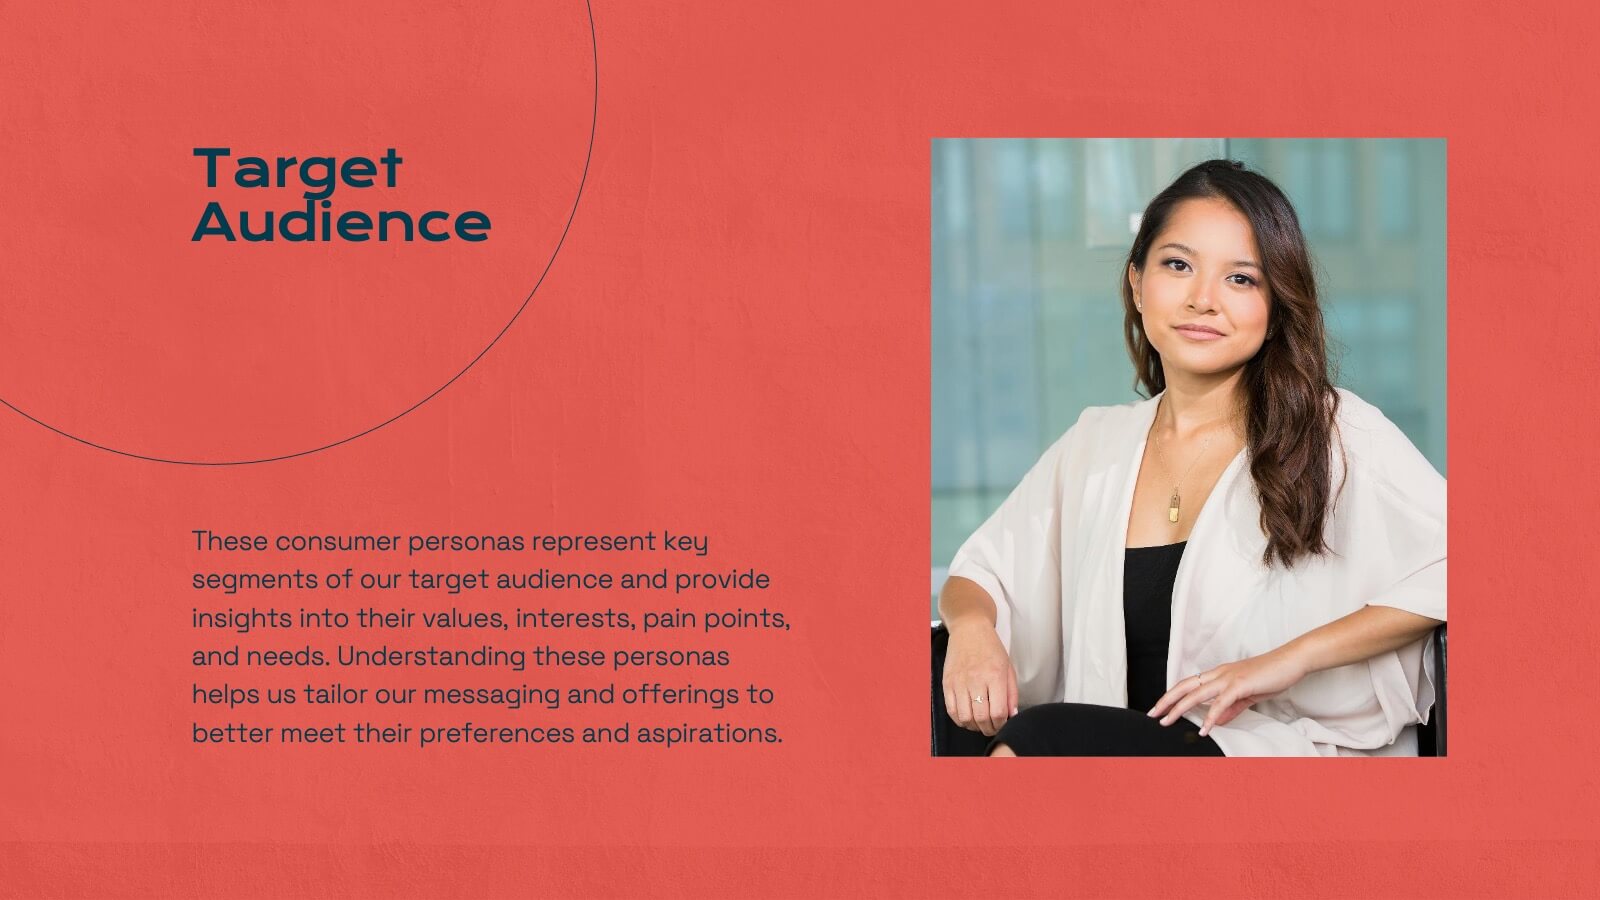
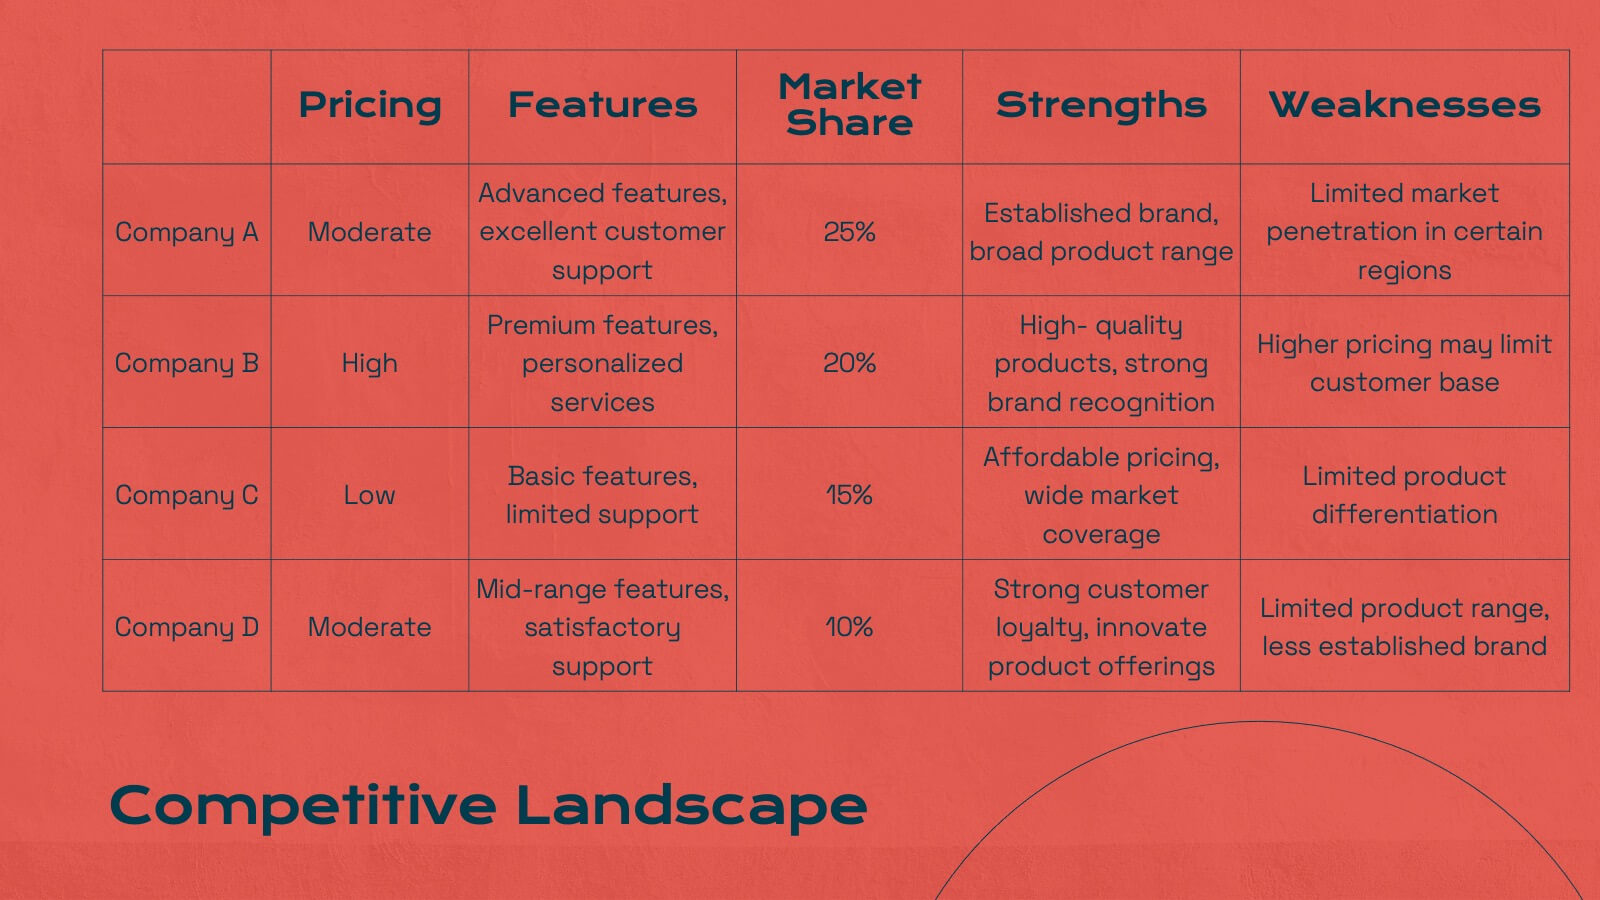
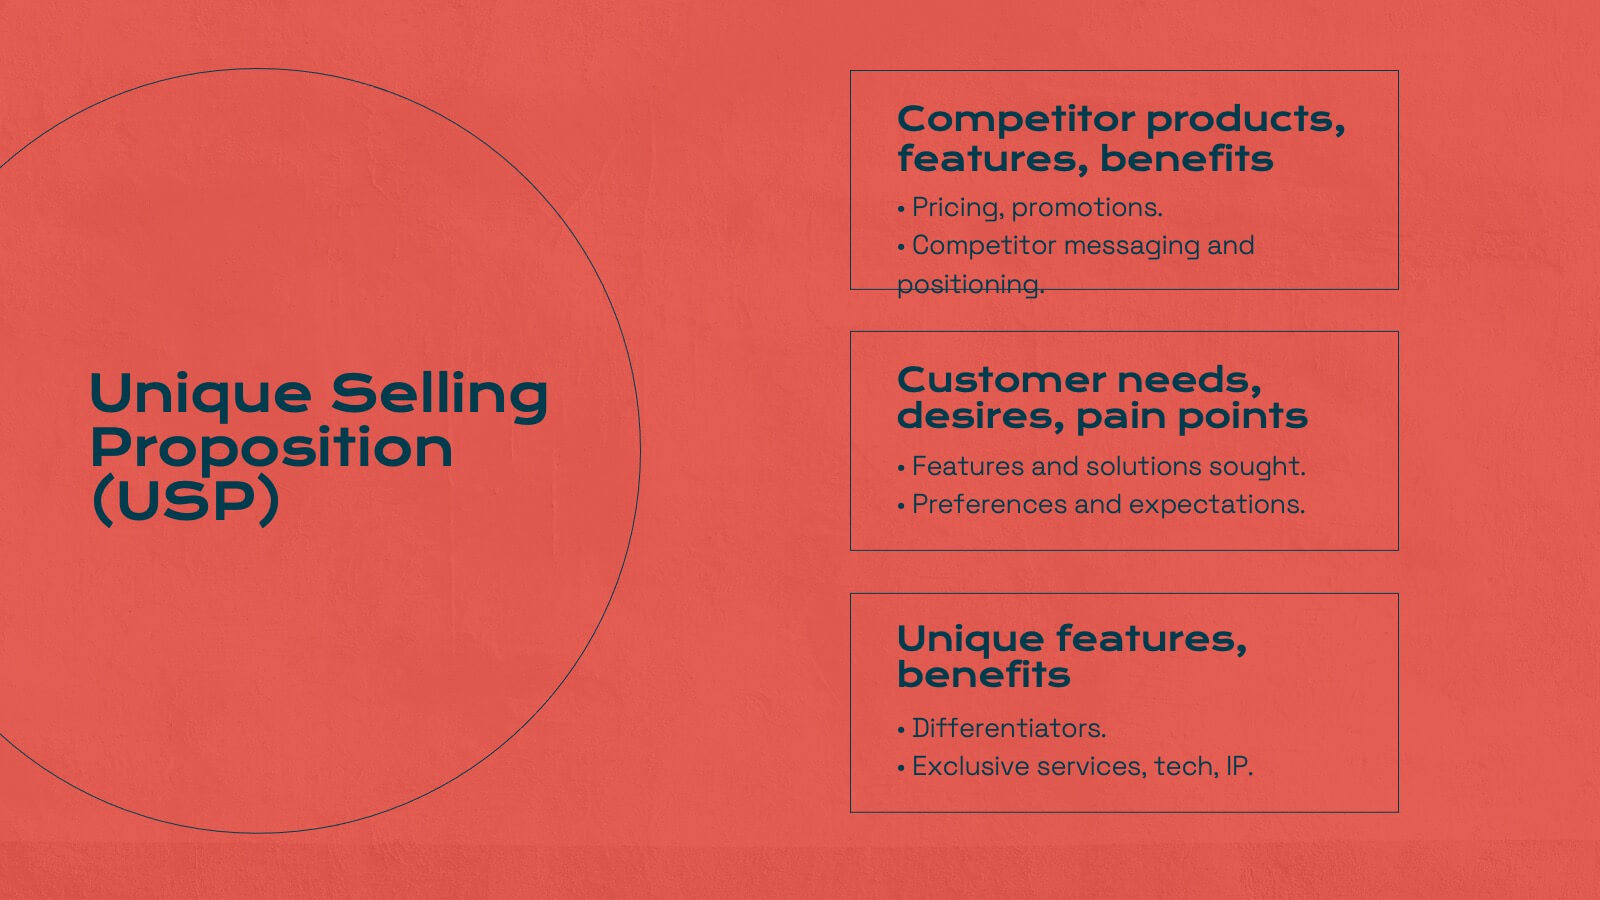
Energize your marketing research presentations with this bold, vibrant template. Perfect for detailing company history, market presence, and competitive landscapes, it features a striking red design that captures attention. Highlight key insights like target audience, financial highlights, and growth plans to engage your audience. Compatible with PowerPoint, Keynote, and Google Slides, it ensures seamless presentations on any platform.


5 slides
Financial Goals Infographics
Financial Goals are essential for creating a roadmap towards a secure financial future. This vertical infographic template is designed to illustrates goals, progress, and performance of financial investments. This is a perfect tool to help businesses, investors, and financial advisors communicate complex financial data in a simple and easy-to-understand way. It includes colorful illustrations and icons with text boxes that can show financial growth and progress. There are also sections for your investment strategies and financial metrics. You can fully customize this template to suit your specific needs.


4 slides
Top Priorities and Checklist Format Presentation
Stay focused and aligned with the Top Priorities and Checklist Format Presentation. This clear, checklist-based design is ideal for highlighting action items, goals, or key project deliverables. Visually guide your team with structured sections and a checklist illustration that reinforces accountability. Fully editable in PowerPoint, Keynote, and Google Slides.


12 slides
Corporate Sustainability Strategy Presentation
Achieve your sustainability goals with the Corporate Sustainability Strategy Presentation template. This modern, visually engaging layout helps businesses showcase their environmental, social, and governance (ESG) initiatives, sustainability roadmaps, and corporate responsibility plans. Featuring clear, structured sections, this fully customizable design is perfect for corporate leaders, consultants, and eco-conscious organizations. Compatible with PowerPoint, Keynote, and Google Slides for effortless editing and presentation.
21 slides
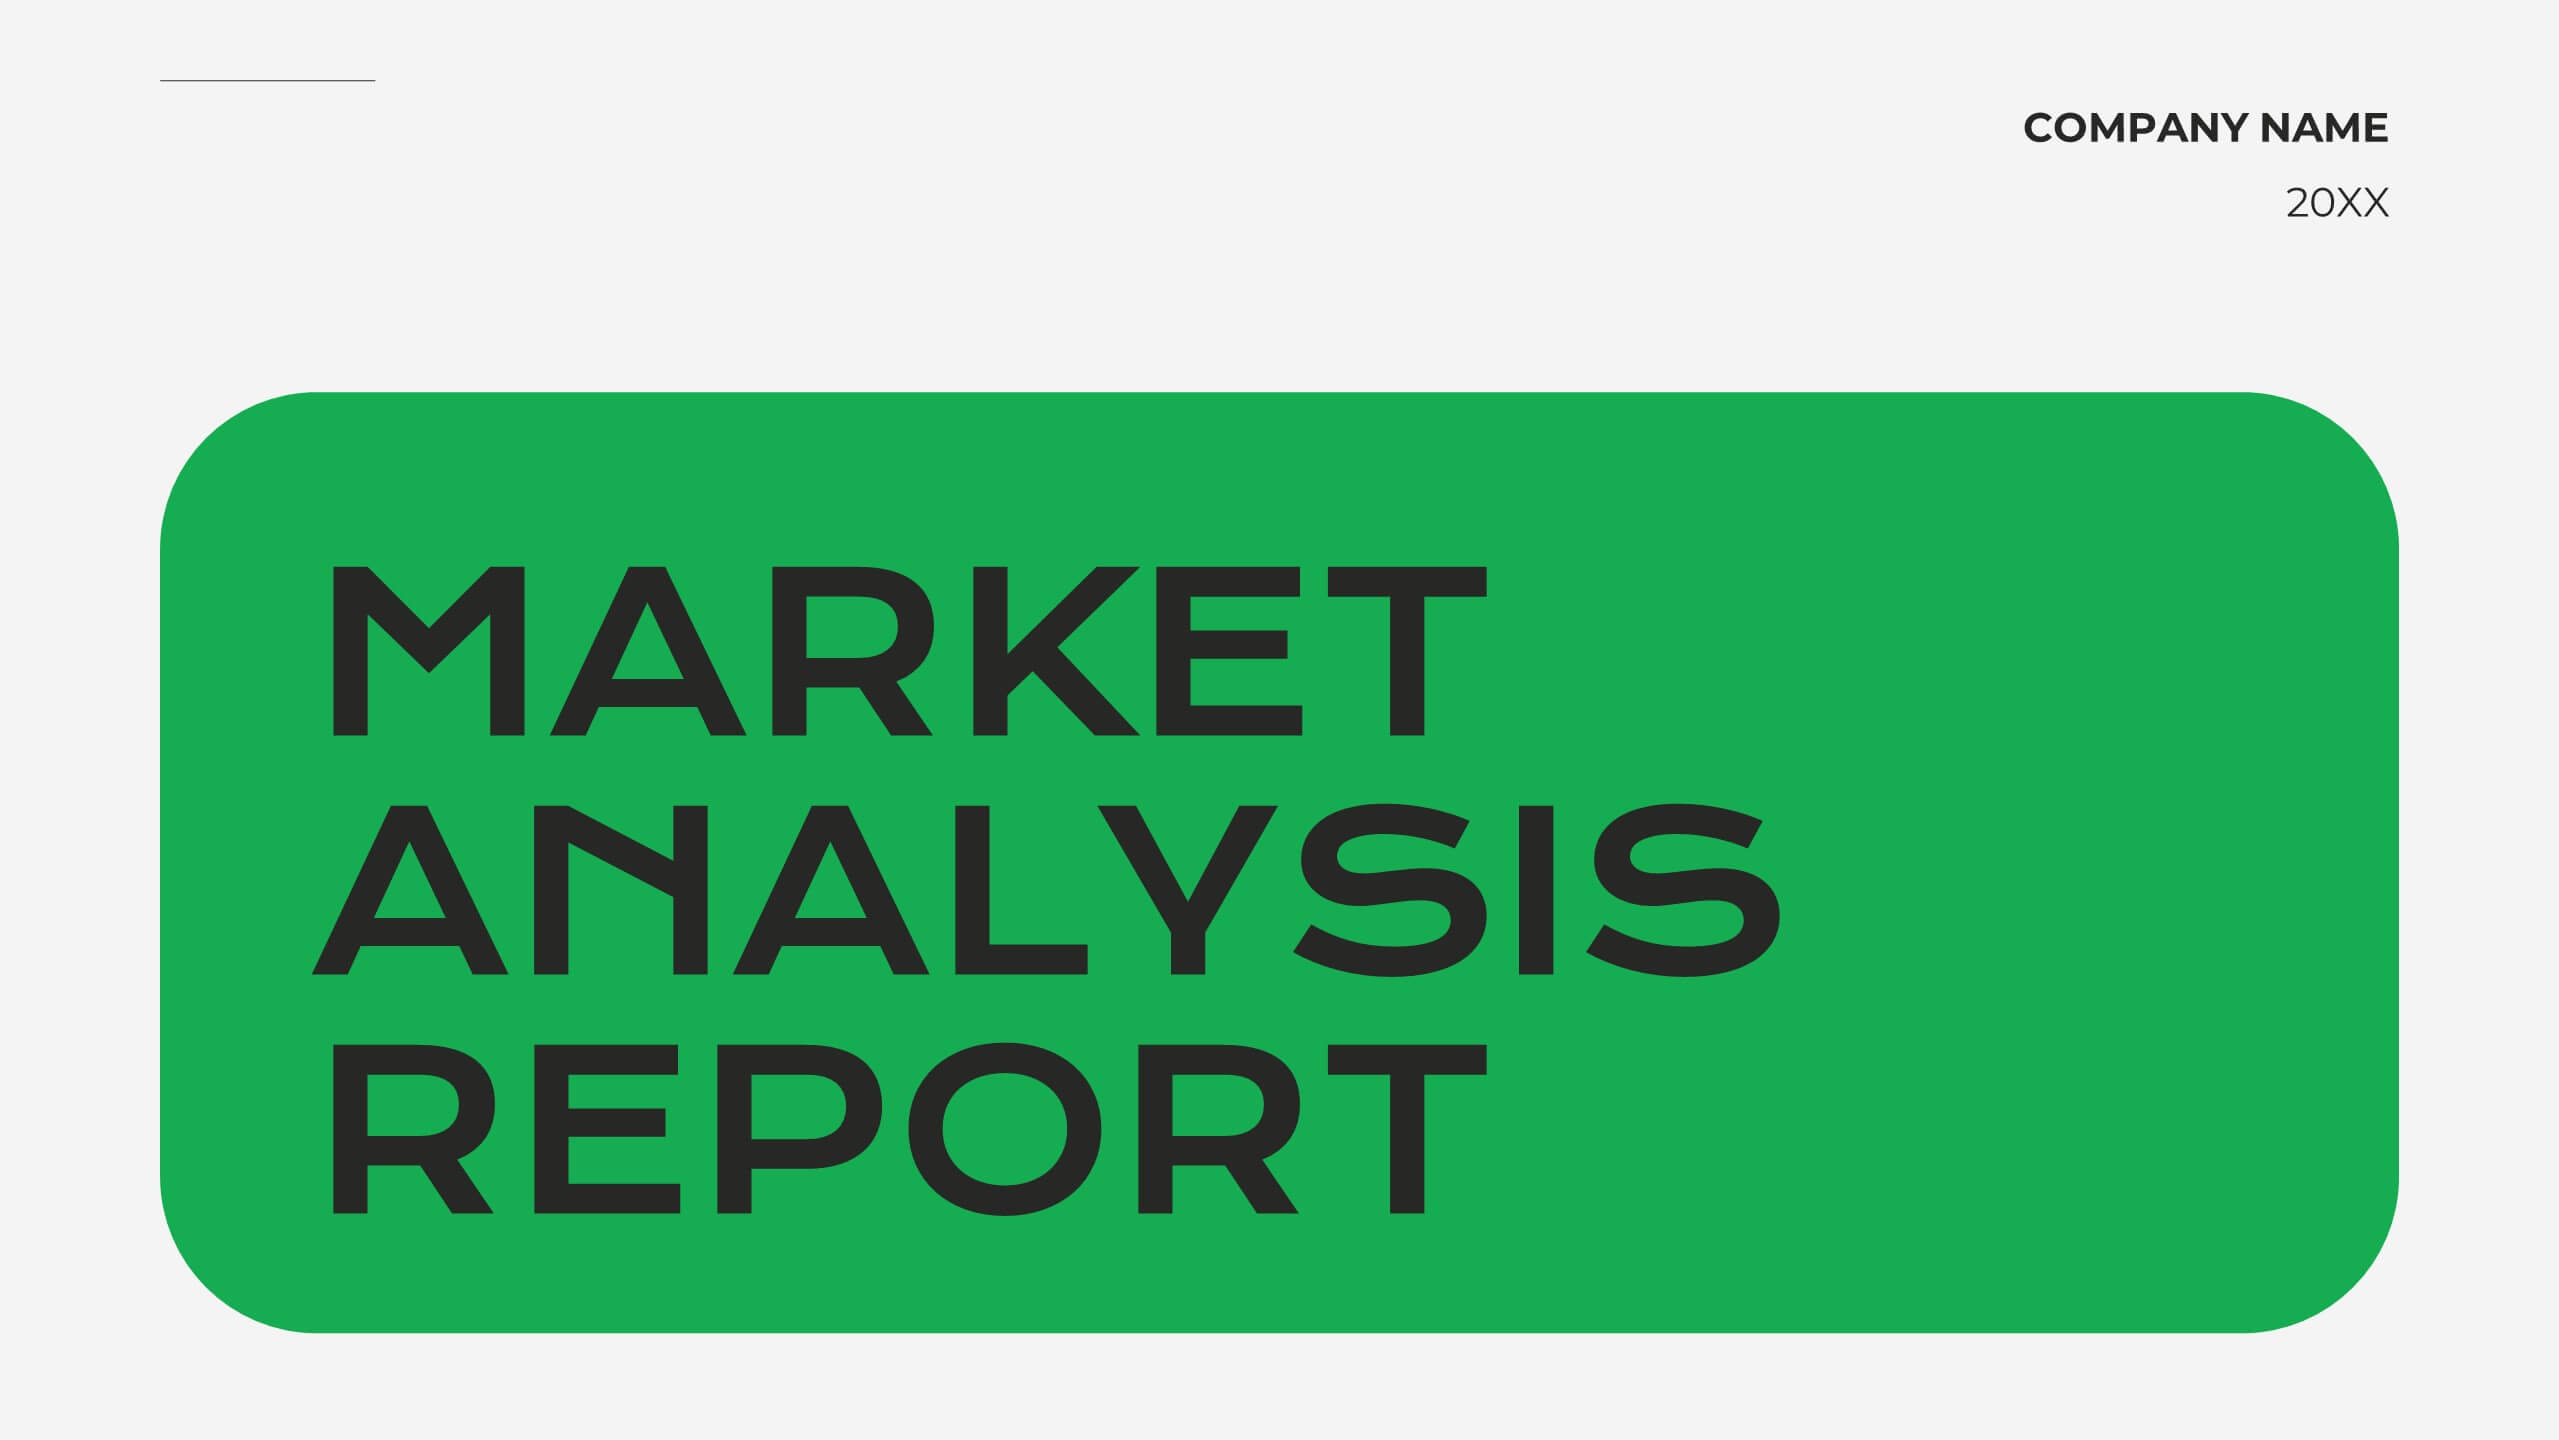
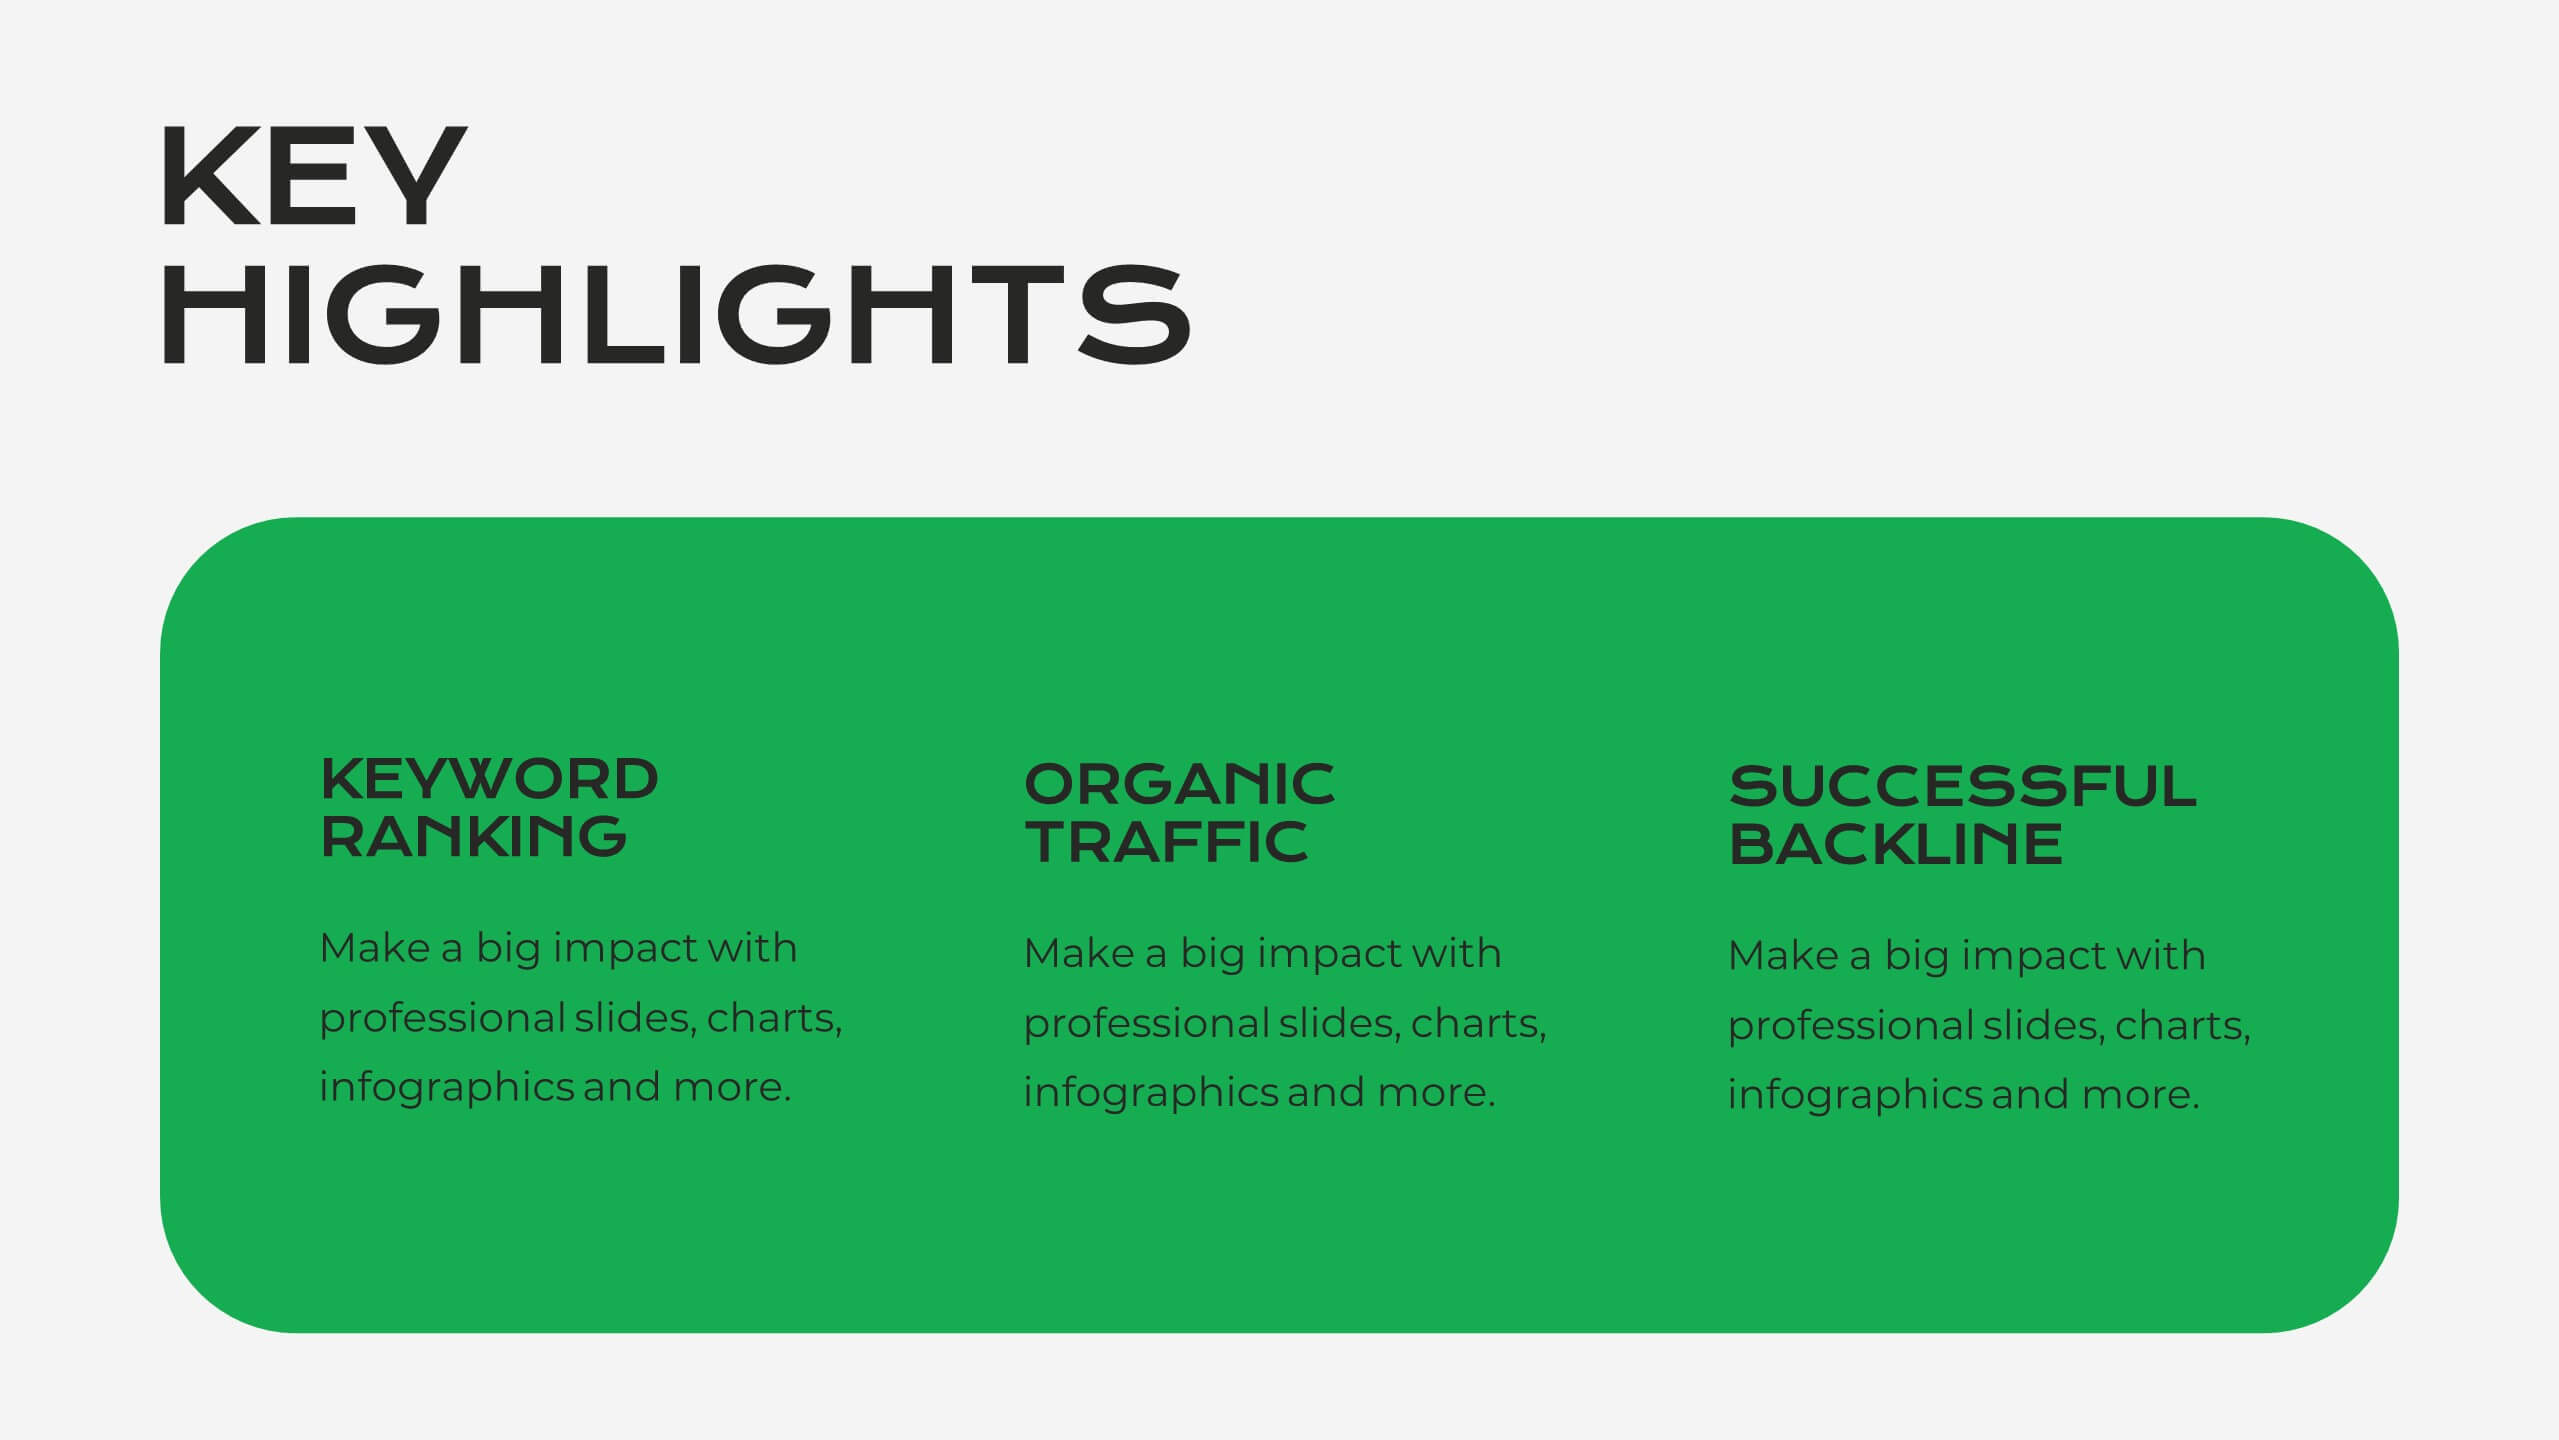
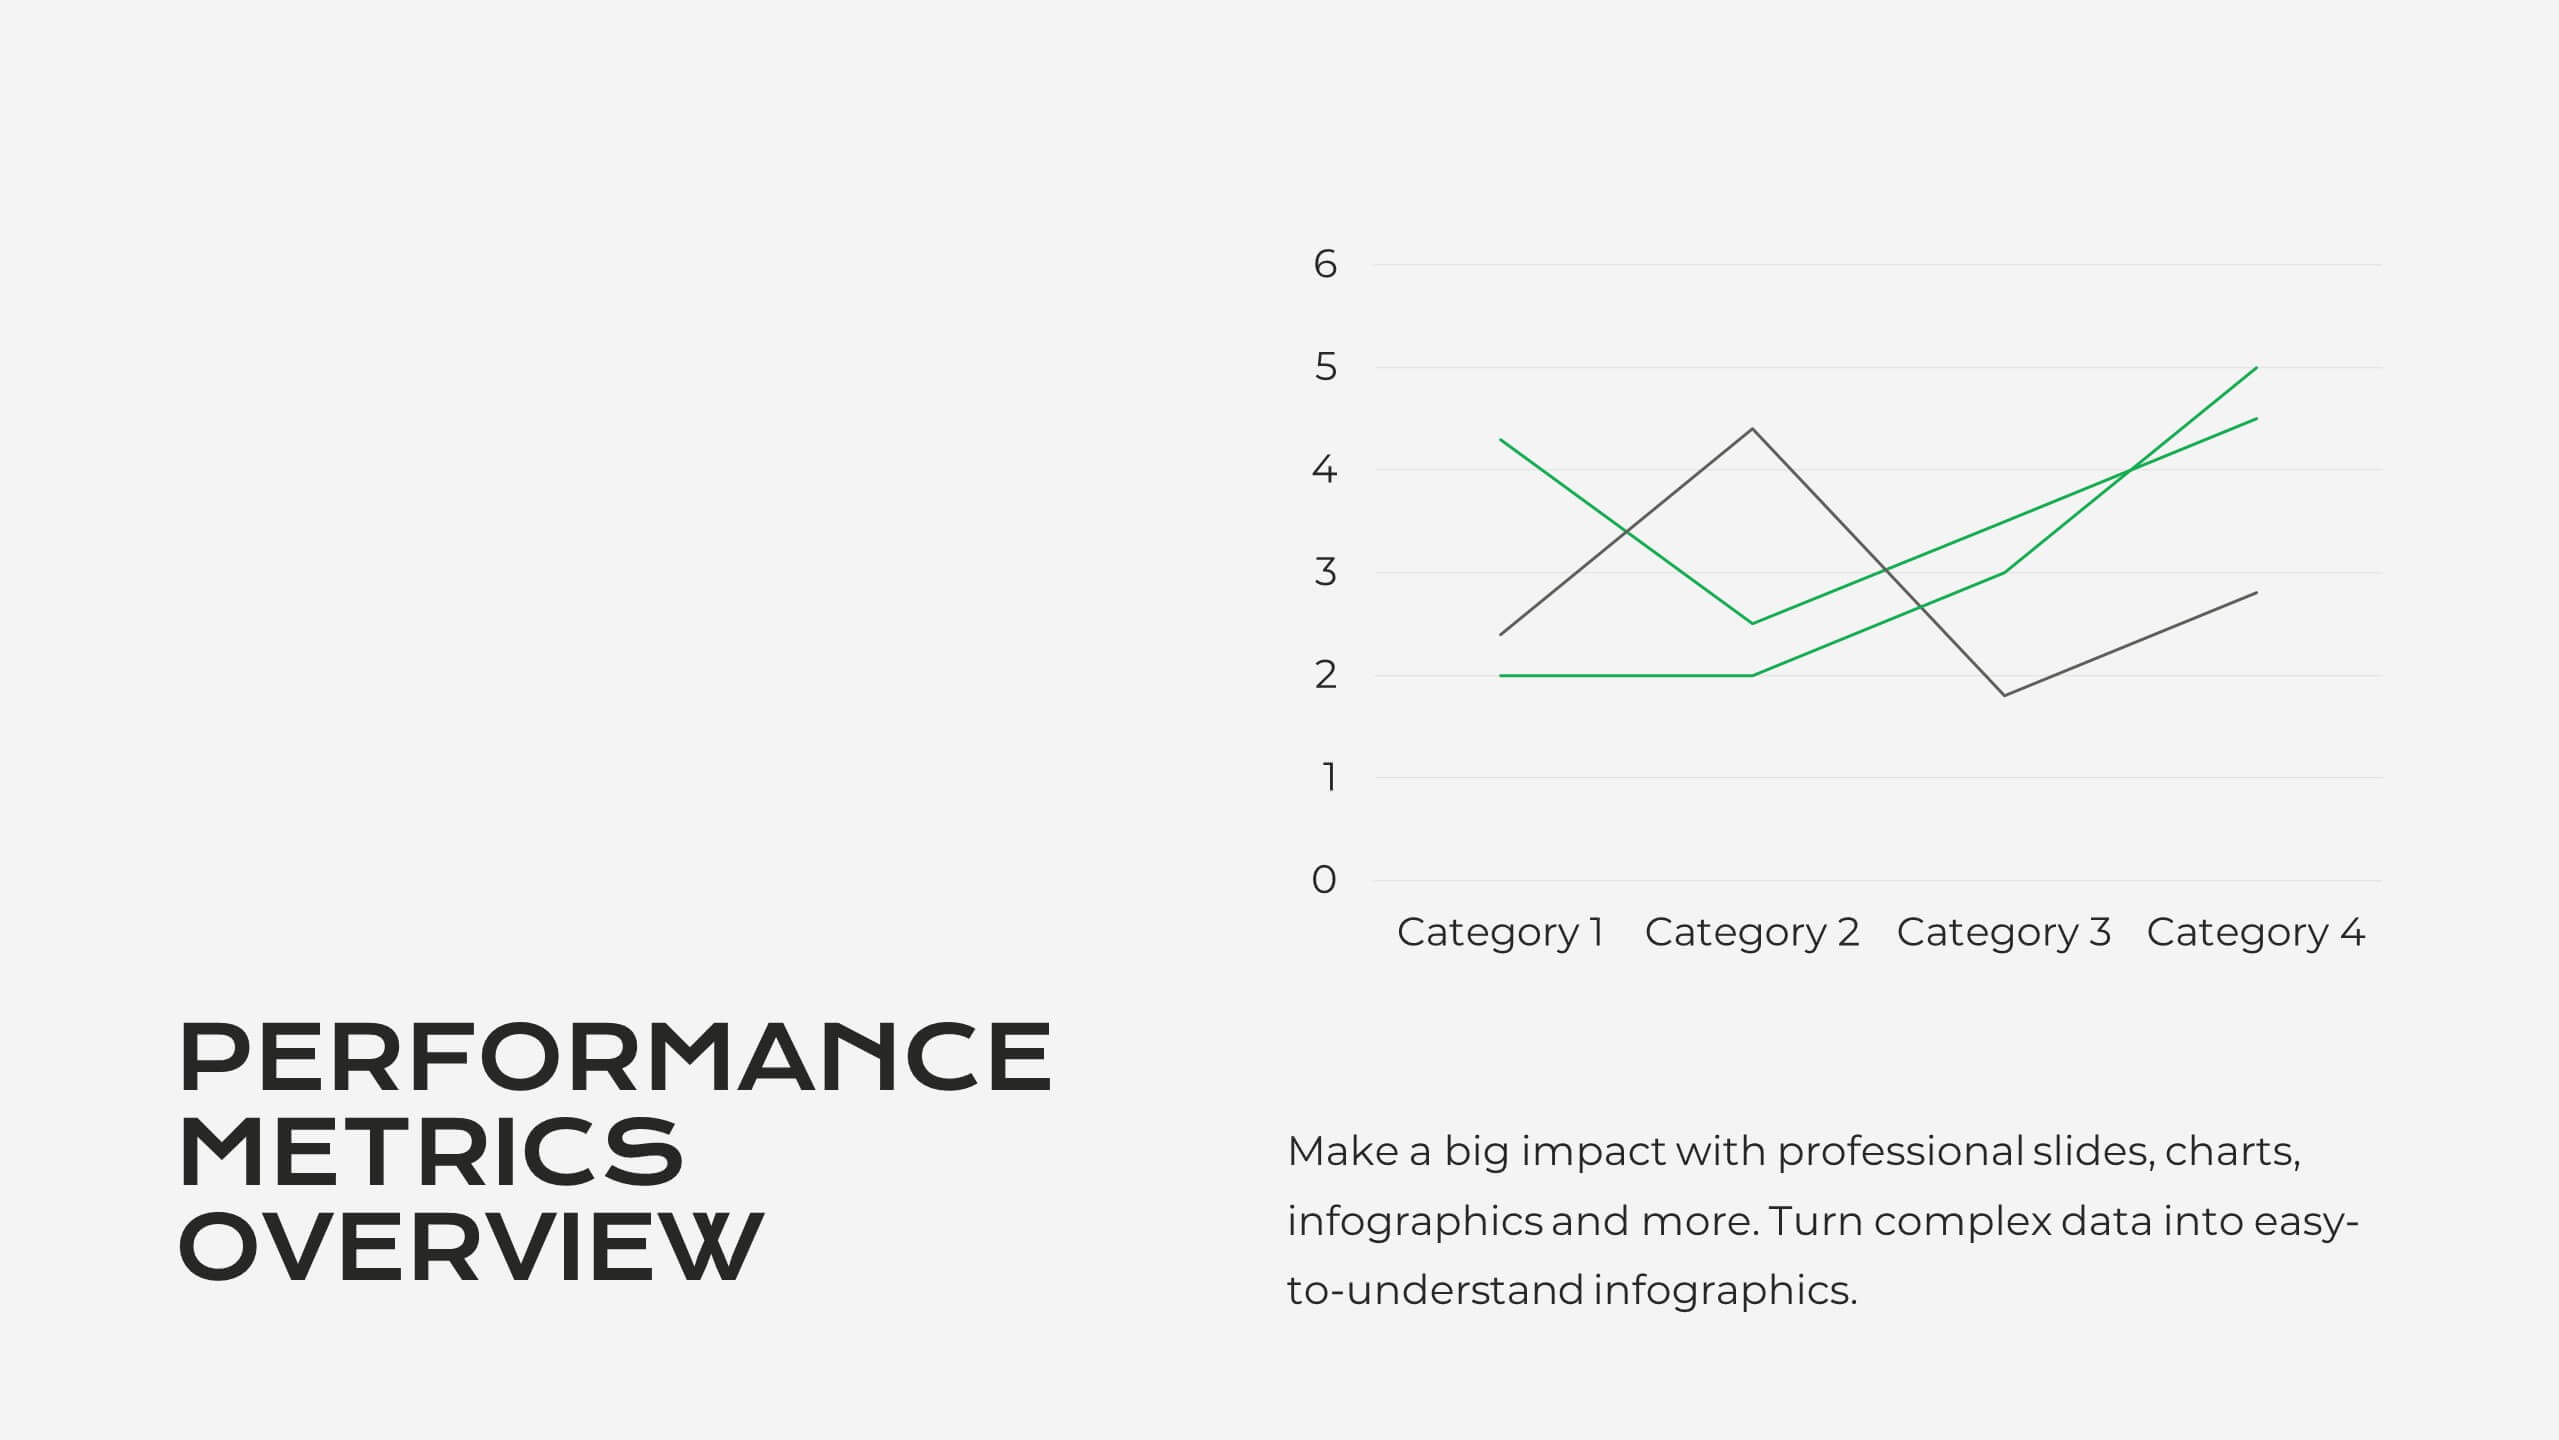
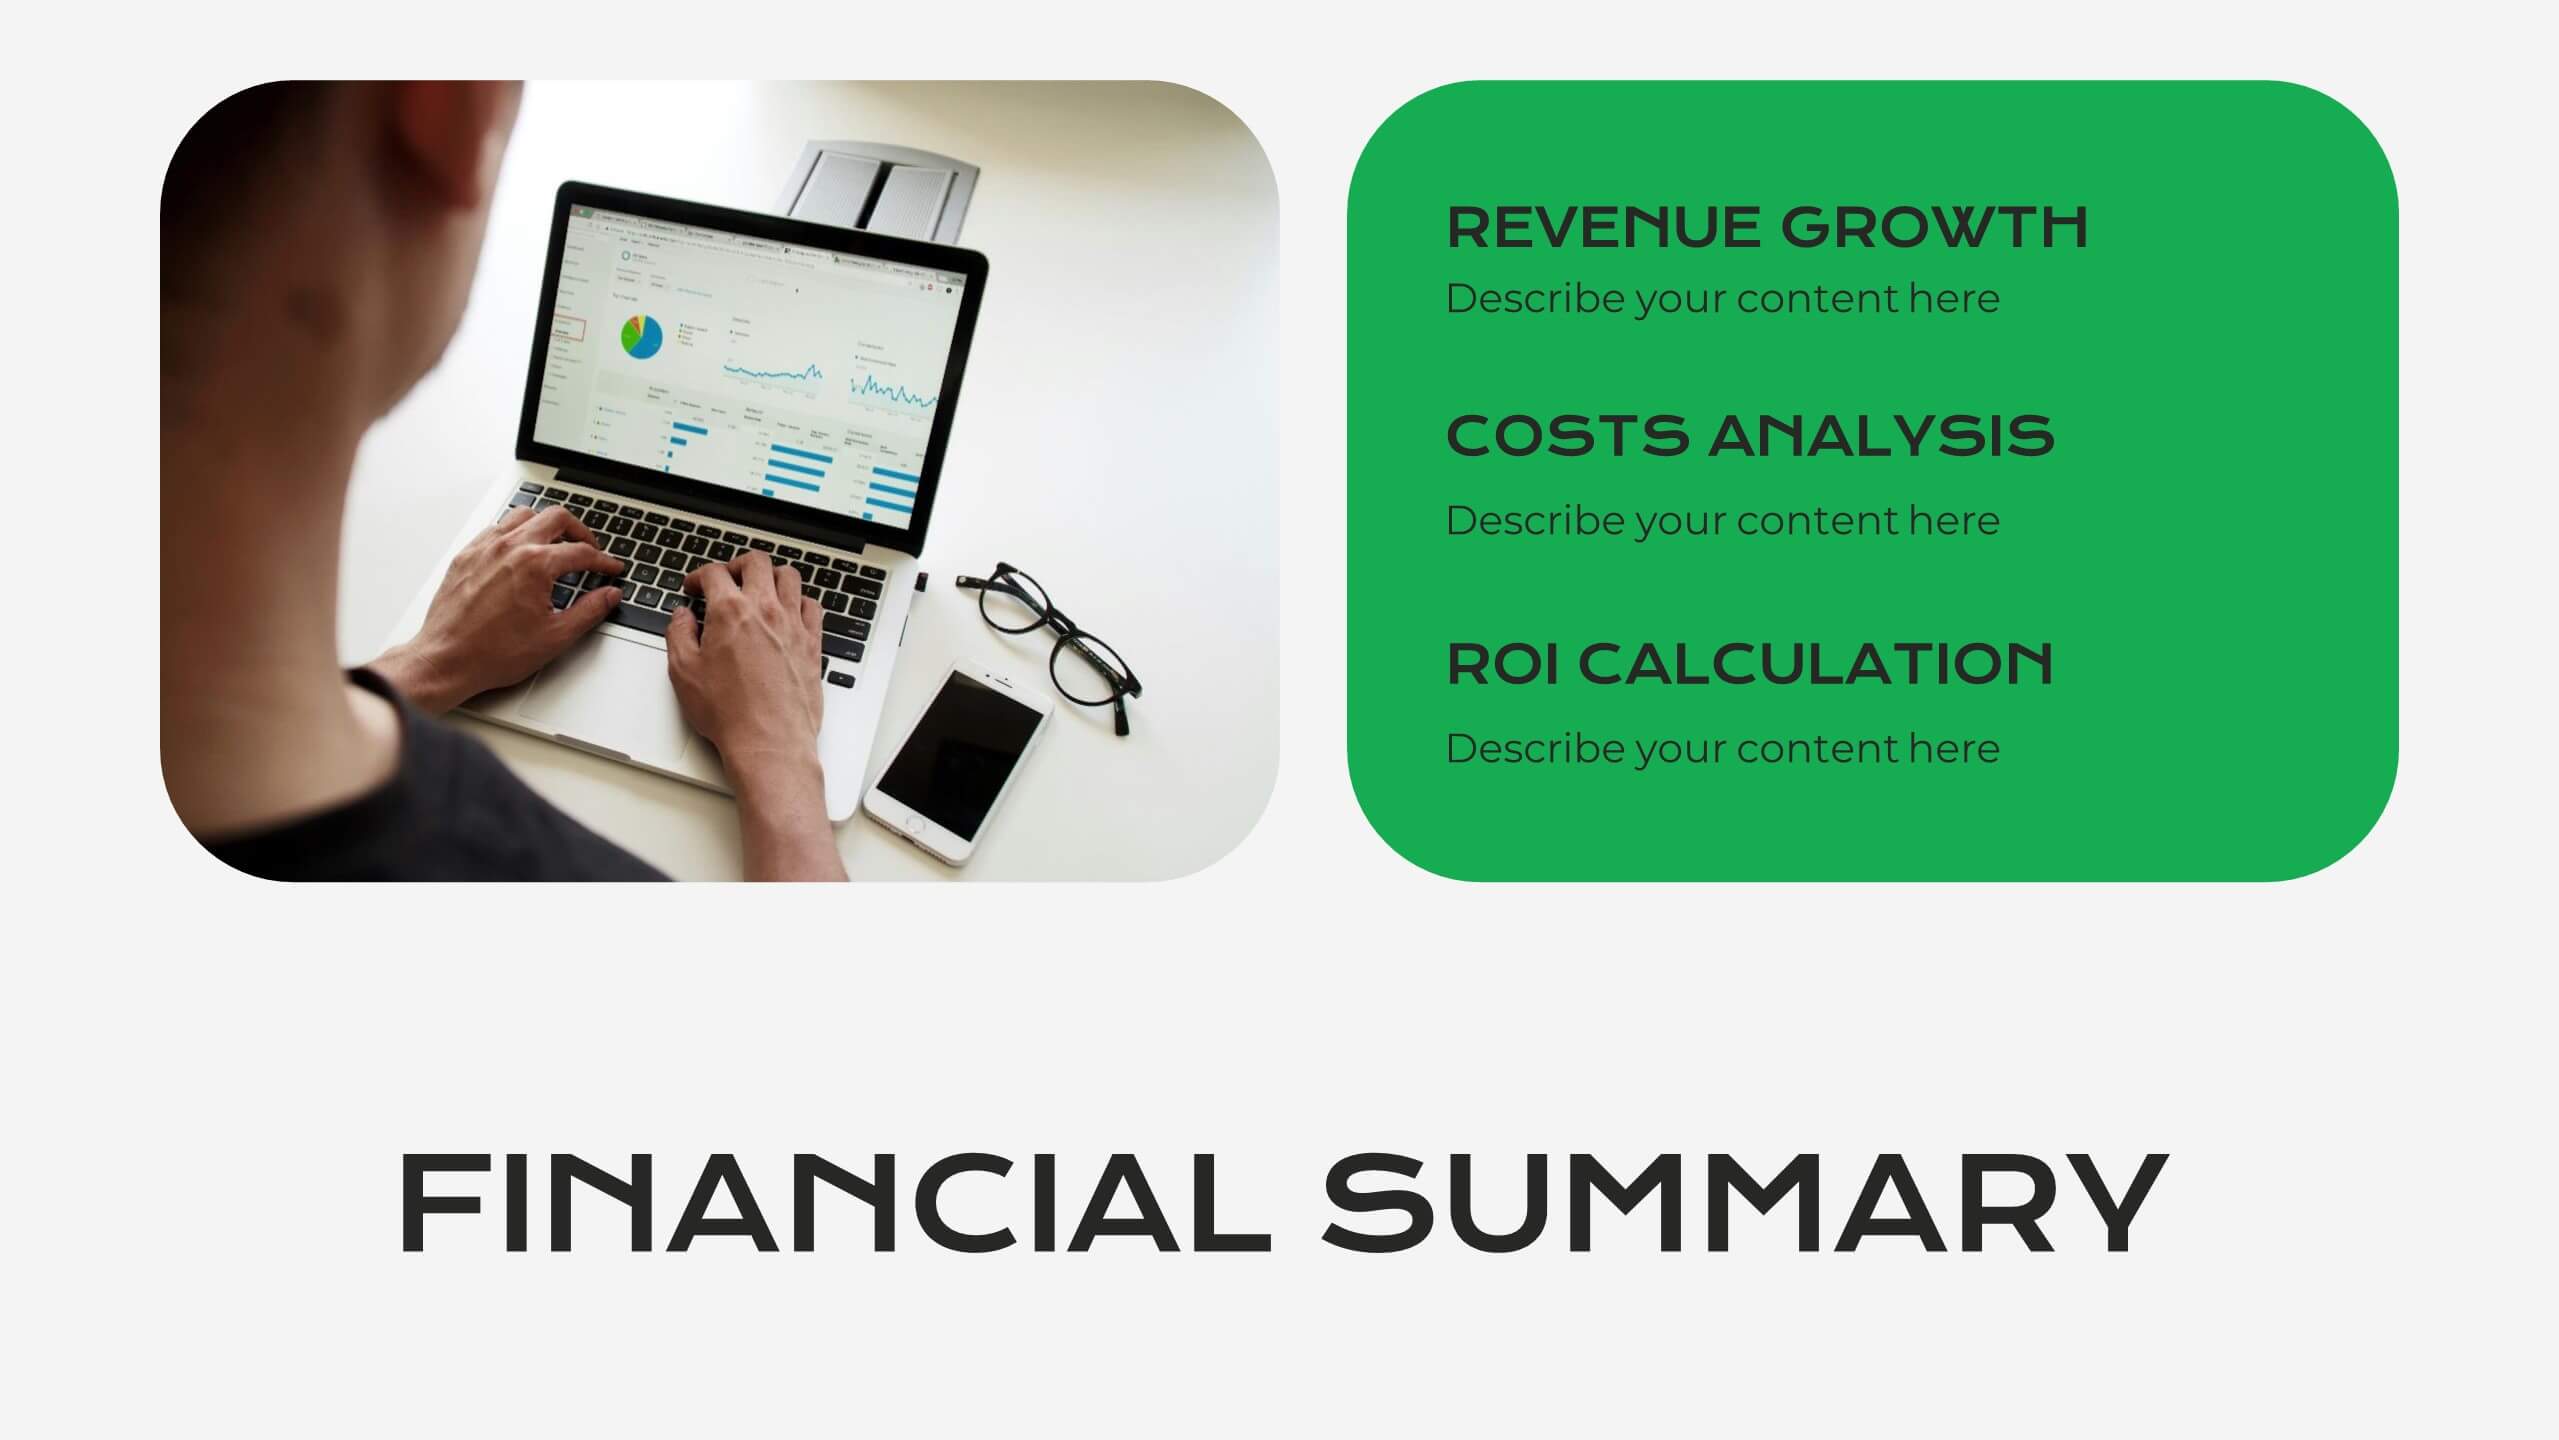
Serene Market Analysis Report Presentation
This modern and clean Market Analysis Report template is designed to help you present key data and insights with clarity and impact. Ideal for business professionals and analysts, it includes slides for key highlights, performance metrics, financial summaries, competitor insights, and strategic initiatives. The template's sleek layout ensures that your data is easy to understand and visually appealing, making it perfect for internal reports or client presentations. Customize it effortlessly in PowerPoint, Keynote, or Google Slides, and impress your audience with a polished and professional report.


5 slides
Personal SWOT Infographics
Embark on a journey of self-discovery and professional development with our personal SWOT infographics template. Rendered in a palette that combines the tranquility of blue, the growth associated with green, and the innovative spirit of purple, this resource is a catalyst for introspection. Whether you're a career coach or individual standing at a crossroads, these vertical, creatively informative graphics illuminate strengths, weaknesses, opportunities, and threats in a visually compelling spectrum. Compatible with Powerpoint, Keynote, and Google Slides. The inclusion of intuitive icons and adaptable image placeholders simplifies complex introspection.