


Features
- 4 Unique slides
- Fully editable and easy to edit in Microsoft Powerpoint, Keynote and Google Slides
- 16:9 widescreen layout
- Clean and professional designs
- Export to JPG, PDF or send by email


Do you have any questions?
Recommend


4 slides
Report Recap and Summary Section Presentation
Summarize key takeaways clearly with this Report Recap and Summary Section slide. Featuring a step-by-step horizontal layout with bold numbering, icons, and text boxes, this design helps emphasize three main points or stages in your report. Ideal for executive briefs or performance reviews. Fully editable in Canva, PowerPoint, or Google Slides.


5 slides
Financial and Growth Statistics
Present financial insights and growth metrics with impact using this visually engaging infographic. Ideal for showcasing revenue performance, profit trends, or investment results, this template keeps data clear and actionable. Fully customizable in PowerPoint, Keynote, and Google Slides to match your brand and strategy needs.


6 slides
Business Decision Flow Model Presentation
Make smarter choices with this Business Decision Flow Model presentation. Clearly map out key decisions, steps, and potential outcomes using a structured, color-coded flow. Perfect for strategy reviews, team meetings, and executive briefings. Fully editable in Canva, PowerPoint, and Google Slides for seamless customization.


10 slides
Risk Evaluation and Control Measures Presentation
Showcase your strategy for minimizing business risks with the Risk Evaluation and Control Measures Presentation. This upward arrow layout helps illustrate progressive risk management stages—from identification to control. Ideal for business continuity plans, audits, and compliance reporting. Fully customizable in Canva, PowerPoint, Keynote, and Google Slides.


7 slides
Advanced Education Infographics
The "Advanced Education" infographic template is a sophisticated and visually engaging resource, designed meticulously for PowerPoint, Keynote, and Google Slides. This template is an invaluable tool for educators, administrators, and policy makers aiming to present complex educational frameworks, advanced curriculum details, and innovative learning methodologies. The template expertly encapsulates the essence of advanced education, highlighting specialized programs, cutting-edge research opportunities, and pathways for academic excellence. It's organized to showcase the breadth and depth of advanced educational offerings, making it perfect for academic conferences, institutional presentations, or educational policy discussions. The design is as intellectually stimulating as the content it represents, with a color scheme that is both elegant and conducive to a learning environment. This not only enhances the visual appeal of the presentation but also aligns with the advanced and scholarly nature of the content. Whether used in a university setting, a professional development seminar, or a policy briefing, this template ensures that the value and intricacies of "Advanced Education" are communicated with sophistication, clarity, and visual impact.


20 slides
Spectrum Graphic Design Project Plan Presentation
The Graphic Design Project Plan Presentation Template includes 20 clean and modern slides, tailored for creative professionals. It guides you through key design stages like audience targeting, design brief, elements, moodboards, prototypes, and project timelines. Featuring bold typography, engaging visuals, and a sleek black-and-yellow color palette, this template ensures clarity and style. Compatible with PowerPoint, Keynote, and Google Slides, it's fully editable to fit any design project.


6 slides
Organizational Structure Infographic
Organizational structure refers to the way in which an organization is structured and how its roles, responsibilities, and functions are defined and coordinated. This infographic template provides a framework for how individuals and teams work together to achieve the organization's goals. This infographic visually represents the hierarchy, roles, and relationships within an organization. This template allows you to provides a clear overview of how different departments, teams, and individuals are organized and how they interact with each other. Fully customizable and compatible with Powerpoint, Keynote, and Google Slides.


6 slides
Creative Thinking and Innovation Presentation
Unleash Creative Thinking and Innovation with this engaging infographic. Featuring a visually dynamic brain puzzle design, this template is perfect for presenting problem-solving strategies, brainstorming techniques, and creative business solutions. Fully editable and compatible with PowerPoint, Keynote, and Google Slides.


4 slides
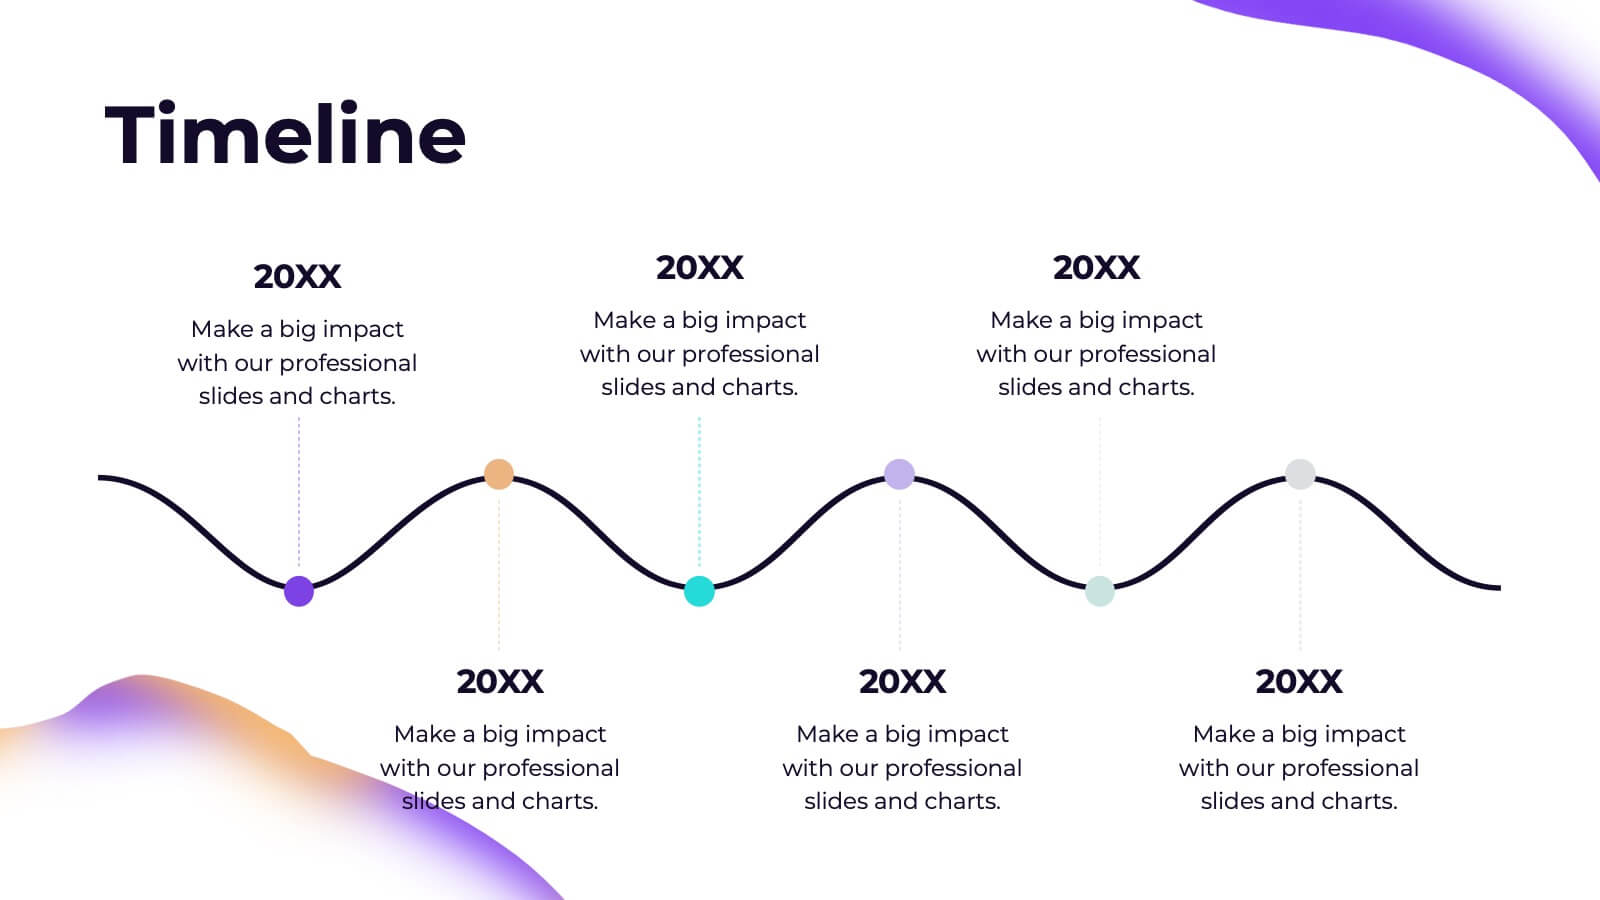
Sequential Roadmap Planning Timeline Presentation
Guide your audience through each milestone with the Sequential Roadmap Planning Timeline Presentation. This sleek layout is perfect for showing linear progress over time—ideal for strategic plans, product rollouts, or project phases. Each step is clearly marked with editable years and titles, ensuring clarity and easy customization. Fully compatible with PowerPoint, Google Slides, and Canva.


7 slides
30 60 90 Day Plan Diagram Presentation
The 30-60-90 day plan is a document that outlines an individual's goals and objectives for the first 90 days of a new job. This template allows you the ability to set goals, review progress and analyze the results of your work. This infographic template is a multipurpose design that can be used for business, personal, and educational projects. It includes descriptive text and images to help you put together your presentation plan. It's easy to use and has been designed to be compatible with Powerpoint, Keynote, and Google Slides just add your own information and start presenting!

20 slides
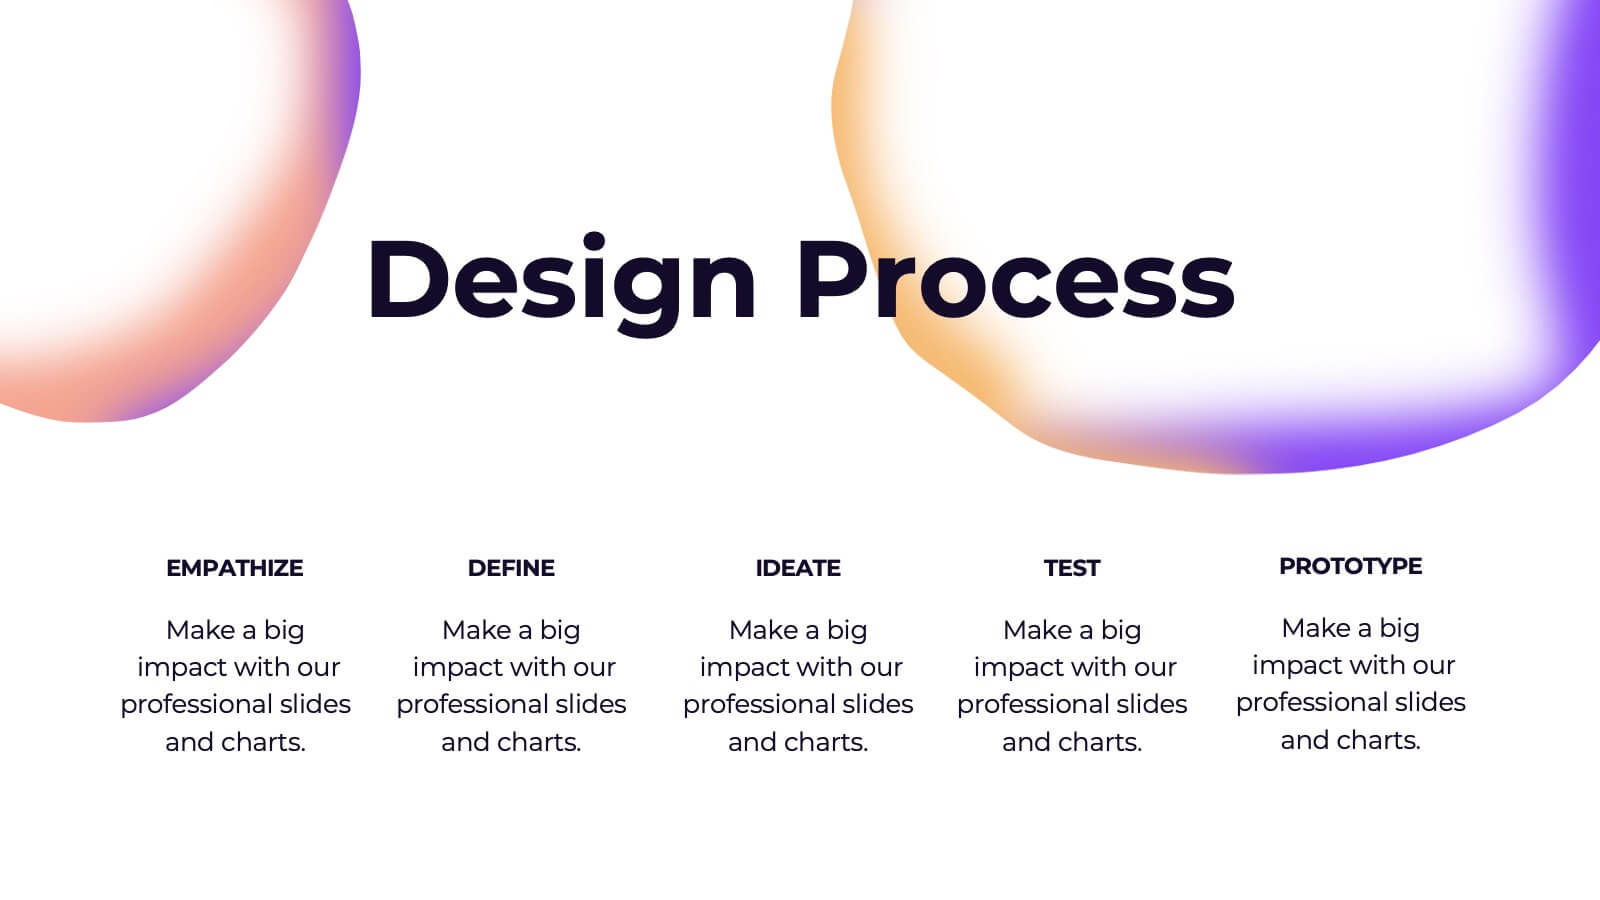
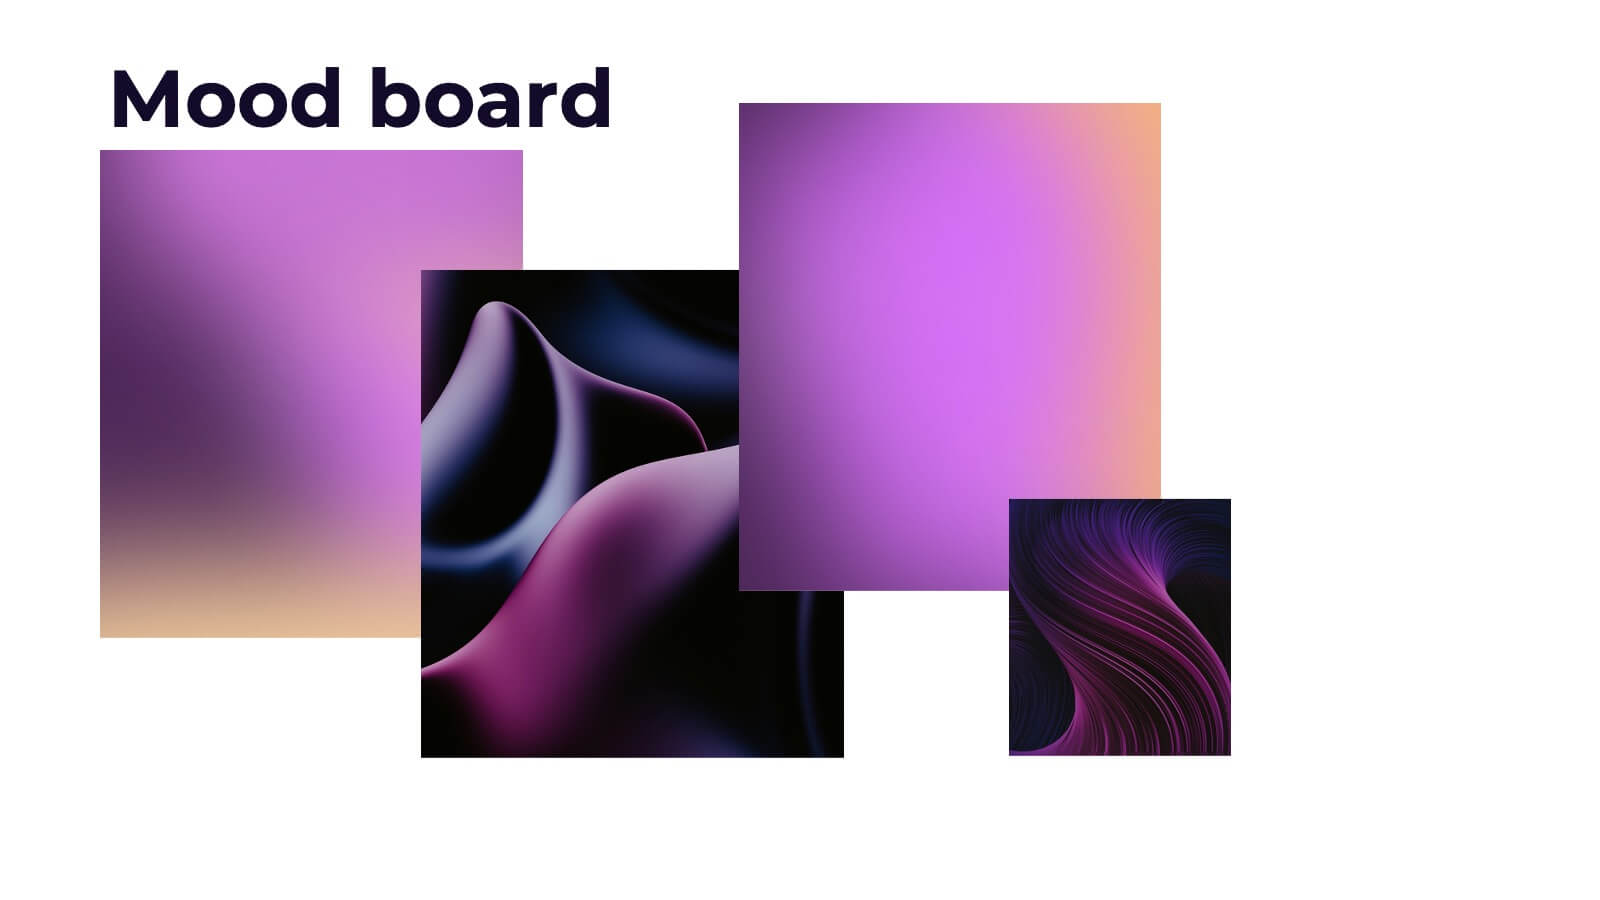
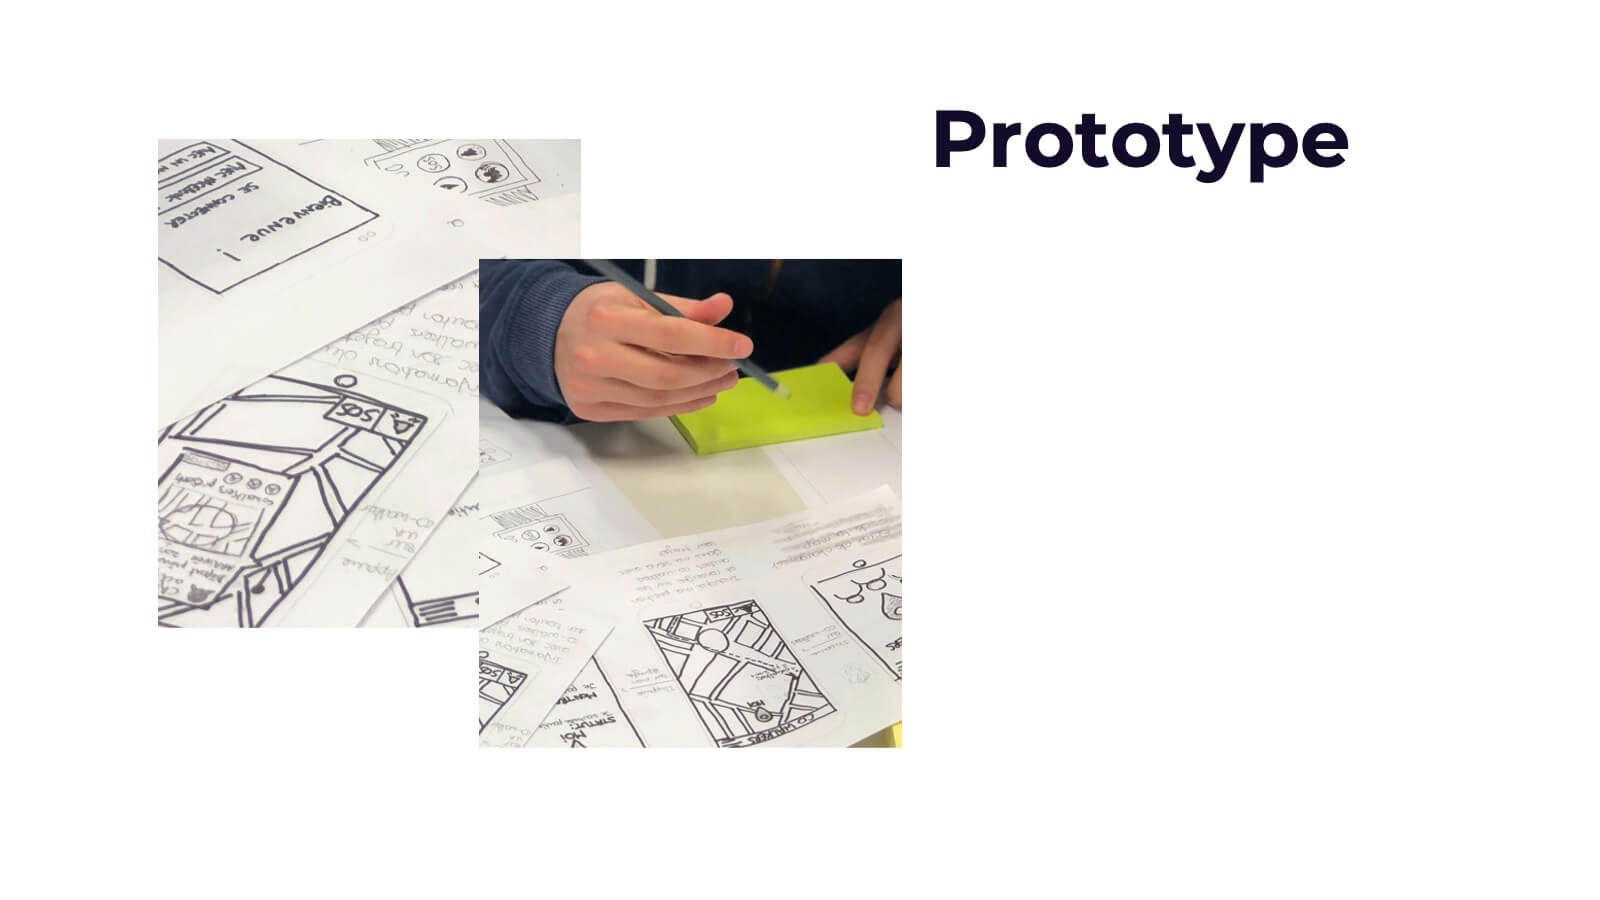
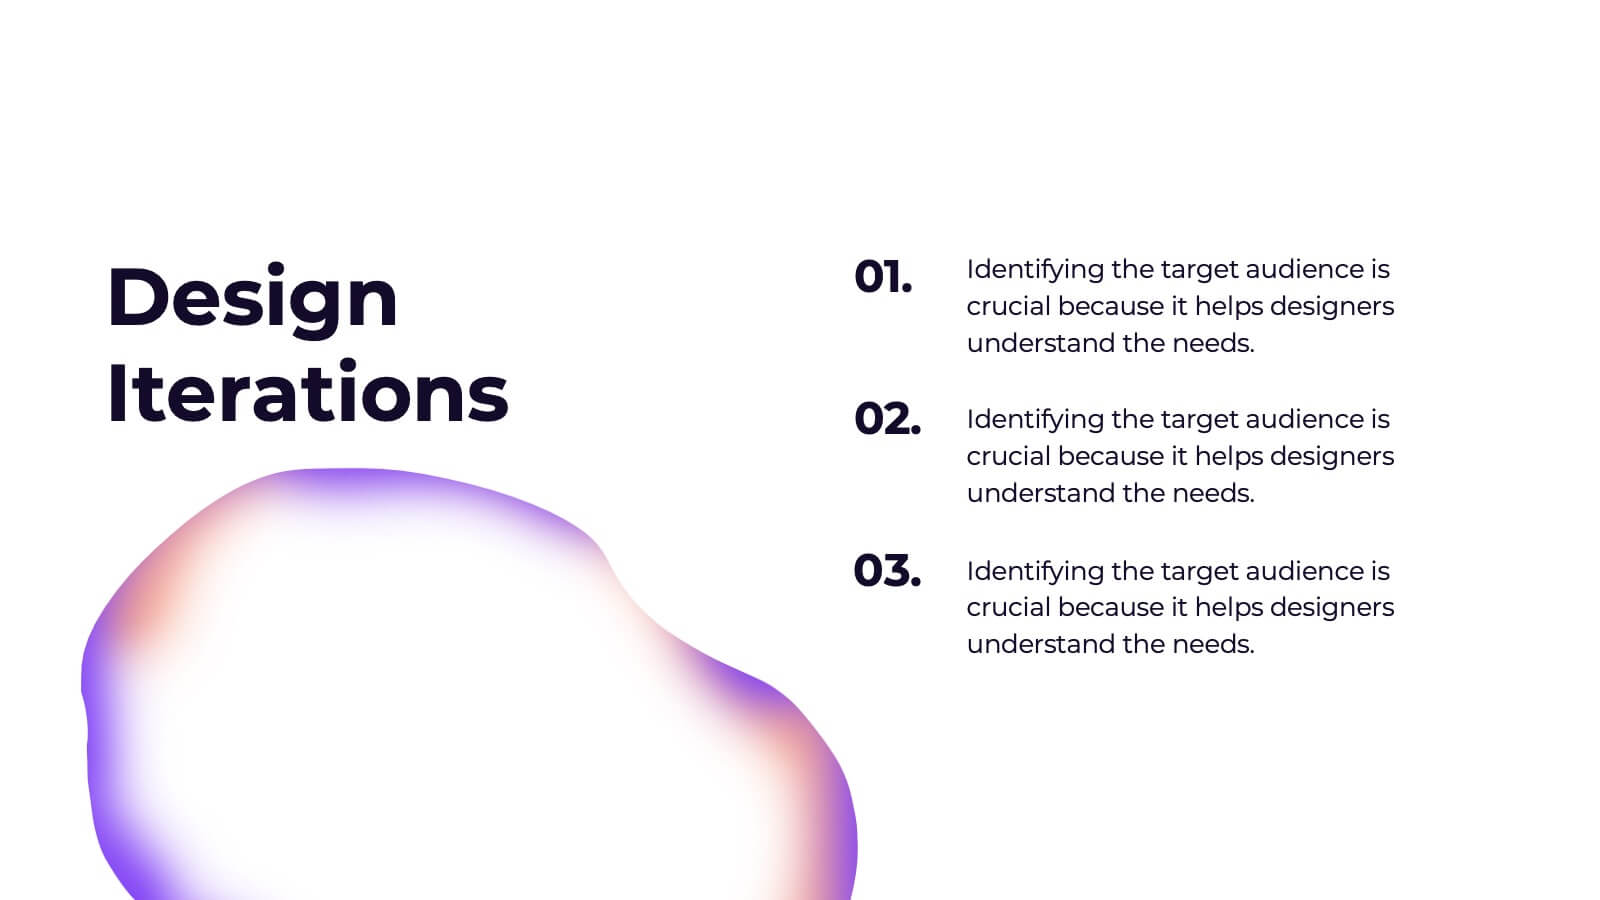
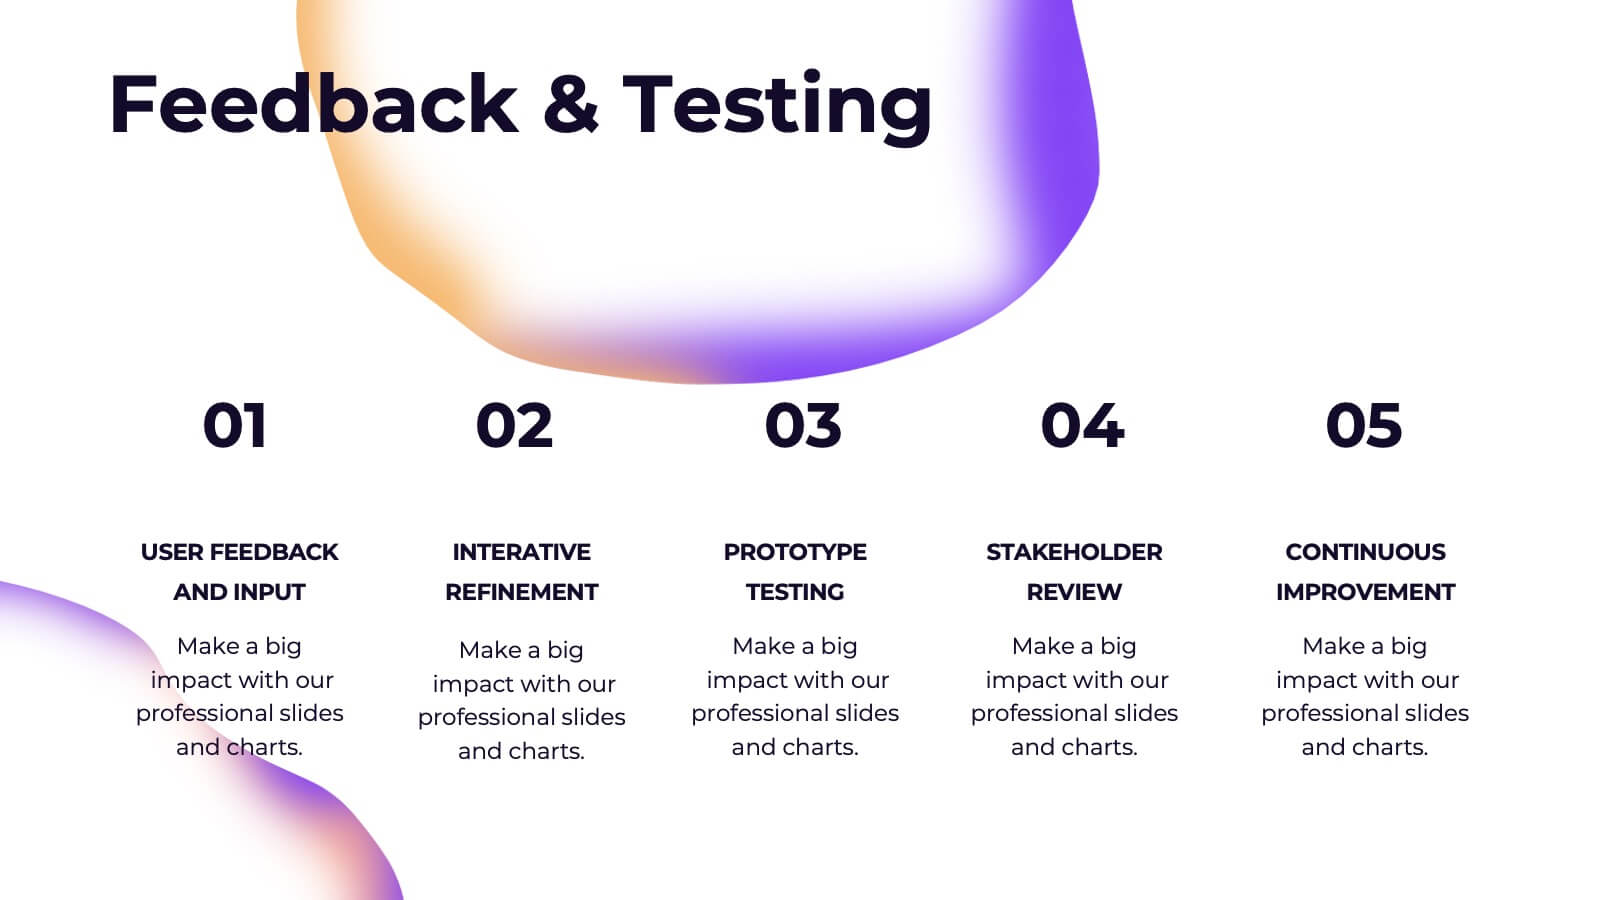
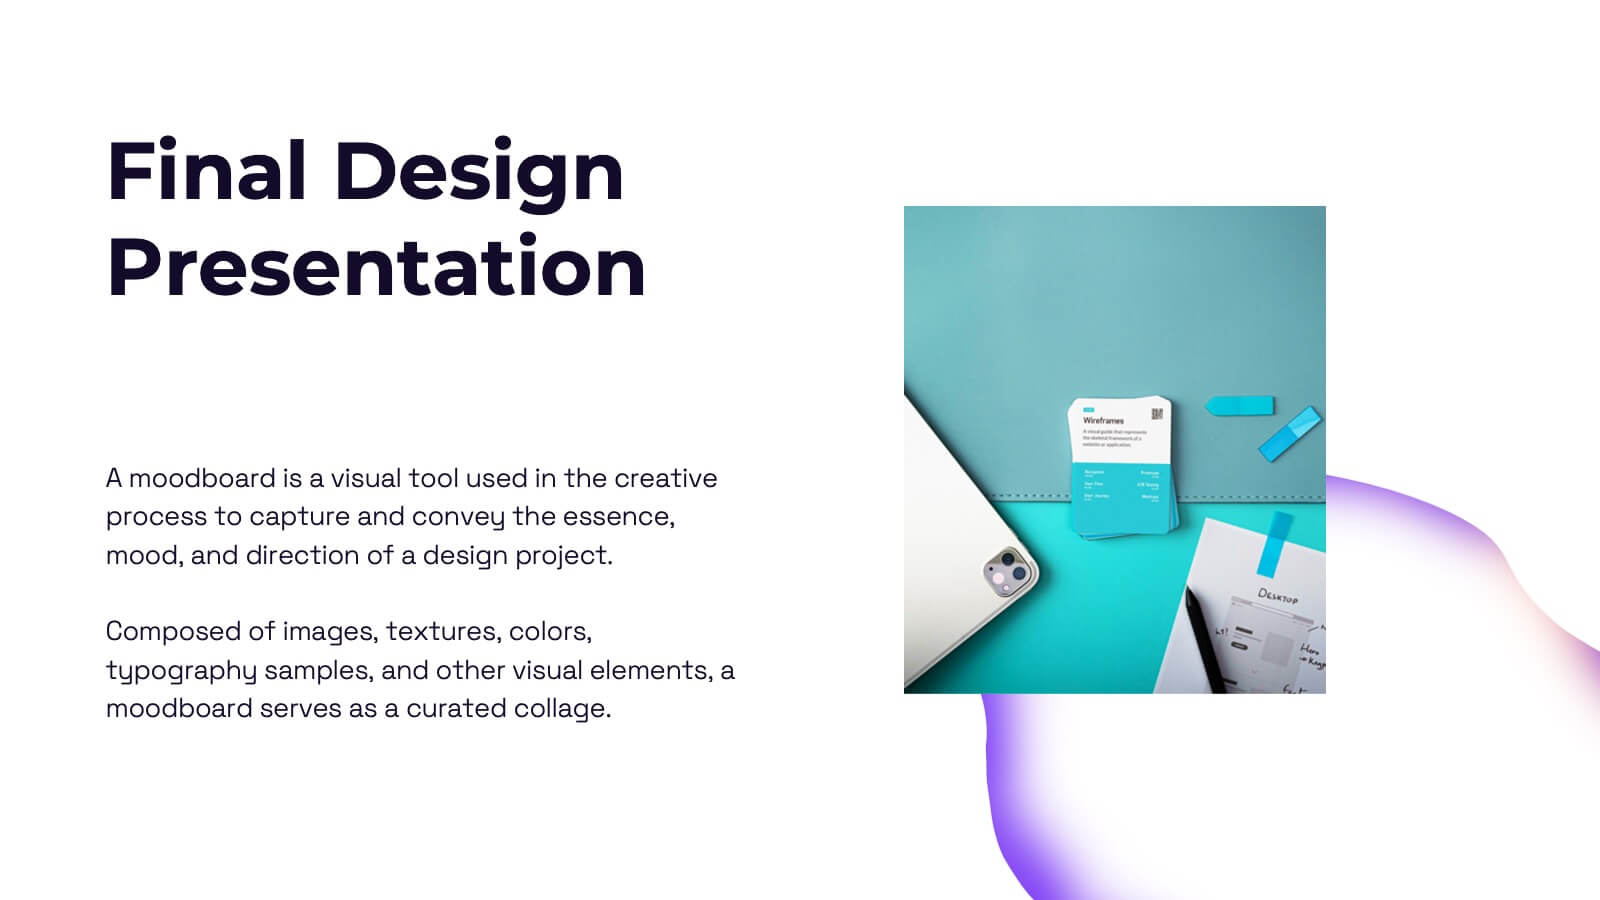
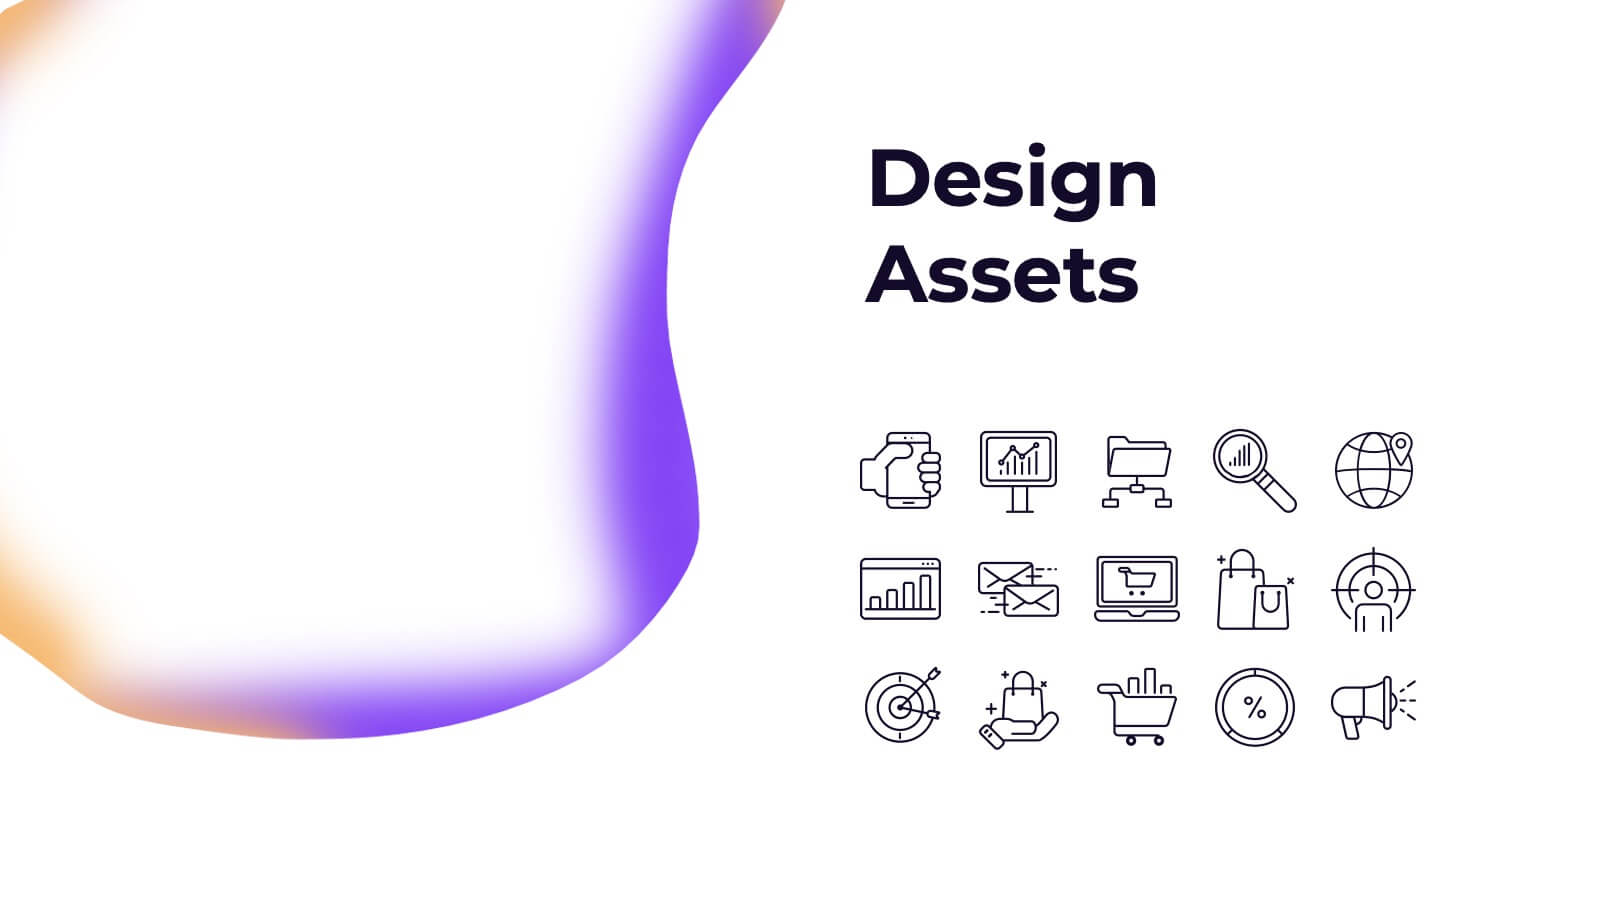
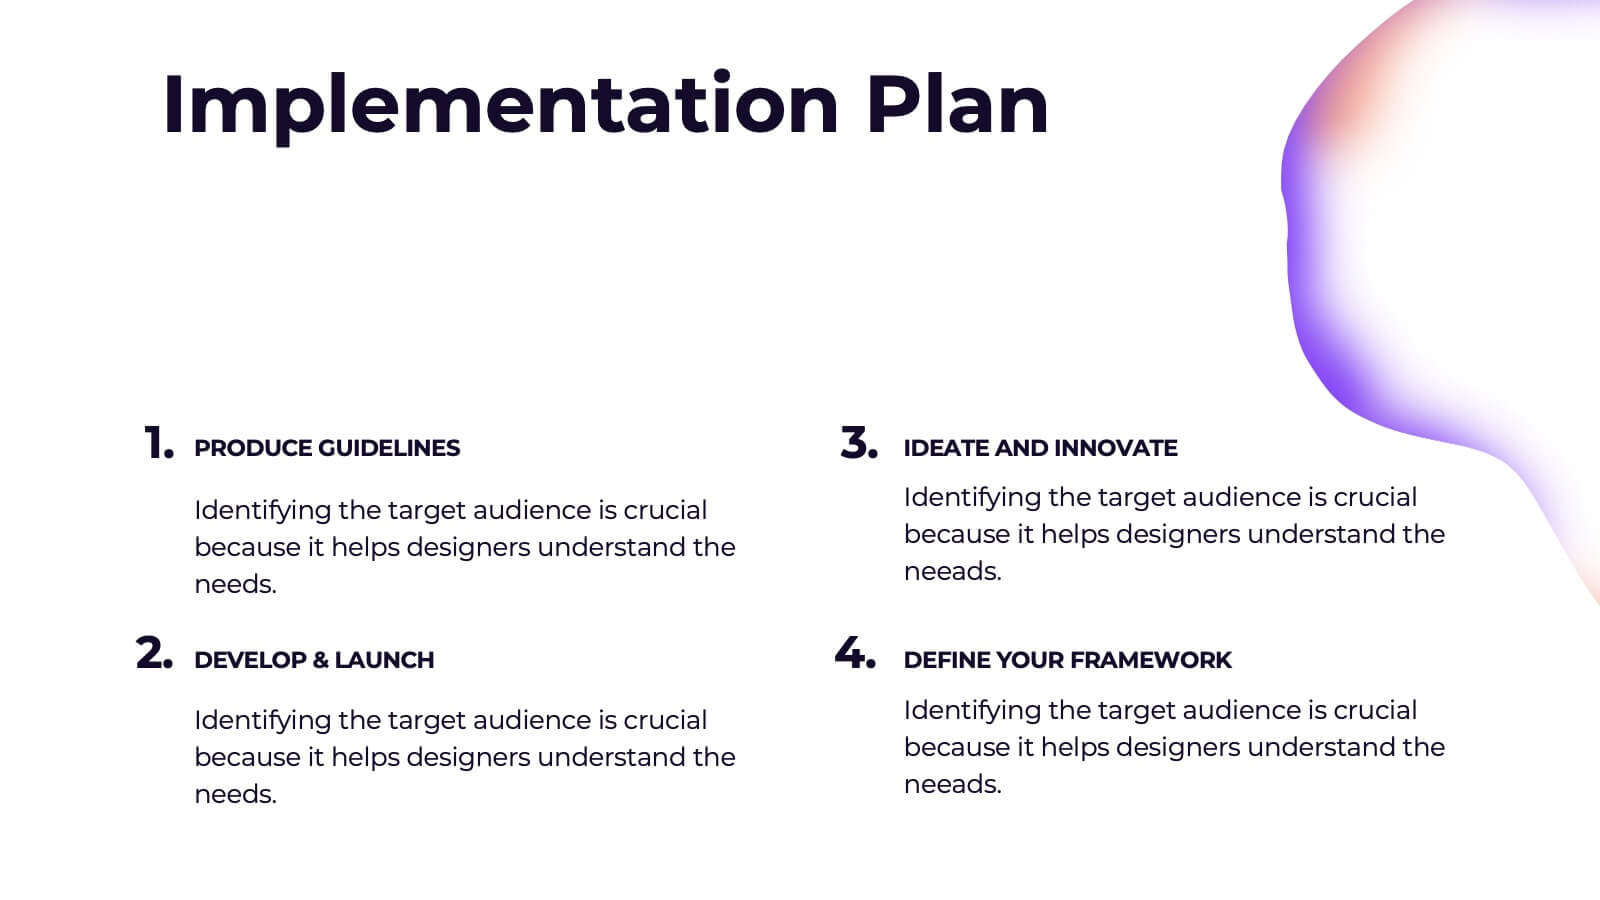
Valkyrie Design Strategy Proposal Presentation
Elevate your design strategy presentations with this visually captivating and modern template! It covers every step of the design process, from concept development and mood boards to prototype iterations and feedback. Ideal for showcasing design elements, textures, and assets, this template is perfect for creative professionals. Compatible with PowerPoint, Keynote, and Google Slides for easy, polished presentations.


21 slides
Vespera Project Management Plan Presentation
This Project Management Plan Presentation template is a professional and well-structured tool to outline project goals, scope, timelines, and resources. It covers key elements like deliverables, budget breakdown, risk management, and stakeholder analysis. Fully customizable and compatible with PowerPoint, Keynote, and Google Slides for seamless collaboration.


7 slides
Environment United States Map Infographic
An Environment United States Map refers to a map that displays various environmental aspects or features across the United States. This template is a powerful tool for visualizing sustainability initiatives and environmental data across the diverse landscapes of the United States. With a combination of insightful graphics, this template enables you to present a compelling narrative about the nation's environmental efforts. This Infographic is a call to action to protect and preserve our planet, highlighting the efforts that are shaping a more sustainable and harmonious coexistence with nature.


10 slides
Business Growth through Target Market Analysis Presentation
Showcase how strategic insights drive expansion with this step-by-step infographic. Designed with layered growth icons and space for titles and text, this layout helps illustrate the phases of market targeting, consumer profiling, and sales development. Perfect for marketing strategies, business development roadmaps, and client presentations. Fully customizable in PowerPoint, Keynote, and Google Slides


5 slides
Educational Planning & Class Activities Presentation
Organize your lessons with this creative education-themed layout. Featuring a playful stack of books and apple illustration, this slide is ideal for outlining academic plans, class objectives, or weekly activities. Fully editable in PowerPoint, Keynote, and Google Slides—perfect for teachers, homeschoolers, and education professionals seeking clarity and visual appeal.


6 slides
AIDA Diagram
The AIDA Diagram is a simple and effective marketing tool used to guide the design of advertising and promotional materials with the goal of attracting and retaining customers. AIDA stands for Attention, Interest, Desire, and Action, and it represents the four stages a potential customer goes through when exposed to marketing content. This infographic template is a classic marketing and advertising framework used to understand and guide the consumer's journey through the buying process. This infographic is completely customizable and compatible with Powerpoint, Keynote, and Google Slides.


23 slides
Kitsune Startup Strategy Presentation
This startup strategy template is designed for clear communication of business vision, target market, and unique value proposition. It also includes slides for marketing strategies, team introduction, and financial overview. Its clean, professional layout makes it ideal for investors or stakeholders. Compatible with PowerPoint, Keynote, and Google Slides for easy customization.