

Features
- 1 Unique slides
- Fully editable and easy to edit in Microsoft Powerpoint, Keynote and Google Slides
- 16:9 widescreen layout
- Clean and professional designs
- Export to JPG, PDF or send by email


Do you have any questions?
Recommend


5 slides
Long-Term Strategy Slide Presentation
Ignite big ideas with a bold, forward-moving layout that makes long-range goals feel inspiring and achievable. This presentation helps you outline future plans, key milestones, and strategic priorities with clarity and visual impact. Easy to edit and fully compatible with PowerPoint, Keynote, and Google Slides.


21 slides
Echochime Project Timeline Presentation
Outline your project’s milestones and deliverables with this comprehensive timeline-focused presentation template. Ideal for project managers and teams, this layout streamlines the process of showcasing objectives, schedules, and key milestones with clarity and precision. The template includes dedicated slides for problem statements, resource allocation, budget planning, stakeholder communication, risk management, and quality assurance. Its visually engaging timeline design ensures a clear and professional overview of your project's progress. Designed for seamless customization, this template is fully compatible with PowerPoint, Google Slides, and Keynote, allowing you to tailor colors, fonts, and layouts to align with your project branding. Present your strategy and progress with confidence, ensuring stakeholders and team members stay informed and aligned.


10 slides
Checklist and Action Plan List Presentation
Stay organized and achieve goals efficiently with this checklist and action plan template. Designed for task tracking, project management, and strategic planning, it provides a clear visual structure for prioritizing tasks. Perfect for professionals and teams aiming for productivity. Compatible with PowerPoint, Keynote, and Google Slides for seamless editing and presentation.


28 slides
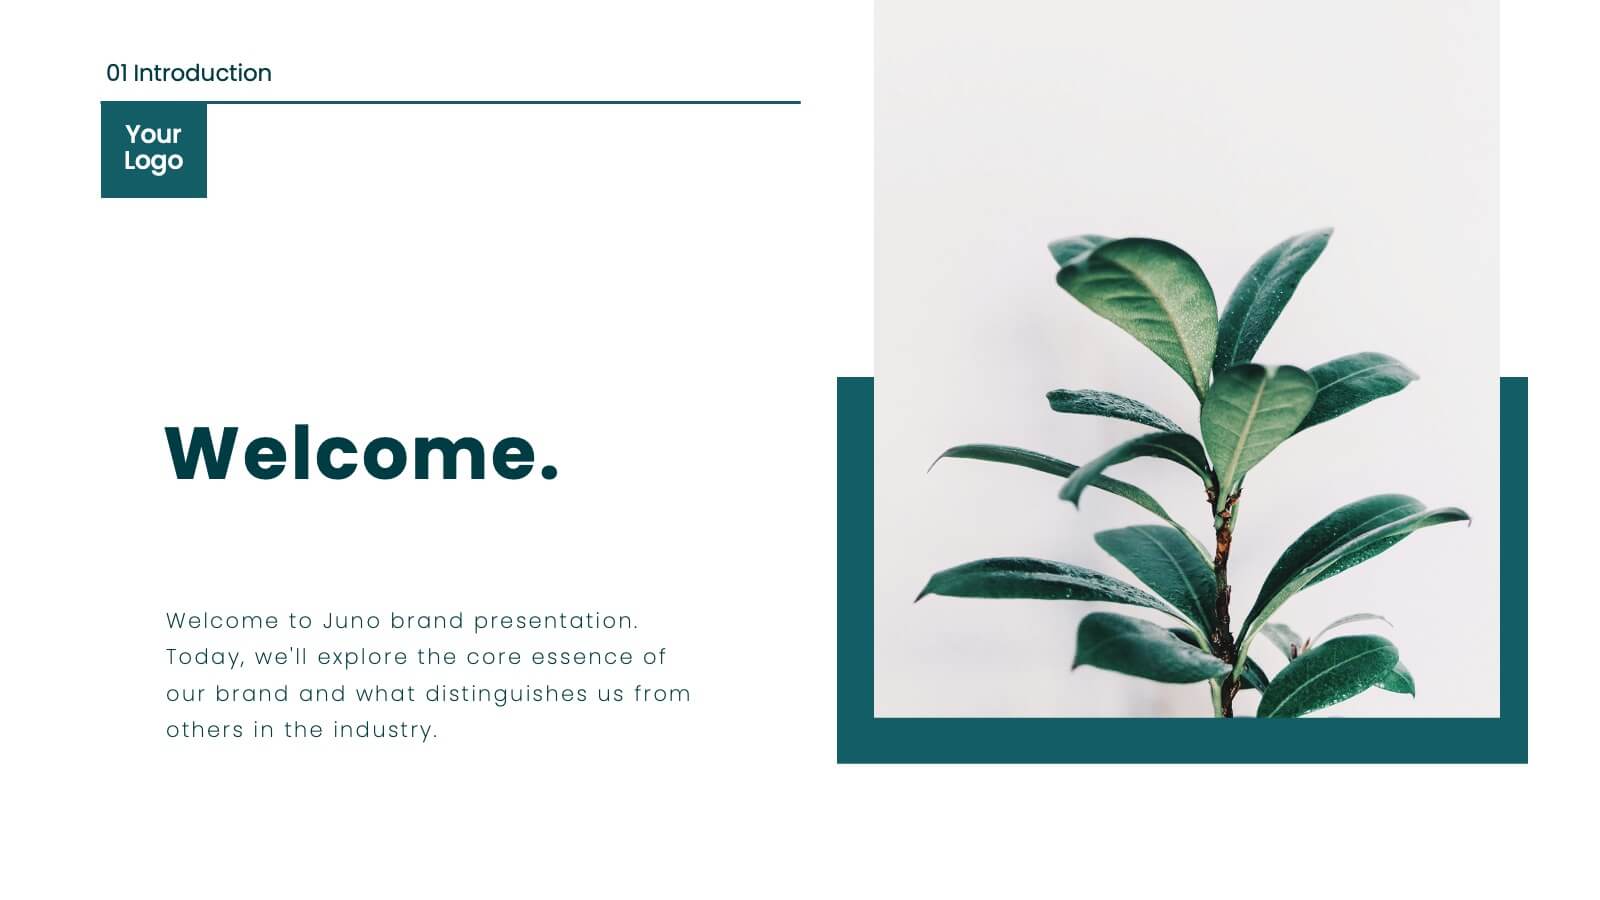
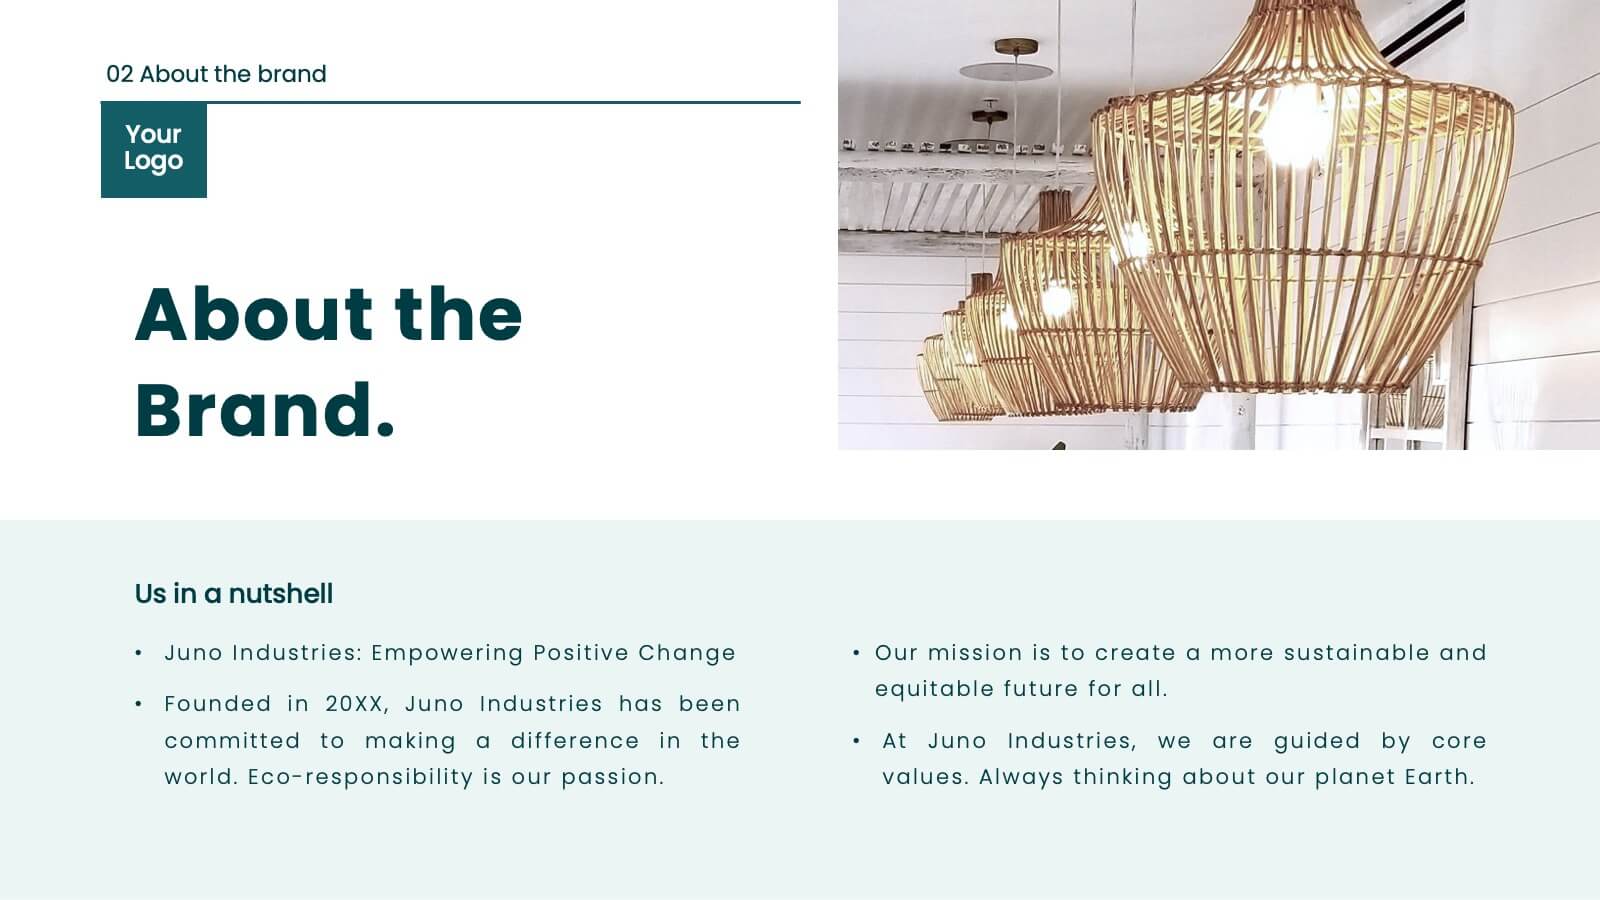
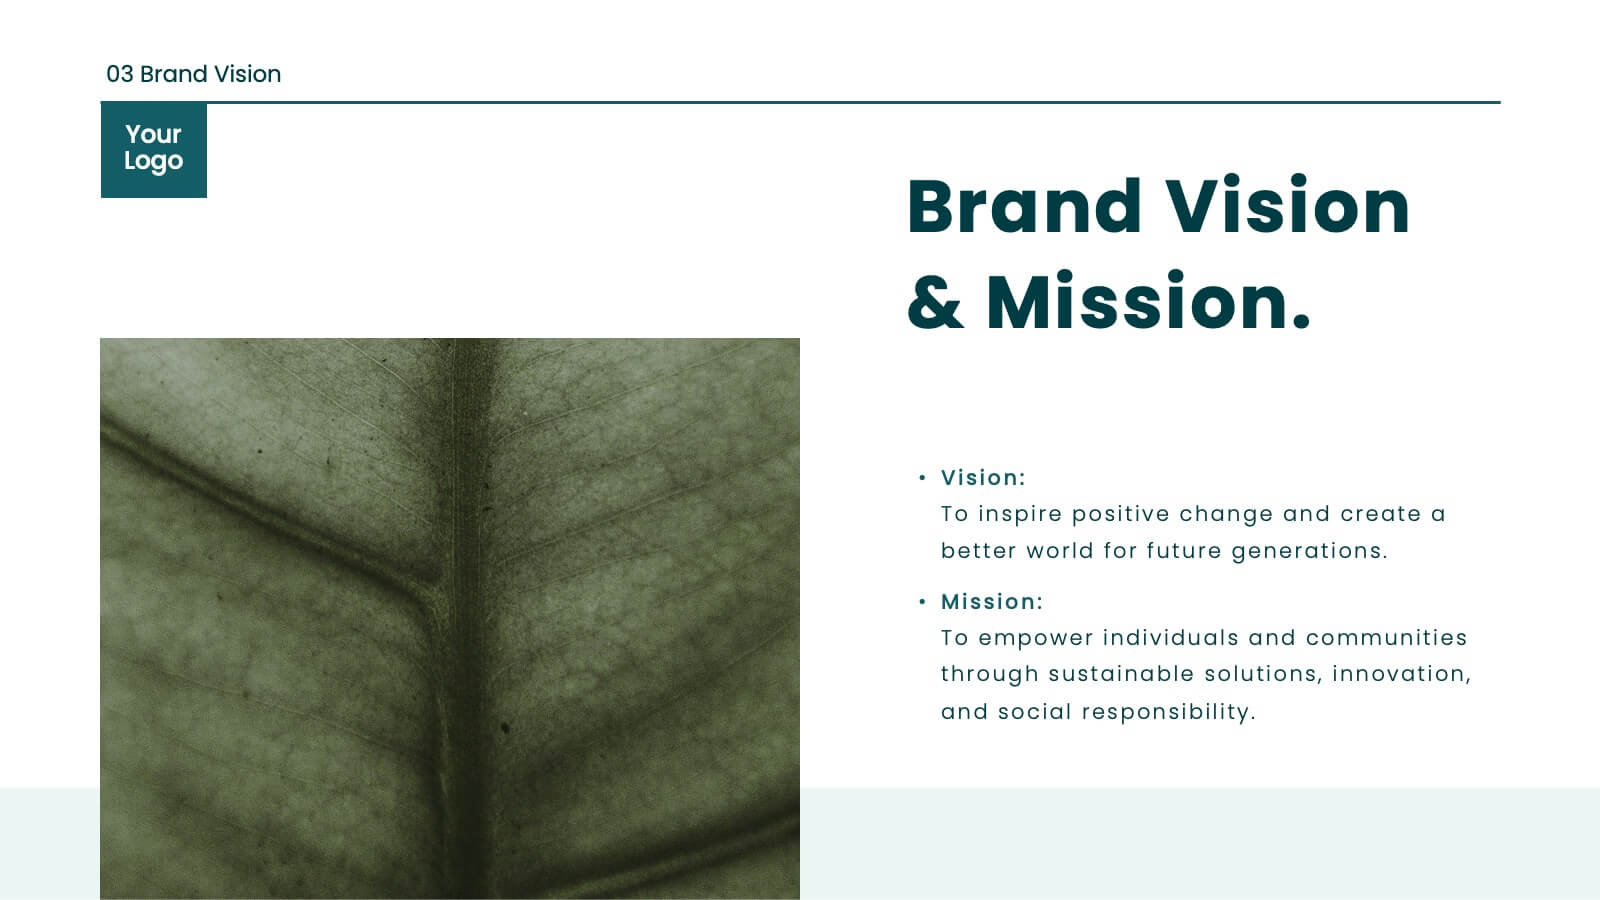
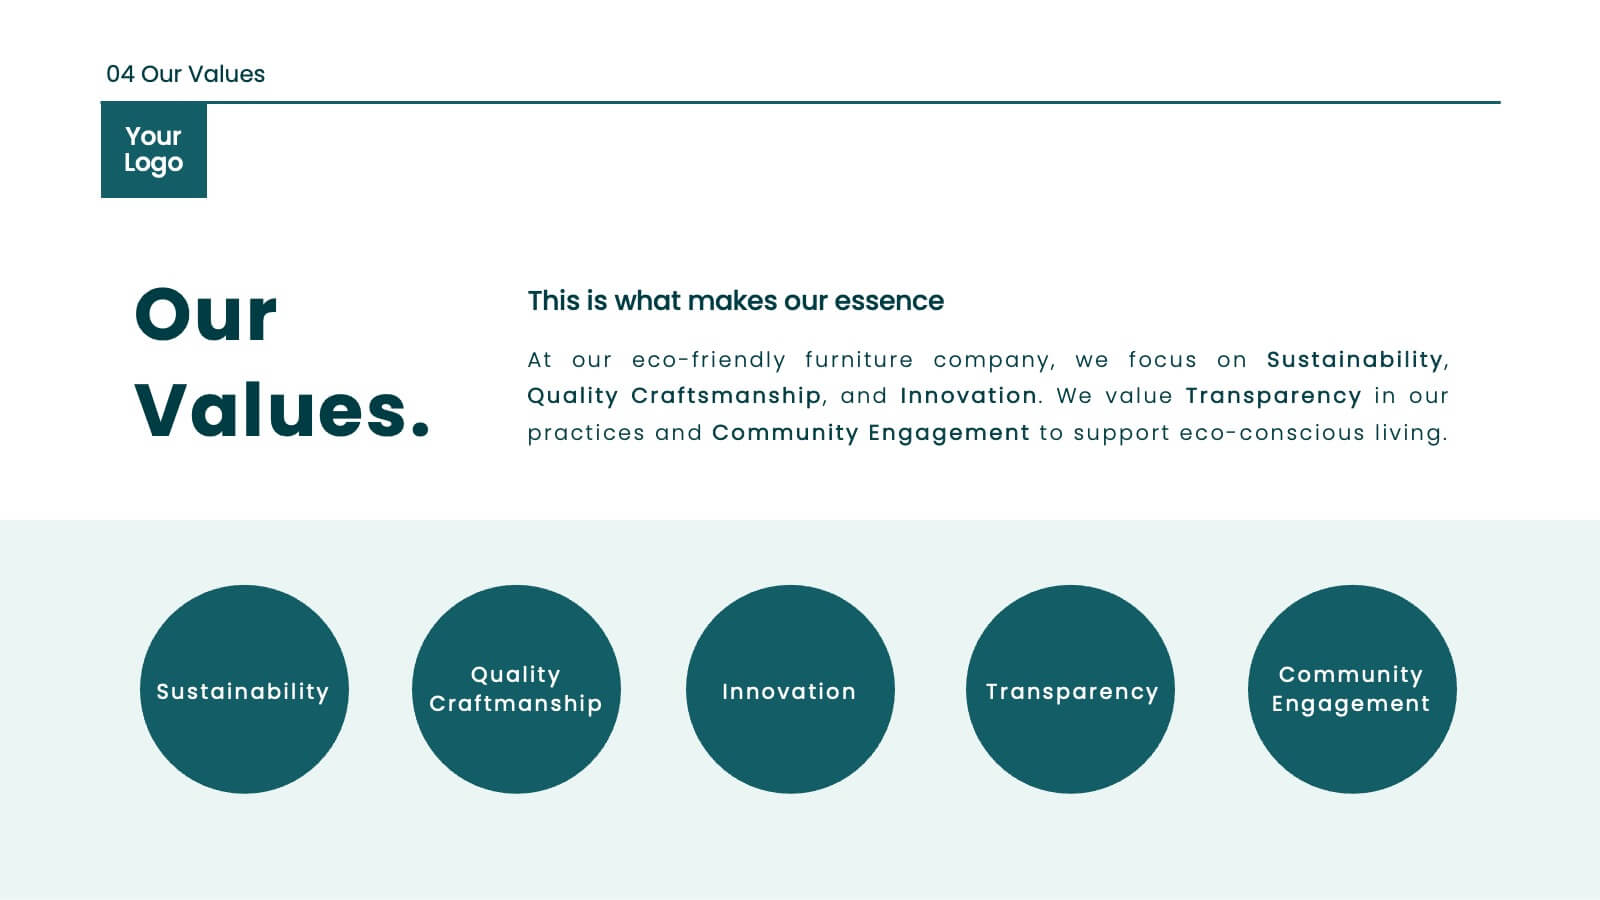
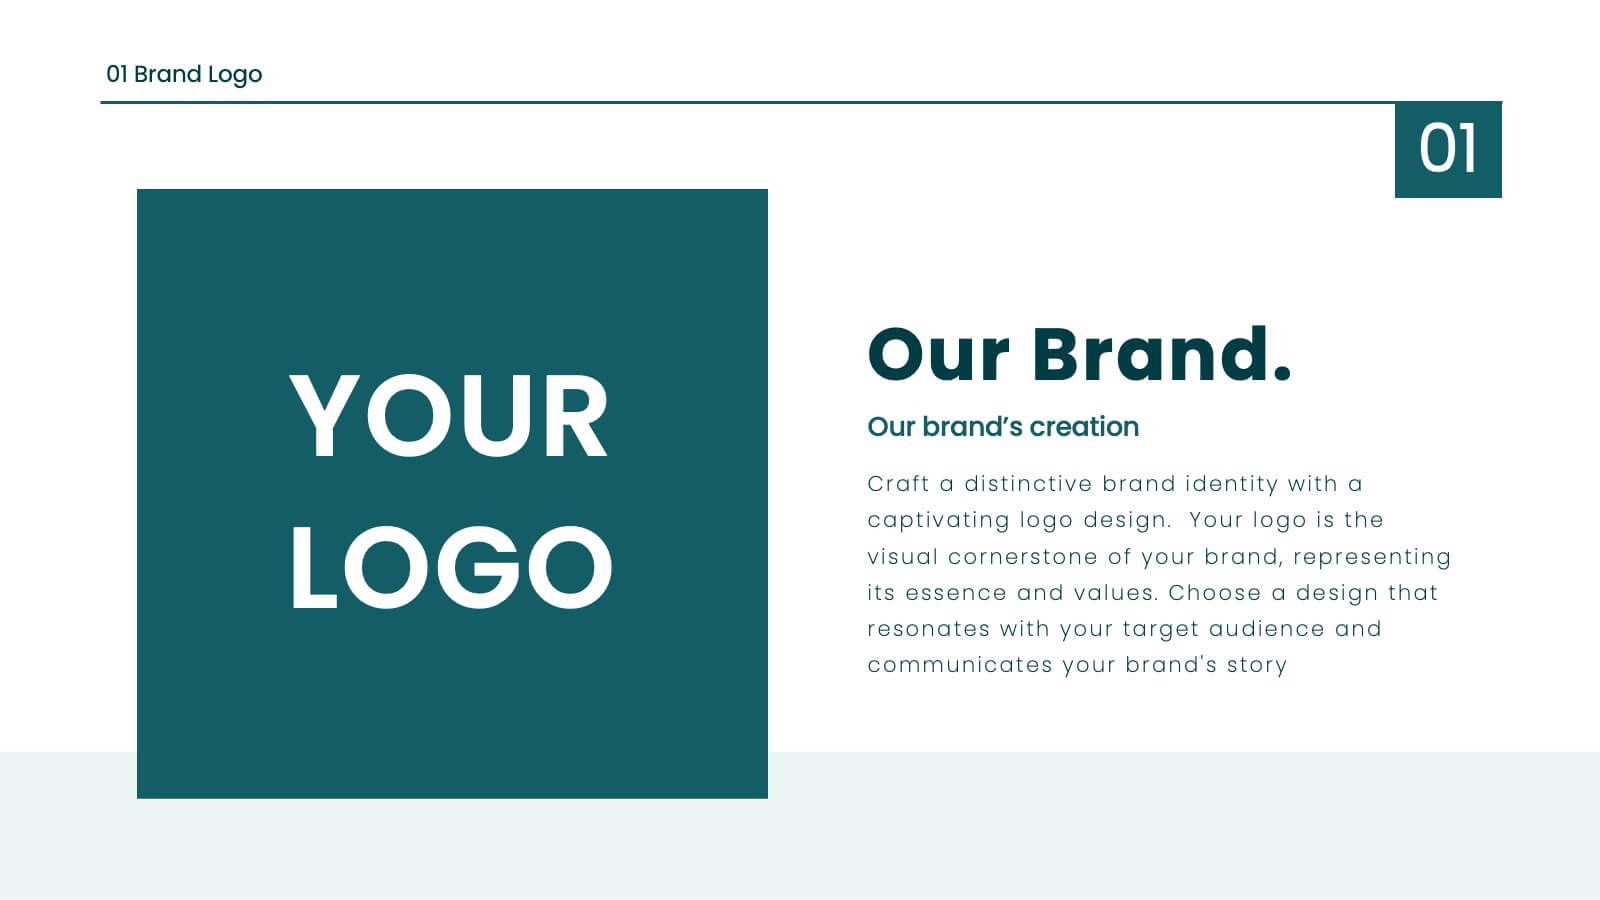
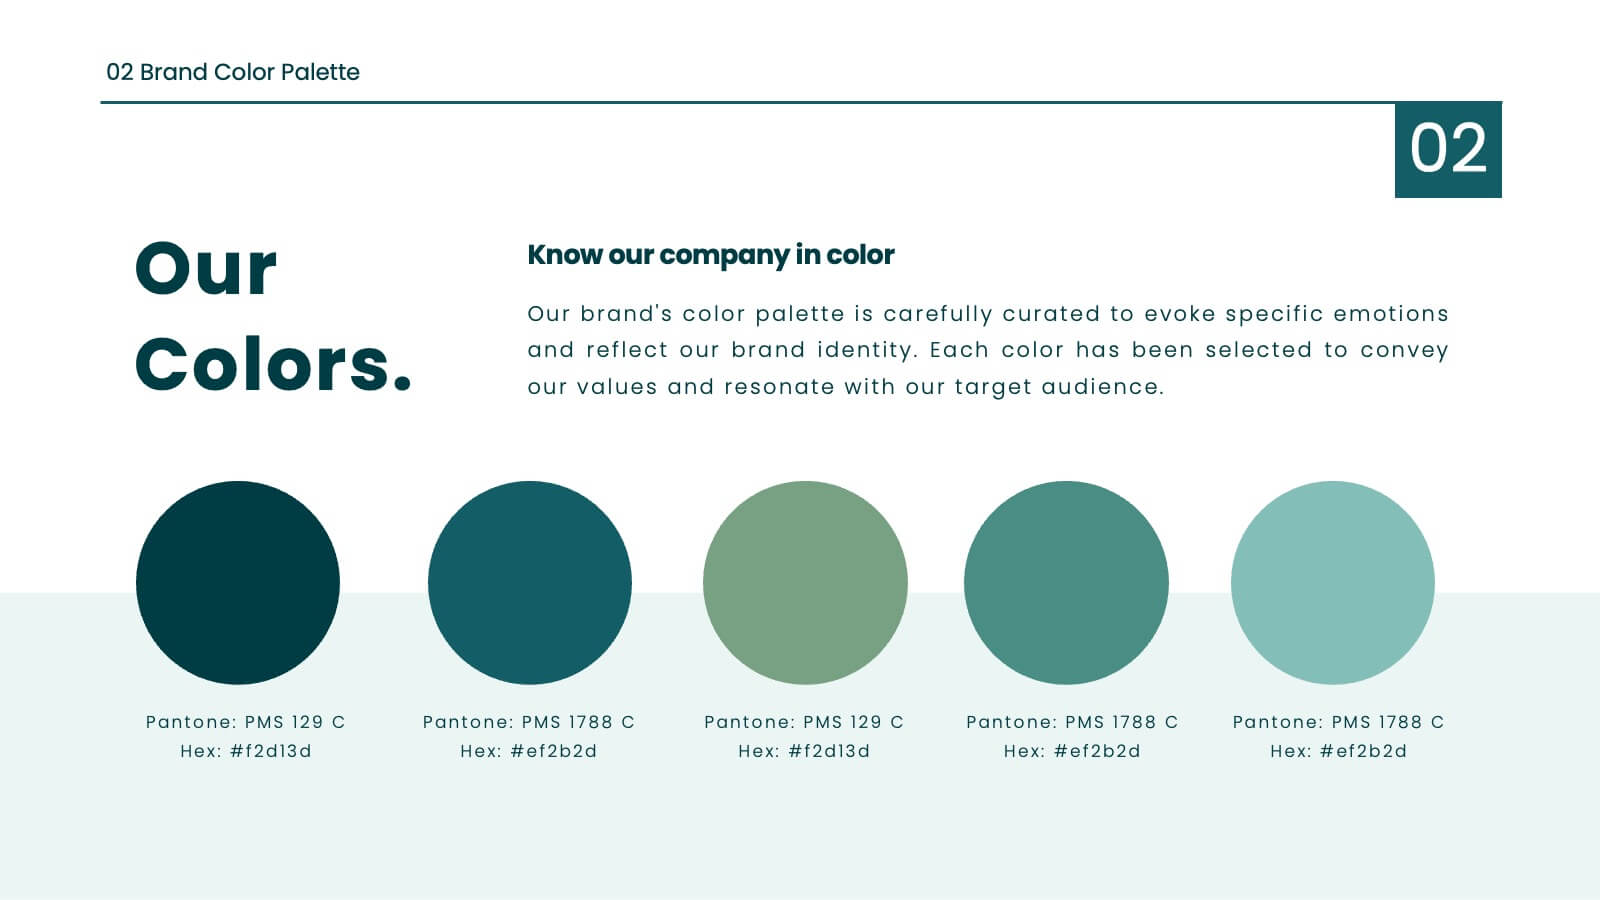
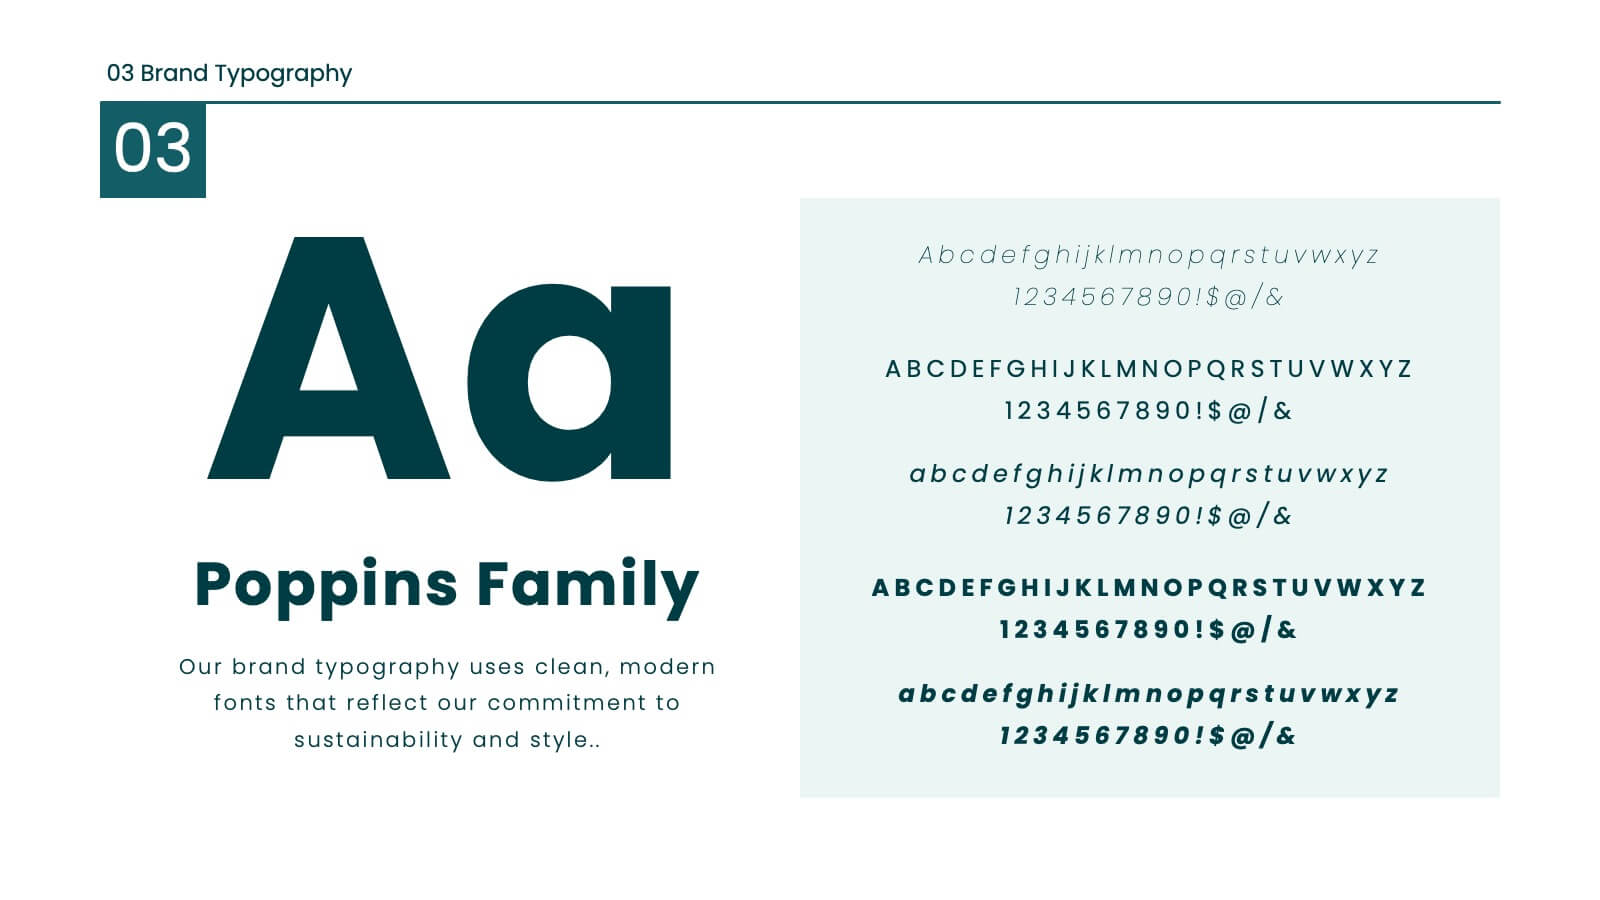
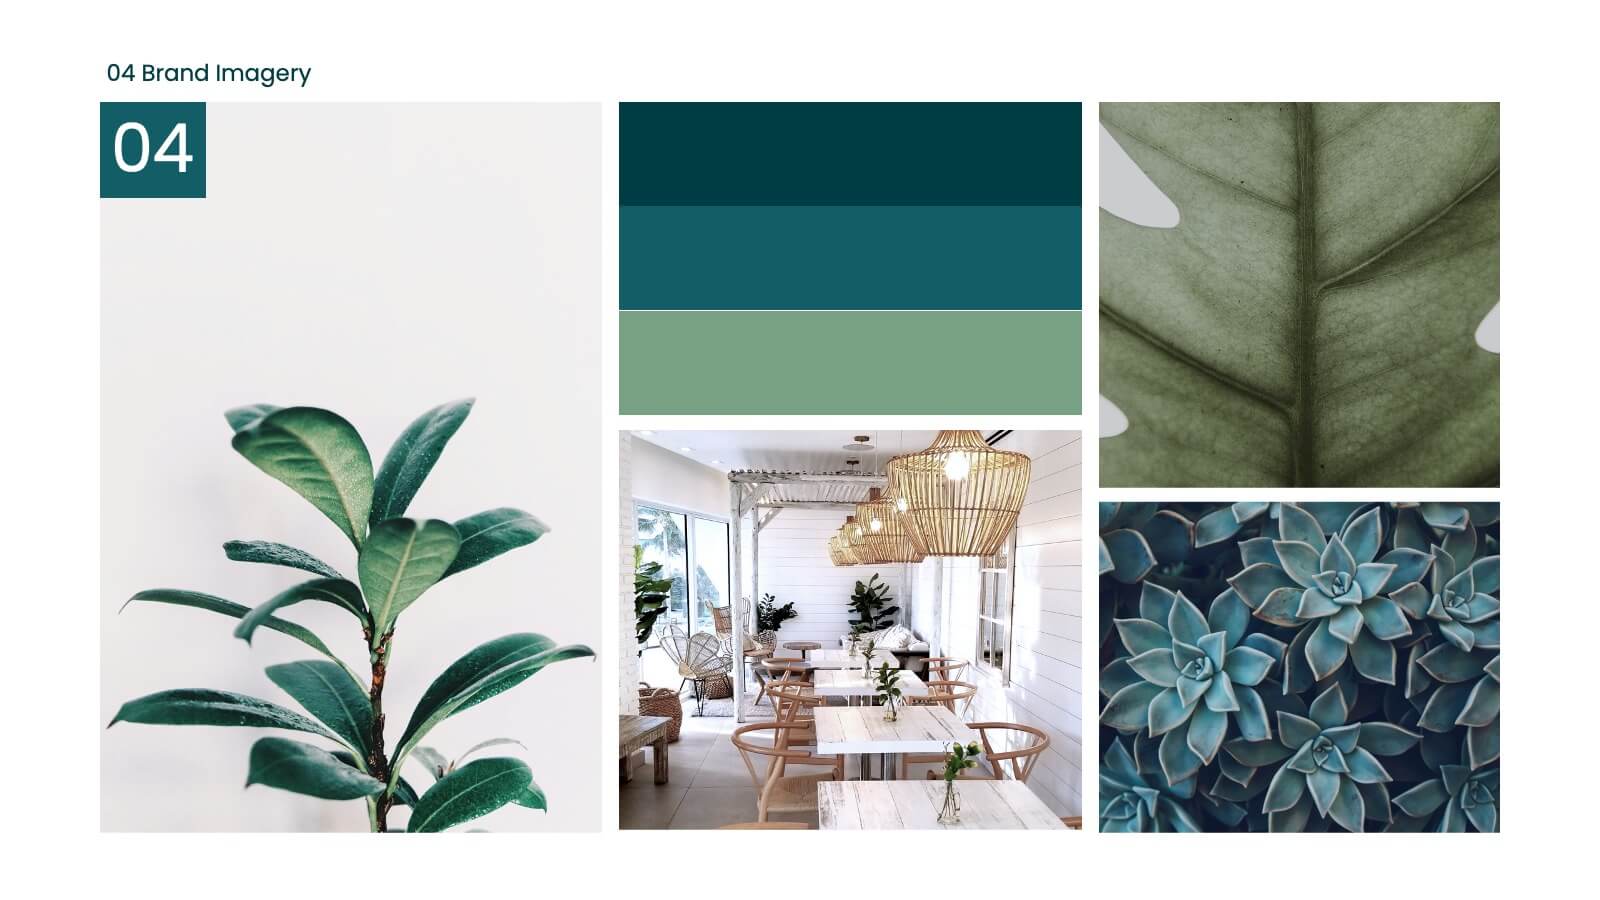
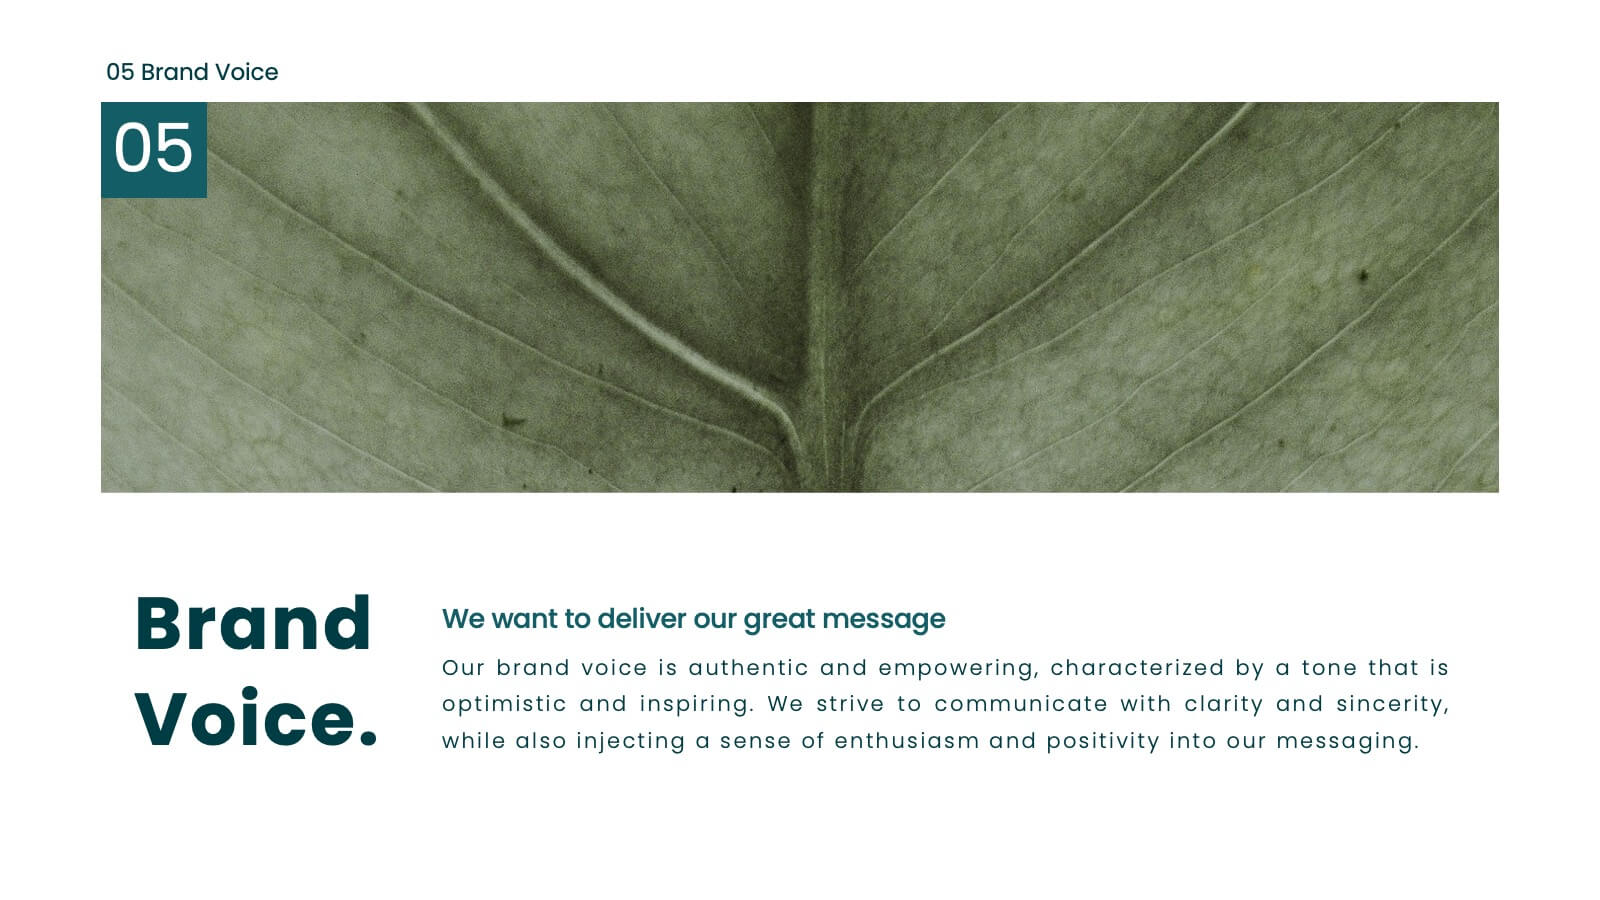
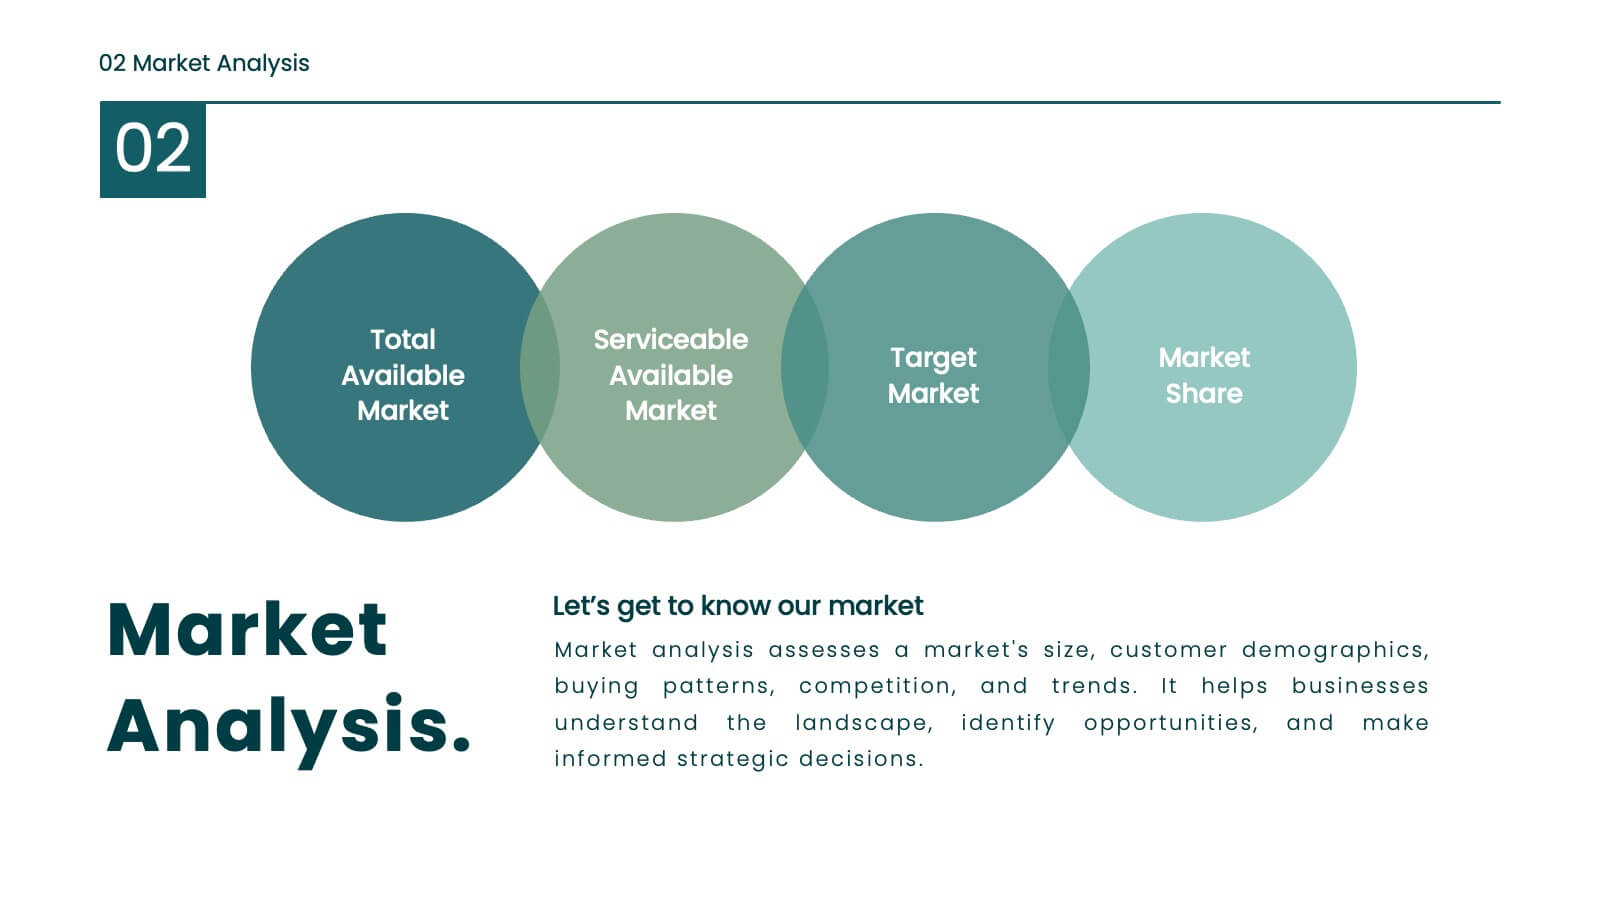
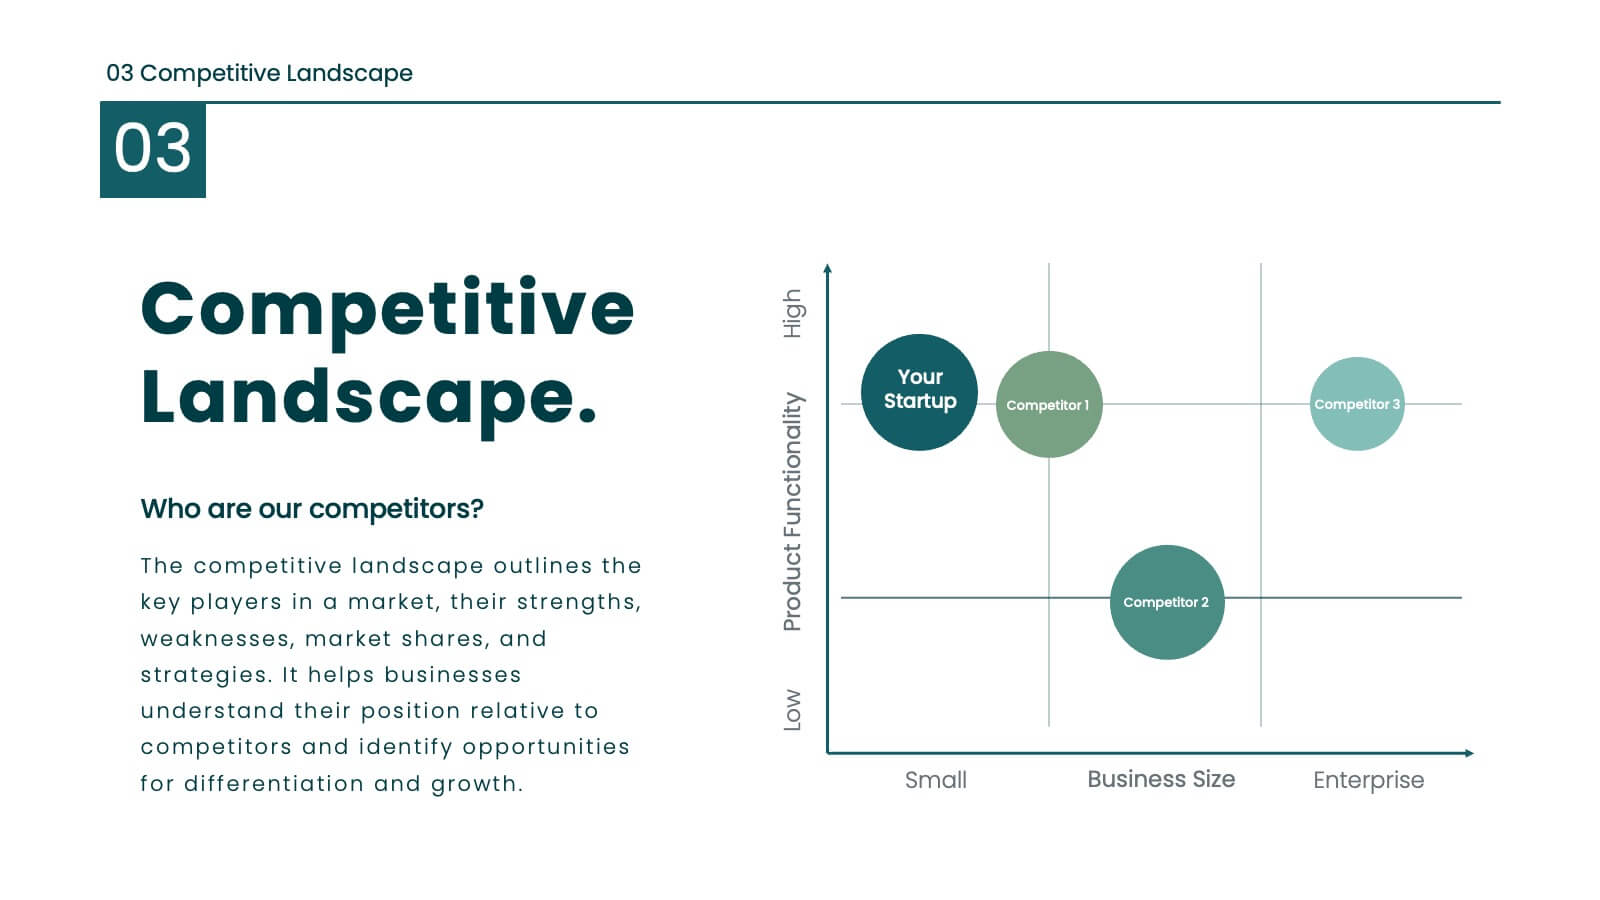
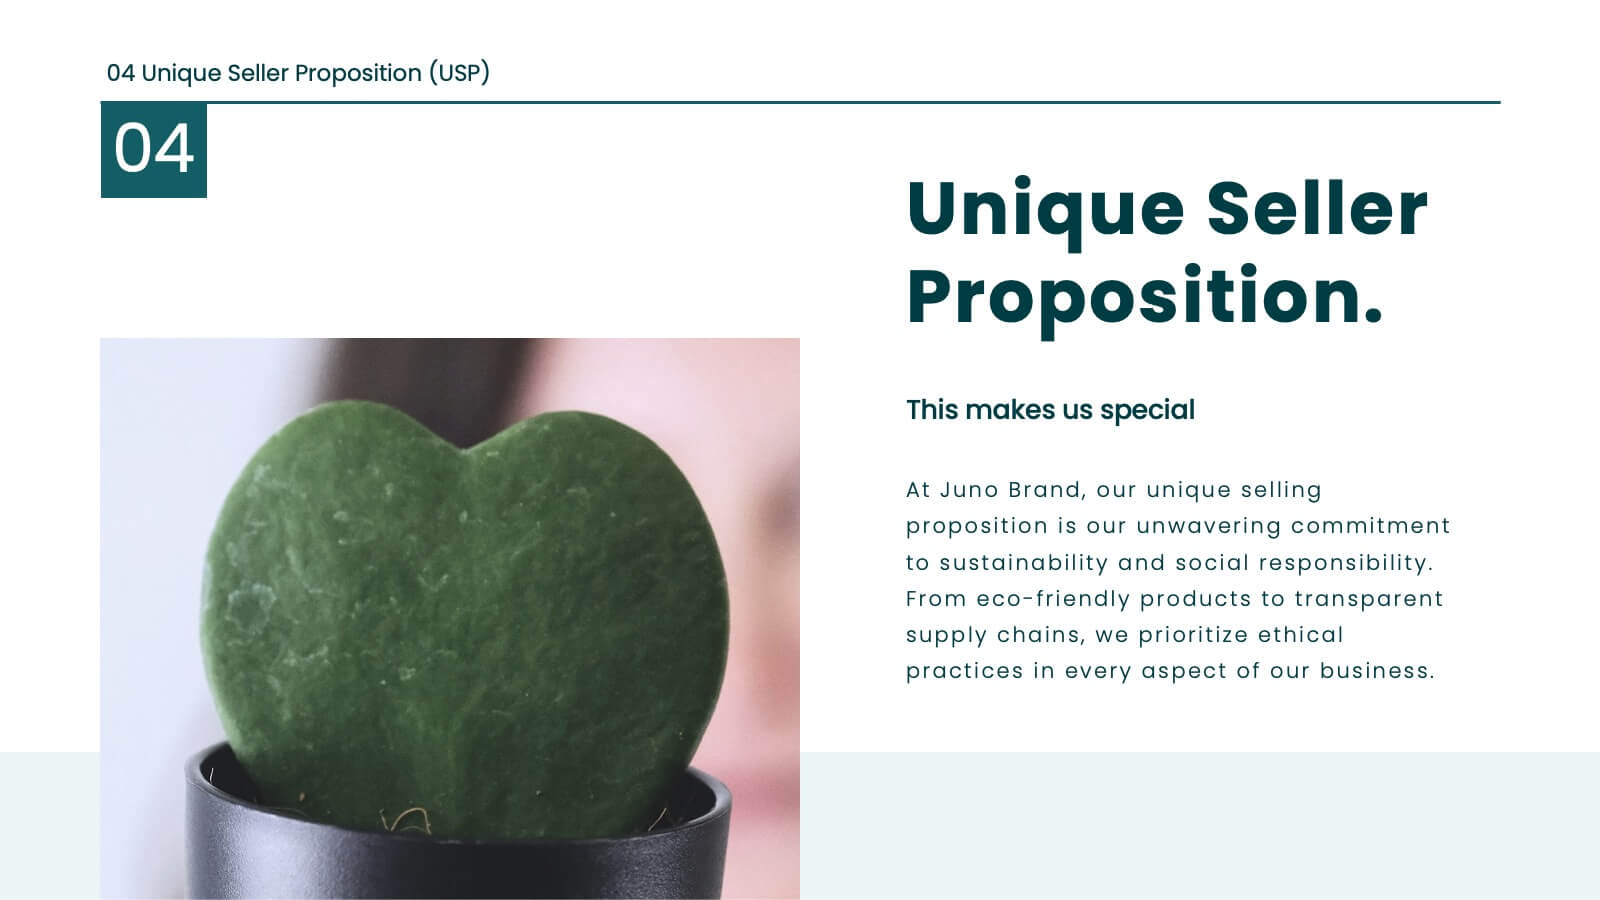
Juno Brand Guidelines Proposal Presentation
Define your brand's identity with this comprehensive, stylish presentation template. Perfect for detailing brand guidelines, vision, mission, and market analysis, it features a clean design with a professional layout. Highlight key elements like color palettes, typography, and unique selling propositions to ensure consistency and clarity. Compatible with PowerPoint, Keynote, and Google Slides, it’s ideal for any platform.


6 slides
App Design Mockup
Showcase your app UI in a bold, creative way with this vibrant slide layout. Featuring dynamic smartphone mockups and modern graphic accents, it's ideal for app demos, portfolio highlights, or feature walkthroughs. Fully editable in PowerPoint, Keynote, and Google Slides—customize fonts, colors, and layouts to suit your brand.


10 slides
Brain Function Infographic Presentation
Explore cognitive processes with the Brain Function Infographic. Featuring a layered human head design, this visual template highlights four key functions, making it ideal for psychology, neuroscience, and decision-making presentations. Fully customizable with editable colors, text, and icons. Compatible with PowerPoint, Keynote, and Google Slides for seamless presentation use.


5 slides
Customer Retention and Loyalty Marketing Presentation
Showcase your loyalty strategies in a visually compelling way with this modern shopping cart-themed slide. Ideal for outlining customer retention initiatives, this template highlights five key tactics or rewards using numbered icons and clean layout sections. Great for marketers, retail teams, and business consultants. Fully editable in PowerPoint, Keynote, and Google Slides.


20 slides
Dreamora Sales Performance Report Presentation
Deliver an impactful overview of your sales performance with this sleek and vibrant template. It features sections to highlight key aspects such as sales metrics, team introductions, and competitive analysis, ensuring a comprehensive presentation of your achievements and strategies. The template includes dedicated slides for sales objectives, customer testimonials, and pricing strategy, allowing you to showcase your results and future opportunities with clarity. Use the feedback and closing summary slides to leave a lasting impression on your audience. Fully customizable and compatible with PowerPoint, Google Slides, and Keynote, this template is ideal for sales teams, business leaders, and marketers who want to present performance metrics with professionalism and style.


7 slides
Cycle Infographic Presentation Template
A cycle infographic is a visual representation of a repeating pattern of events. This template can be used to show the stages of a process or the sequence of events that make up a cycle. The purpose of this cycle infographic is to provide a clear and easy-to-understand illustration of a repeating pattern, helping to clarify the steps involved and to show the interrelationships between different elements. This well-designed cycle infographic can help you identify areas for improvement, improve communication and collaboration, and support decision-making by providing a view of the cycle.


7 slides
PESTEL Analysis Marketing Infographic
PESTEL Analysis, often referred to as PESTLE Analysis, is a strategic management tool used to analyze and evaluate external macro-environmental factors that can impact an organization. This infographic template is a comprehensive and visually captivating template that unravels the strategic insights derived from the PESTEL analysis in the realm of marketing. Explore the critical external factors that influence your marketing strategy and steer your business towards success. Compatible with Powerpoint, Keynote, and Google Slides. Empower your marketing strategies with our PESTEL Analysis Marketing Infographic!


20 slides
Sylph Design Portfolio Presentation
Dive into a creative journey with this visually striking design portfolio presentation template! Ideal for showcasing design processes, mood boards, and final outcomes, it’s perfect for impressing clients or stakeholders. Highlight your design skills and methodology with this modern, sleek format. Compatible with PowerPoint, Keynote, and Google Slides for seamless integration into your workflow.


6 slides
Macro Environment PESTEL Framework
Navigate market forces with confidence using this dynamic PESTEL framework layout—designed to help you assess Political, Economic, Social, Technological, Environmental, and Legal factors with clarity. Whether for strategy planning or external analysis, this slide keeps your insights visually organized and easy to explain. Fully compatible with PowerPoint, Keynote, and Google Slides.


7 slides
Geometric Sequence Infographic Presentation
Geometric infographics typically involve the use of various shapes to convey different pieces of information. This Geometric Template is a professional way to show your great designworks and ideas. This template can be used in a variety of contexts, from business and marketing to education and journalism. This clean design includes many categories, dividers and icons which will help you show your data in the best way. Start creating your own customized presentation by adding your text, images and other content from your slides, just download in PowerPoint, Keynote or Google Slides.


6 slides
Project Summary and Final Thoughts Presentation
Wrap up your presentation with clarity using the Project Summary and Final Thoughts Presentation. This clean, structured layout helps you highlight key milestones, insights, and takeaways across six points—perfect for recapping project goals and outcomes. Fully customizable and compatible with PowerPoint, Keynote, and Google Slides.


10 slides
Search Engine Optimization (SEO) Strategy Presentation
Present your digital marketing plan with clarity using this vibrant SEO strategy layout. Featuring a magnifying glass infographic at the center and five segmented areas for key actions, this template is ideal for mapping keyword research, on-page optimization, content creation, link building, and performance tracking. Great for marketing agencies, SEO consultants, and website owners. Fully editable in PowerPoint, Keynote, and Google Slides.


8 slides
Biological Structure and Function Presentation
Visualize biological processes with the Biological Structure and Function infographic. Featuring a hexagonal layout, this template allows you to categorize key concepts such as molecular functions, chemical reactions, and biological systems. Fully editable and available for PowerPoint, Keynote, and Google Slides.


7 slides
Stock Market Infographic Presentation Template
The stock market is a global system that operates through electronic communication and trading. It allows buyers and sellers to meet, interact, and transact. This template is perfect if you want to become informed or want to inform someone how the stock market operates. This template comes packed with all the information you need. The market allows for price discovery and serve as a barometer for the overall economy. The stock market is highly transparent, allowing sellers to seek the best price. The illustrations provided are made to help you and your viewer understand the bull and bear market.