


Features
- 11 Unique slides
- Fully editable and easy to edit in Microsoft Powerpoint, Keynote and Google Slides
- 16:9 widescreen layout
- Clean and professional designs
- Export to JPG, PDF or send by email


Do you have any questions?
Recommend


22 slides
Sky Drop Full-Service Agency Project Plan Presentation
Step into the world of strategic creativity with the Sky Drop Agency Project Plan template! Designed for modern agencies looking to impress clients and stakeholders, this template offers a sleek and professional design that highlights your agency's strengths, processes, and successes. With dedicated sections for mission and vision, team introduction, services, and client testimonials, this template provides a comprehensive overview of your agency's capabilities. It's perfect for showcasing case studies, market analysis, and future outlooks, helping you to build trust and establish credibility. Whether you're presenting a new project plan or updating clients on progress, this template ensures your information is communicated clearly and effectively. Fully customizable and compatible with PowerPoint, Keynote, and Google Slides, the Sky Drop template is your go-to for creating presentations that leave a lasting impact. Impress your audience and elevate your agency's brand with this powerful presentation tool!


7 slides
Lifecycle Stages in Customer Experience Presentation
Showcase the full customer journey with this Lifecycle Stages in Customer Experience presentation. Featuring a sleek infinity loop layout, this slide is ideal for visualizing cyclical engagement stages—like acquisition, onboarding, retention, and advocacy. Clean design and labeled touchpoints help convey insights clearly. Fully compatible with PowerPoint, Canva, and Google Slides.
24 slides
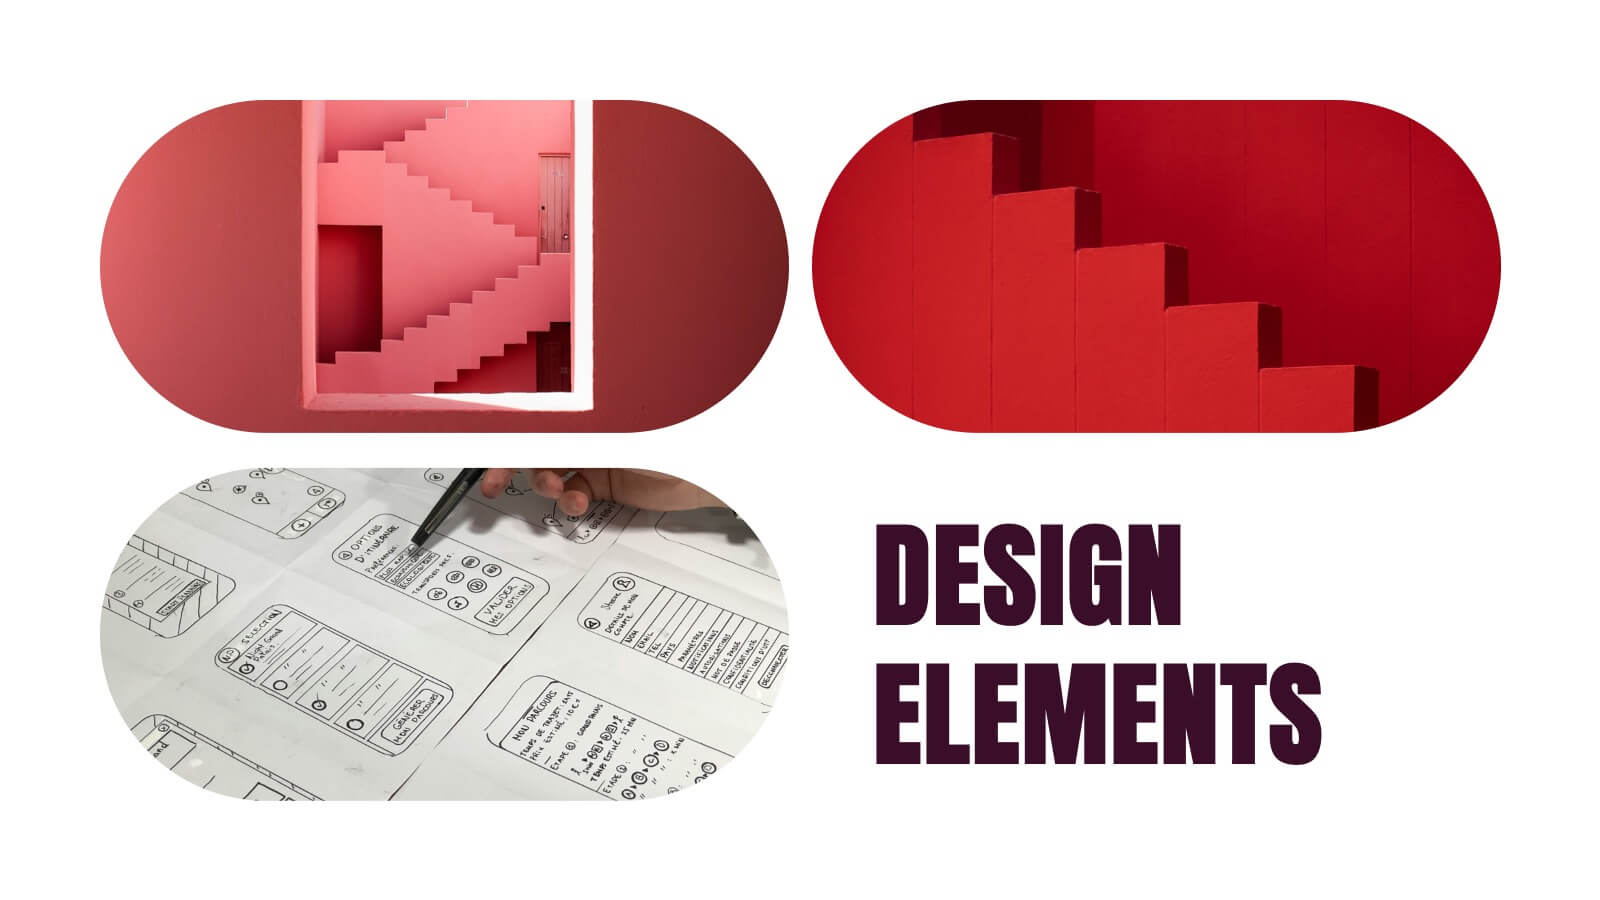
Kismet UX Design Presentation
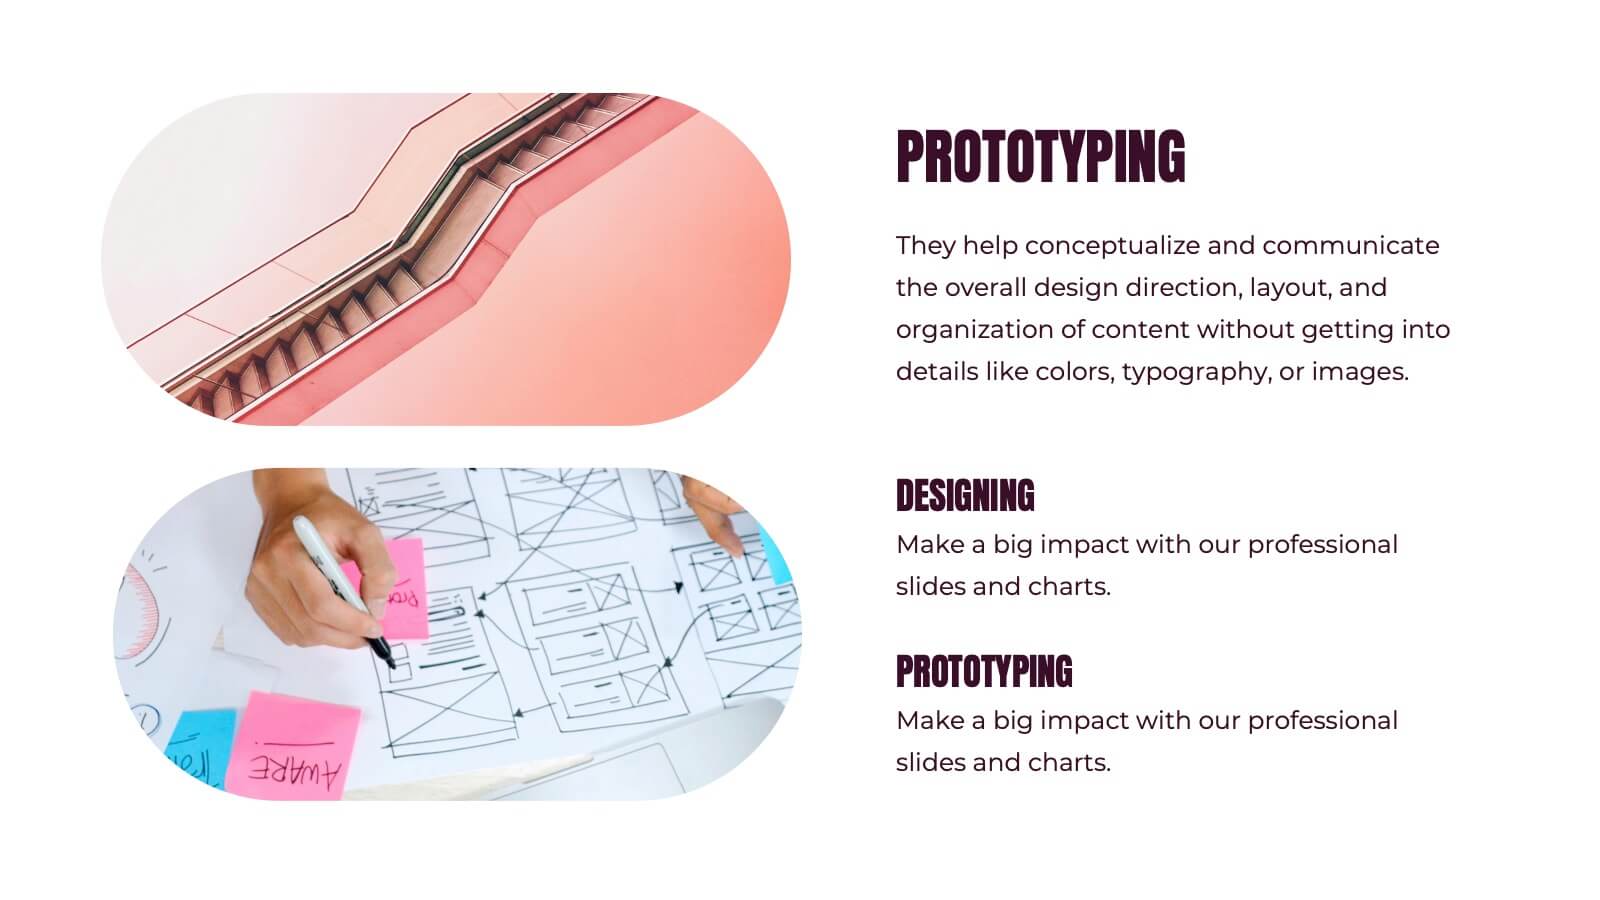
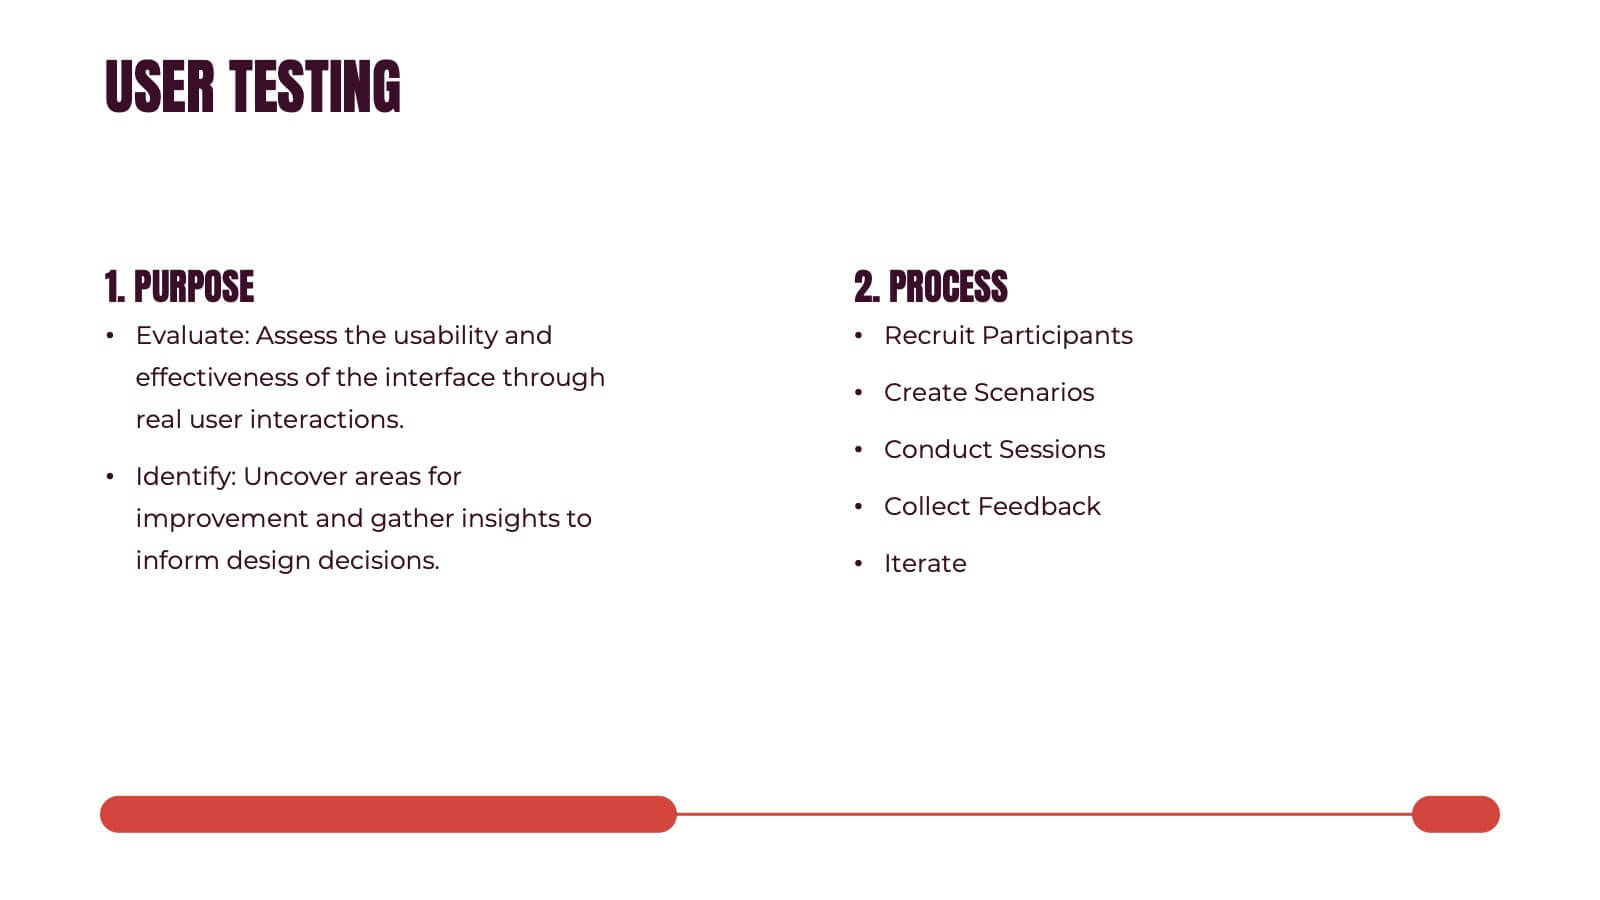
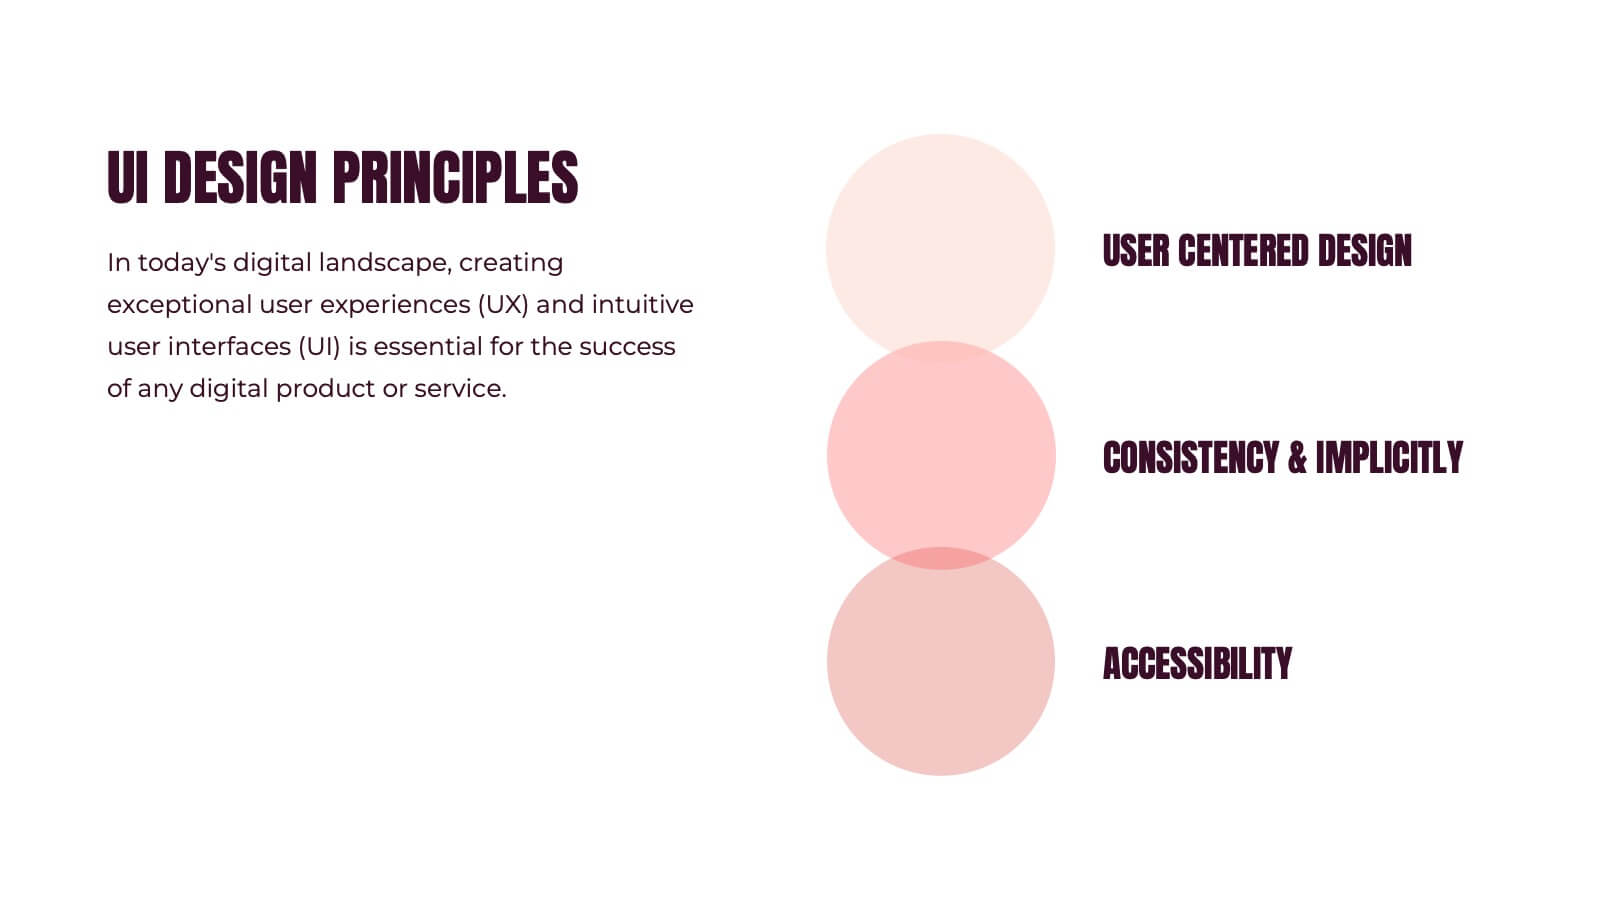
Dive into the world of design with this stunning presentation template! Perfect for explaining user experience concepts, this template covers everything from wireframes to prototyping. It's designed to captivate your audience with visually engaging slides and clear, concise information. Compatible with PowerPoint, Keynote, and Google Slides for effortless use across platforms.


21 slides
Ruby Startup Funding Proposal Presentation
Get ready to pitch your startup in style with this vibrant and engaging presentation template! Perfect for showcasing your startup’s founding story, business model, market analysis, and financial overview, this template ensures you’ll impress potential investors. Fully customizable and compatible with PowerPoint, Keynote, and Google Slides, it’s ideal for securing funding and support.


5 slides
5-Stage Growth Plan Presentation
Take your audience on a visual journey through each phase of success with this sleek step-by-step presentation. Designed to illustrate progress, milestones, and development stages clearly, it’s ideal for business planning or strategy discussions. Fully editable and compatible with PowerPoint, Keynote, and Google Slides for effortless customization.


26 slides
Beauty Products Company Profile Presentation
A beauty products company is a business that specializes in the development, manufacturing, marketing, and sale of various beauty and skincare products. This presentation template is designed to showcase your cosmetics and skincare brand in the most captivating and alluring way possible. With a blend of elegance and modernity, this template is your beauty brand's ticket to leaving a lasting impression on clients, investors, and partners. Fully customizable and compatible with Powerpoint, Keynote, and Google Slides. The sophisticated color palette will reflect the elegance of your beauty company.


4 slides
Leadership Training Framework Presentation
Inspire growth and guide your team toward success with this clear and modern presentation layout. Designed to illustrate leadership principles, development stages, and coaching strategies, it helps communicate training goals with professionalism and ease. Fully customizable and compatible with PowerPoint, Keynote, and Google Slides for seamless use across platforms.


6 slides
Tech Infrastructure Strategy Presentation
Build a smarter foundation for your tech-driven goals with a clear, layered design that showcases every stage of your technology roadmap. Perfect for presenting IT systems, cloud migration, or infrastructure planning, this presentation ensures clarity and impact. Fully compatible with PowerPoint, Keynote, and Google Slides for smooth customization.


21 slides
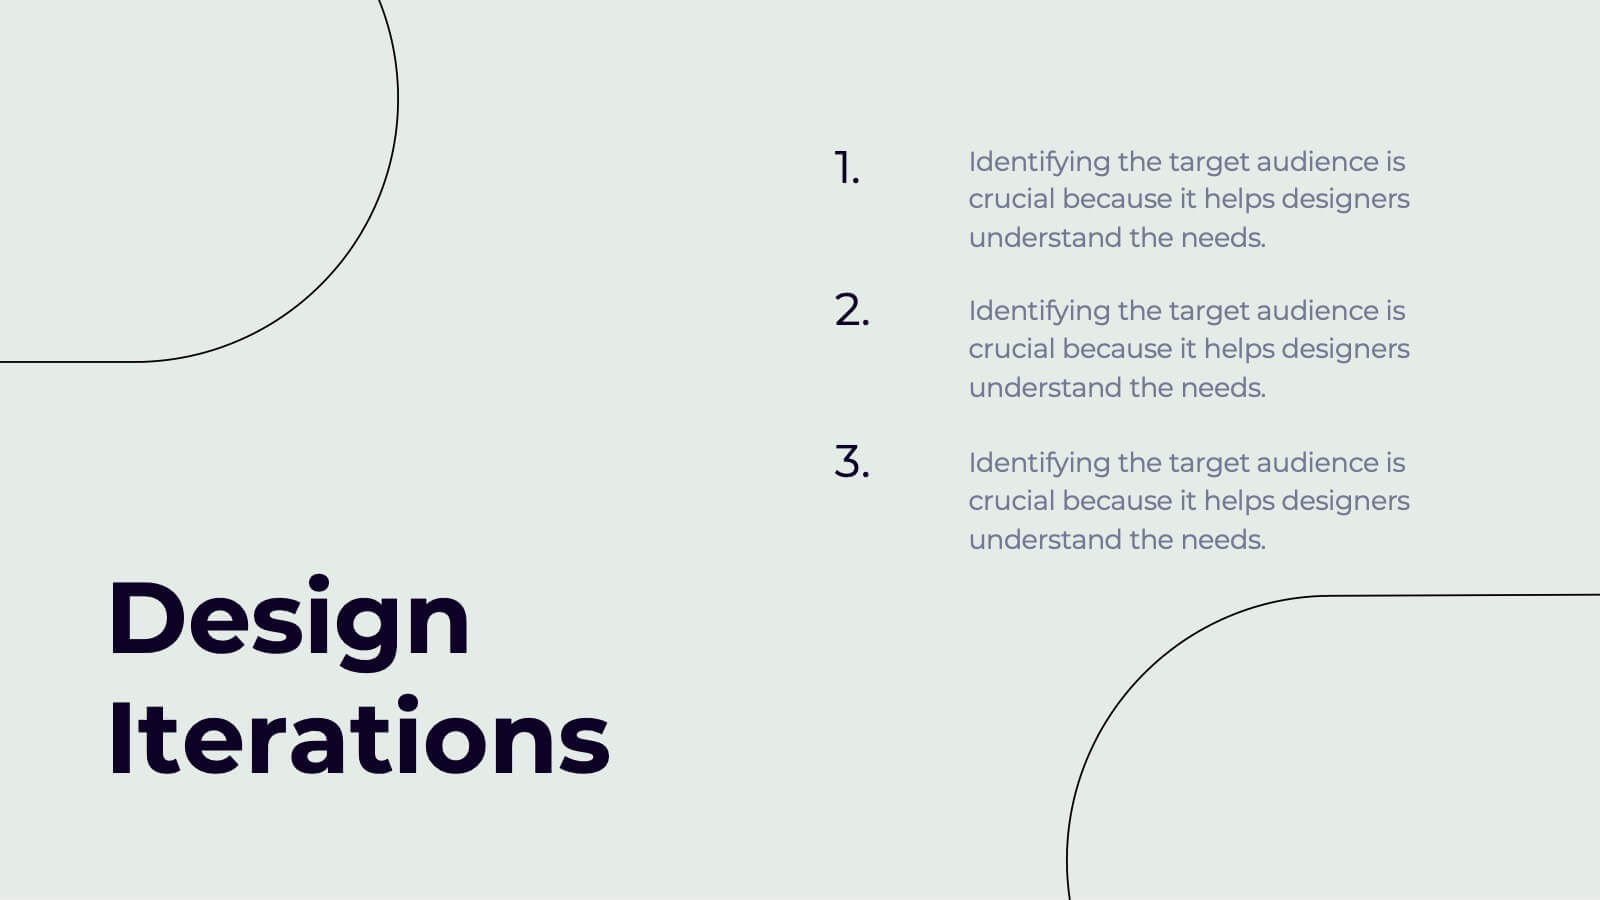
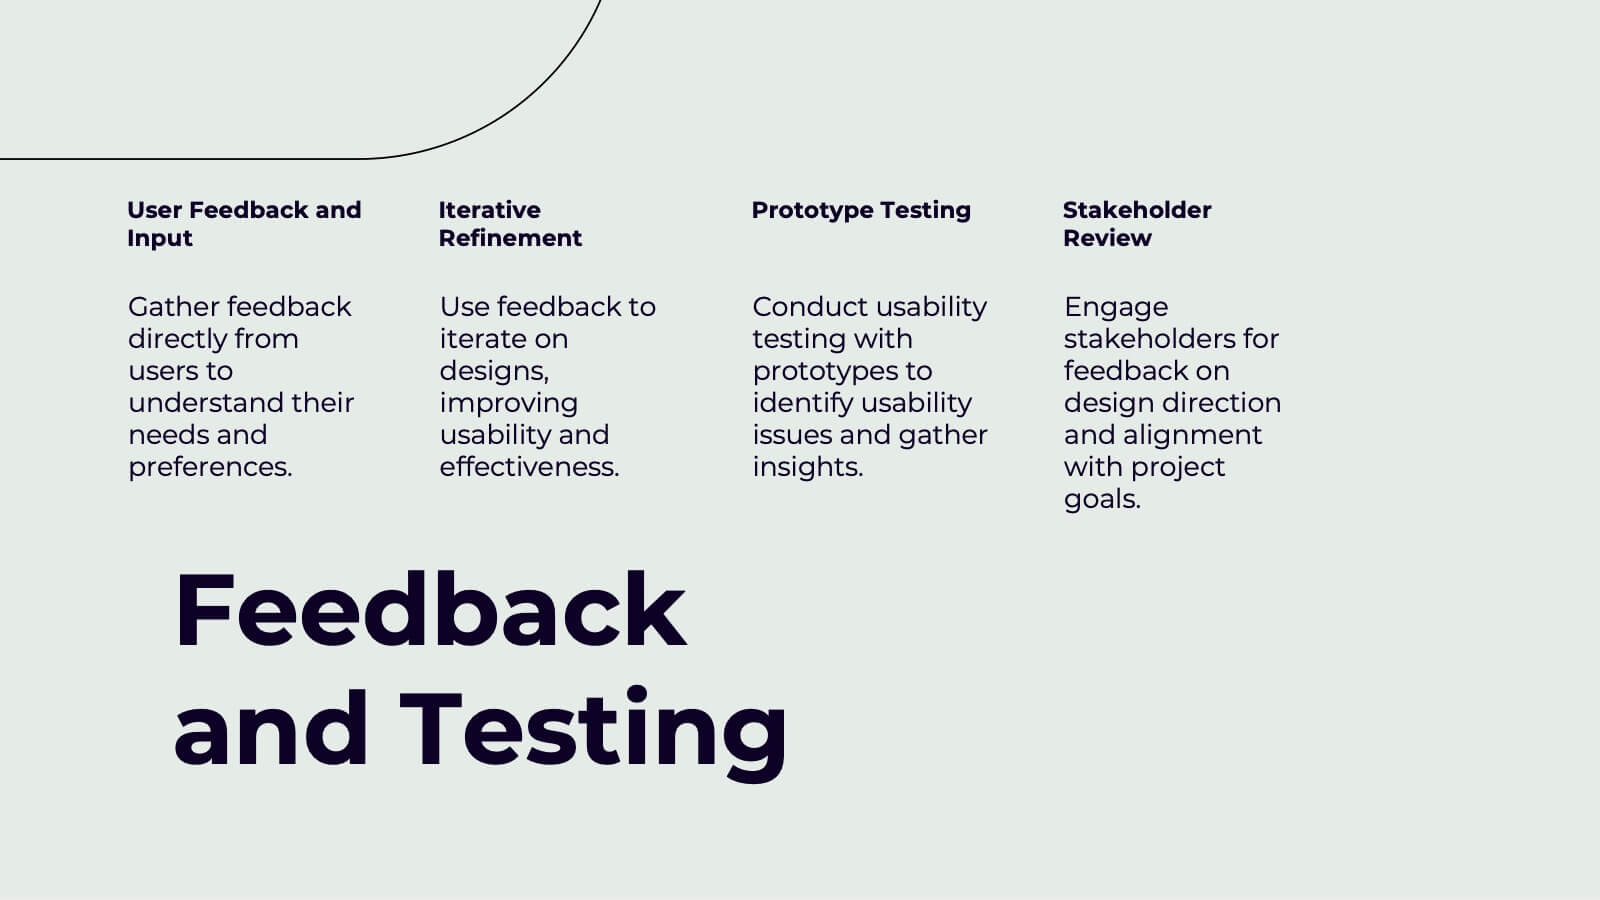
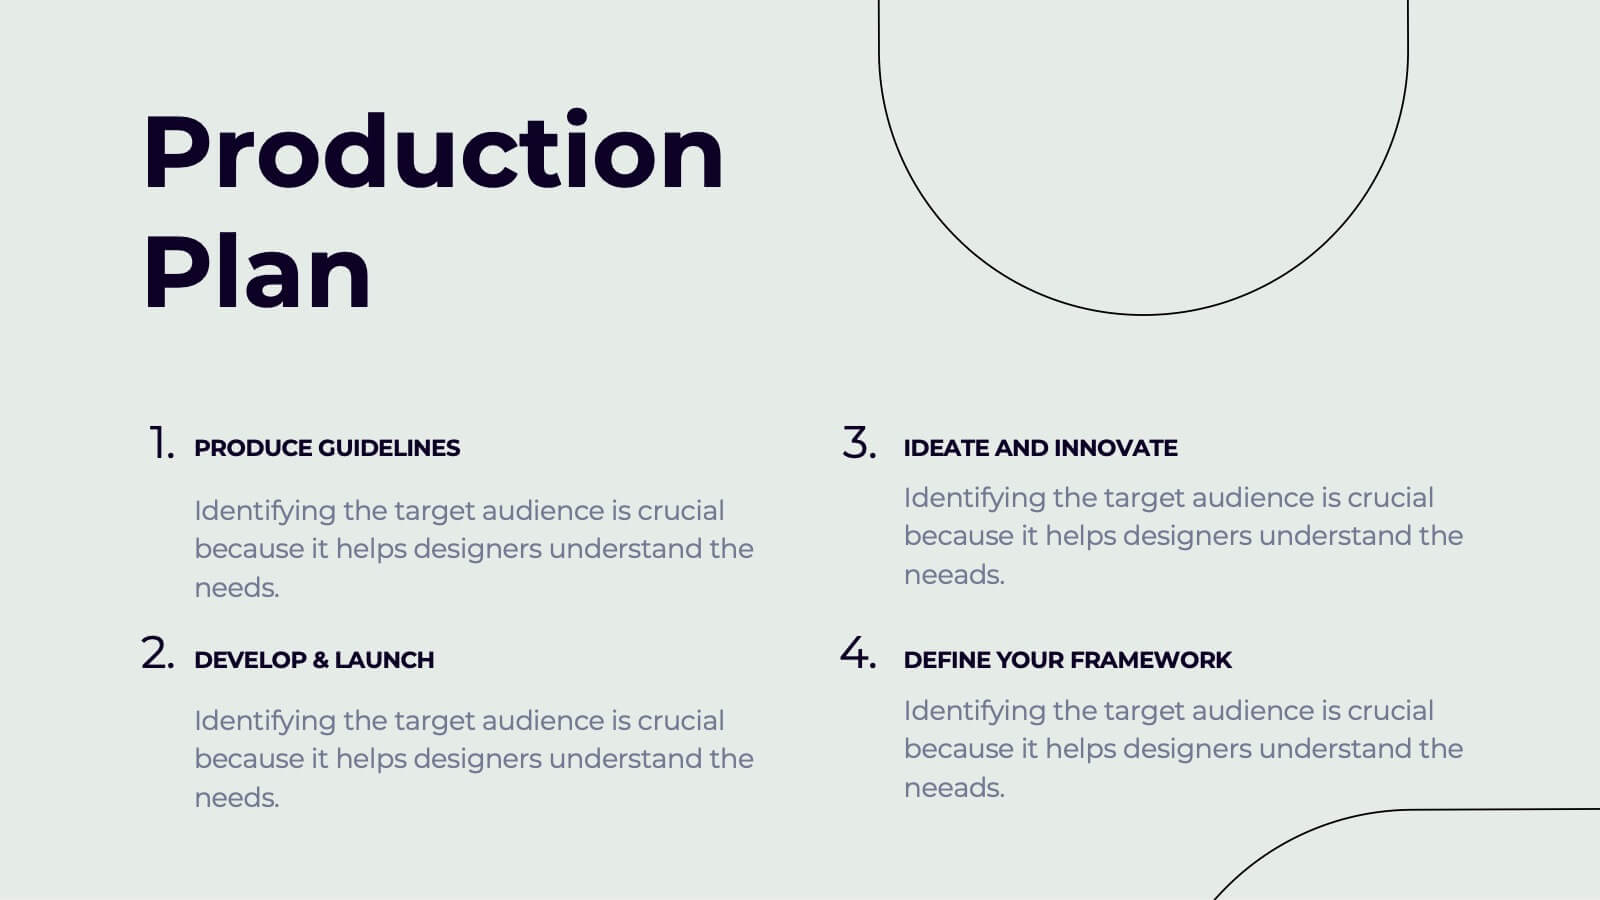
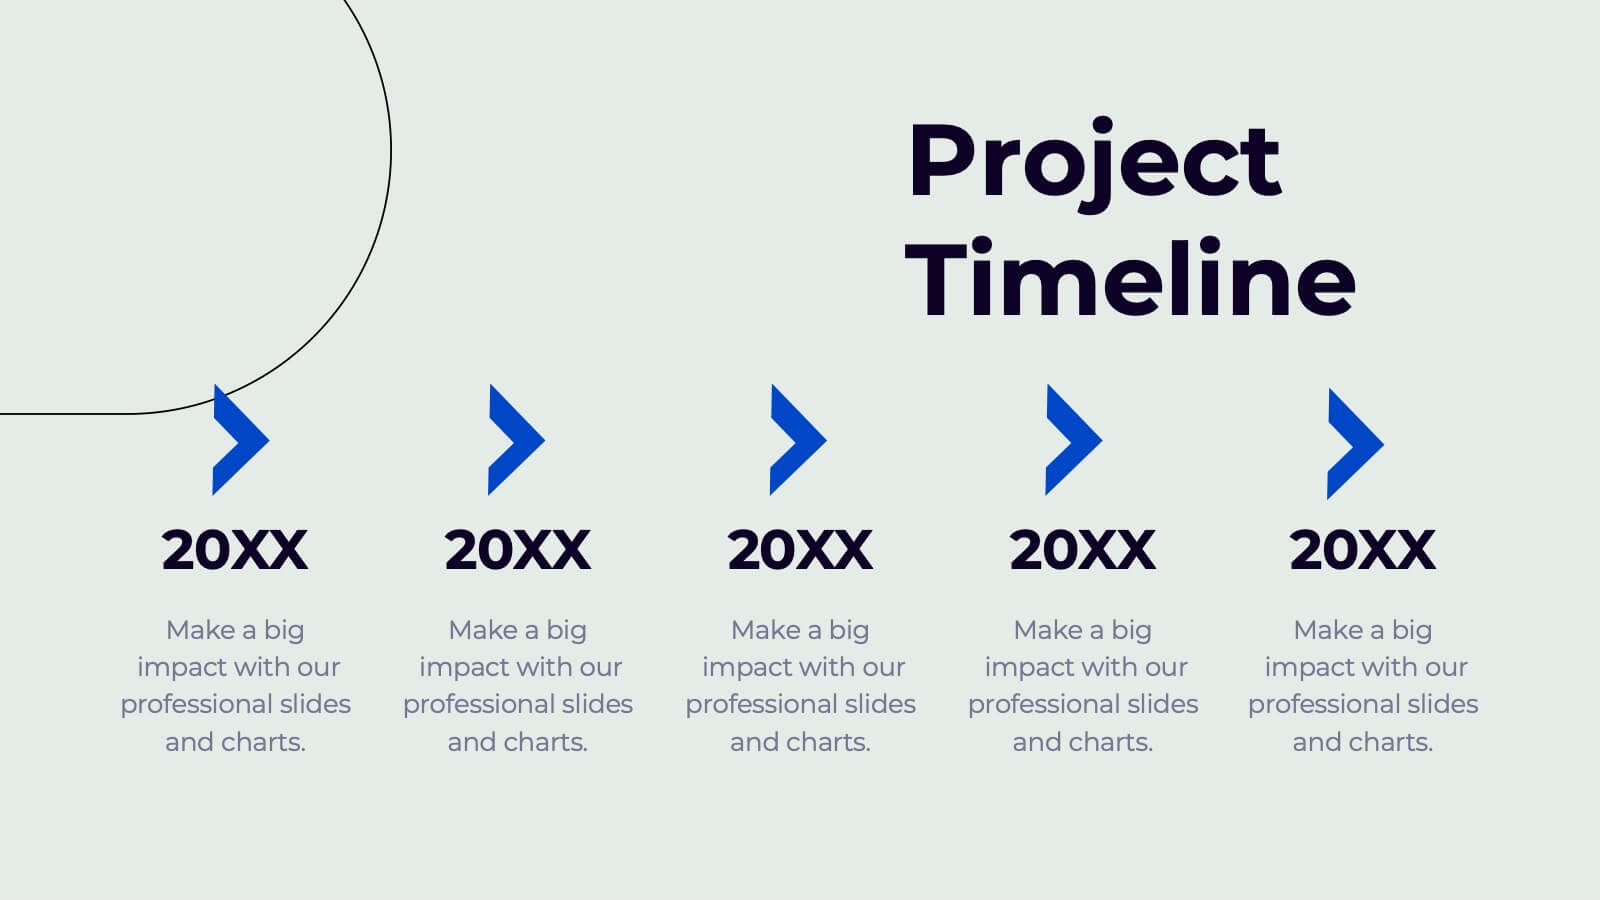
Yeti Creative Design Report Presentation
This modern design report template covers everything from concept development to design iterations and feedback testing. It’s visually striking, with sections for color schemes, typography, textures, and production plans. Ideal for showcasing creative projects and delivering professional presentations. Compatible with PowerPoint, Keynote, and Google Slides for ease of use.


6 slides
Business Strategy Pyramid Presentation
Outline your strategic priorities with clarity using the Business Strategy Pyramid Presentation. This template features a five-step 3D pyramid that highlights key business goals, initiatives, or stages. Each layer includes icons and numbered sections for easy interpretation. Ideal for strategy meetings, executive briefings, and growth plans. Fully editable in PowerPoint, Keynote, and Google Slides.


20 slides
Aurorium Sales Proposal Presentation
Win over clients with confidence using this sleek and modern sales proposal presentation. Designed to highlight key business strategies, pricing plans, competitive analysis, and future opportunities, this template helps you communicate your value with clarity and impact. Fully customizable and compatible with PowerPoint, Keynote, and Google Slides for seamless presentations.


6 slides
Top Priorities Business List Presentation
Streamline your workflow with this structured priorities list template. Designed for business professionals, it visually organizes key tasks, helping teams focus on top objectives efficiently. With a clean and modern design, it's ideal for strategic planning, productivity tracking, and project management. Fully compatible with PowerPoint, Keynote, and Google Slides.


10 slides
Strategic Business Action Plan Presentation
Create a roadmap for success with the Strategic Business Action Plan presentation. This well-structured template provides a clear, step-by-step framework for executing business strategies, making it ideal for corporate teams, entrepreneurs, and business consultants. Its modern design ensures effective communication of key goals and objectives. Fully customizable and compatible with PowerPoint, Keynote, and Google Slides.


20 slides
Dreamspire Academic Research Report Presentation
Present your research findings with impact using this bold and dynamic report template! It includes essential sections such as objectives, methodology, key findings, and future research directions, ensuring a comprehensive overview. Perfect for academic, business, or industry research presentations, this template is fully compatible with PowerPoint, Keynote, and Google Slides.


6 slides
COVID-19 Impact on Business Presentation
Visually communicate the key effects of the pandemic with this clean and engaging slide layout. Featuring a central storefront icon surrounded by six customizable virus-themed icons, this design allows you to outline critical changes, challenges, or strategic shifts. Ideal for presentations on crisis management, business continuity, or recovery planning. Fully editable in PowerPoint, Keynote, and Google Slides.


4 slides
Business Milestone Roadmap Presentation
Visualize your company's journey with this curved-road milestone infographic. Perfect for tracking key goals, quarterly achievements, or strategic plans, this template uses clear markers along a winding path to emphasize progress and direction. Ideal for business updates, project timelines, or growth strategies. Fully editable in PowerPoint, Keynote, and Google Slides.


5 slides
Four-Step Customer Experience Framework Presentation
Showcase your customer journey with this sleek, step-by-step visual. Featuring a stair-step arrow design, it’s ideal for highlighting stages in user experience, onboarding, or service improvement. Each step is editable, with icons and titles for clarity. Compatible with PowerPoint, Keynote, and Google Slides—perfect for marketers, strategists, and CX professionals.