


Features
- 26 Unique slides
- Fully editable and easy to edit in Microsoft Powerpoint, Keynote and Google Slides
- 16:9 widescreen layout
- Clean and professional designs
- Export to JPG, PDF or send by email.


Do you have any questions?
Recommend

21 slides
Spectrum Project Timeline Presentation
Plan and execute your projects with precision using this detailed project plan template! Perfect for outlining objectives, timelines, and resource allocation. Ideal for project managers and teams aiming to ensure successful project delivery. Compatible with PowerPoint, Keynote, and Google Slides, this template keeps your project organized, clear, and on track. Ensure project success!


5 slides
Project Summary and Executive Highlights Presentation
Summarize key milestones with this Project Summary and Executive Highlights slide. Featuring a clean horizontal layout with icons and numbered steps, it’s perfect for spotlighting major achievements, phases, or metrics. Use it to present updates with clarity and professionalism. Fully editable in PowerPoint, Google Slides, or Canva.


26 slides
Haeleigh Presentation Template
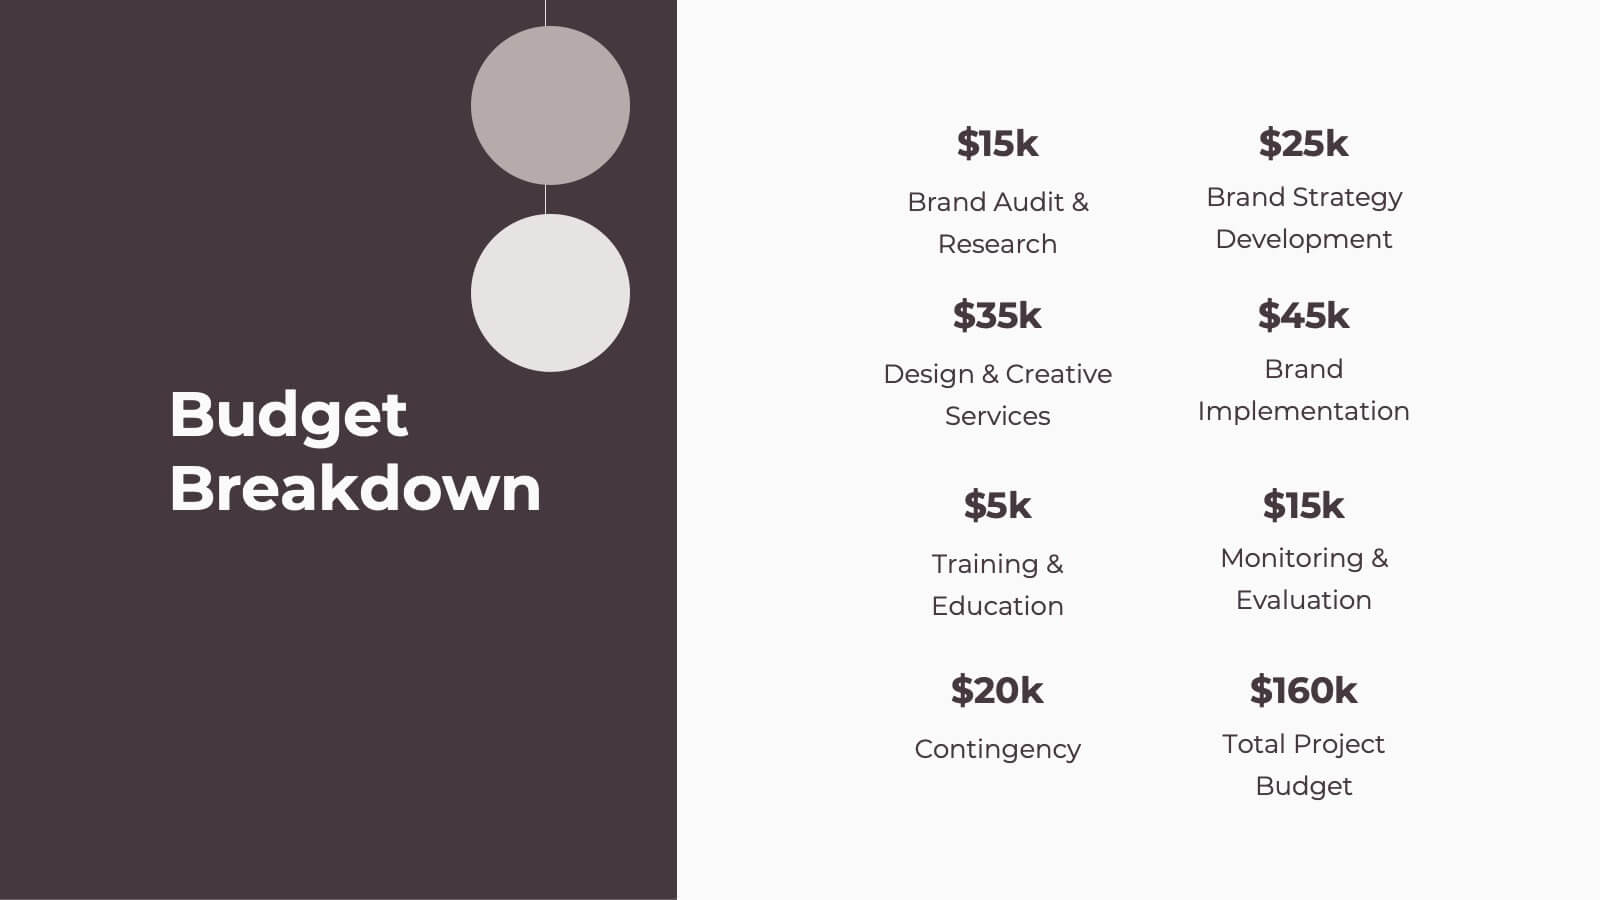
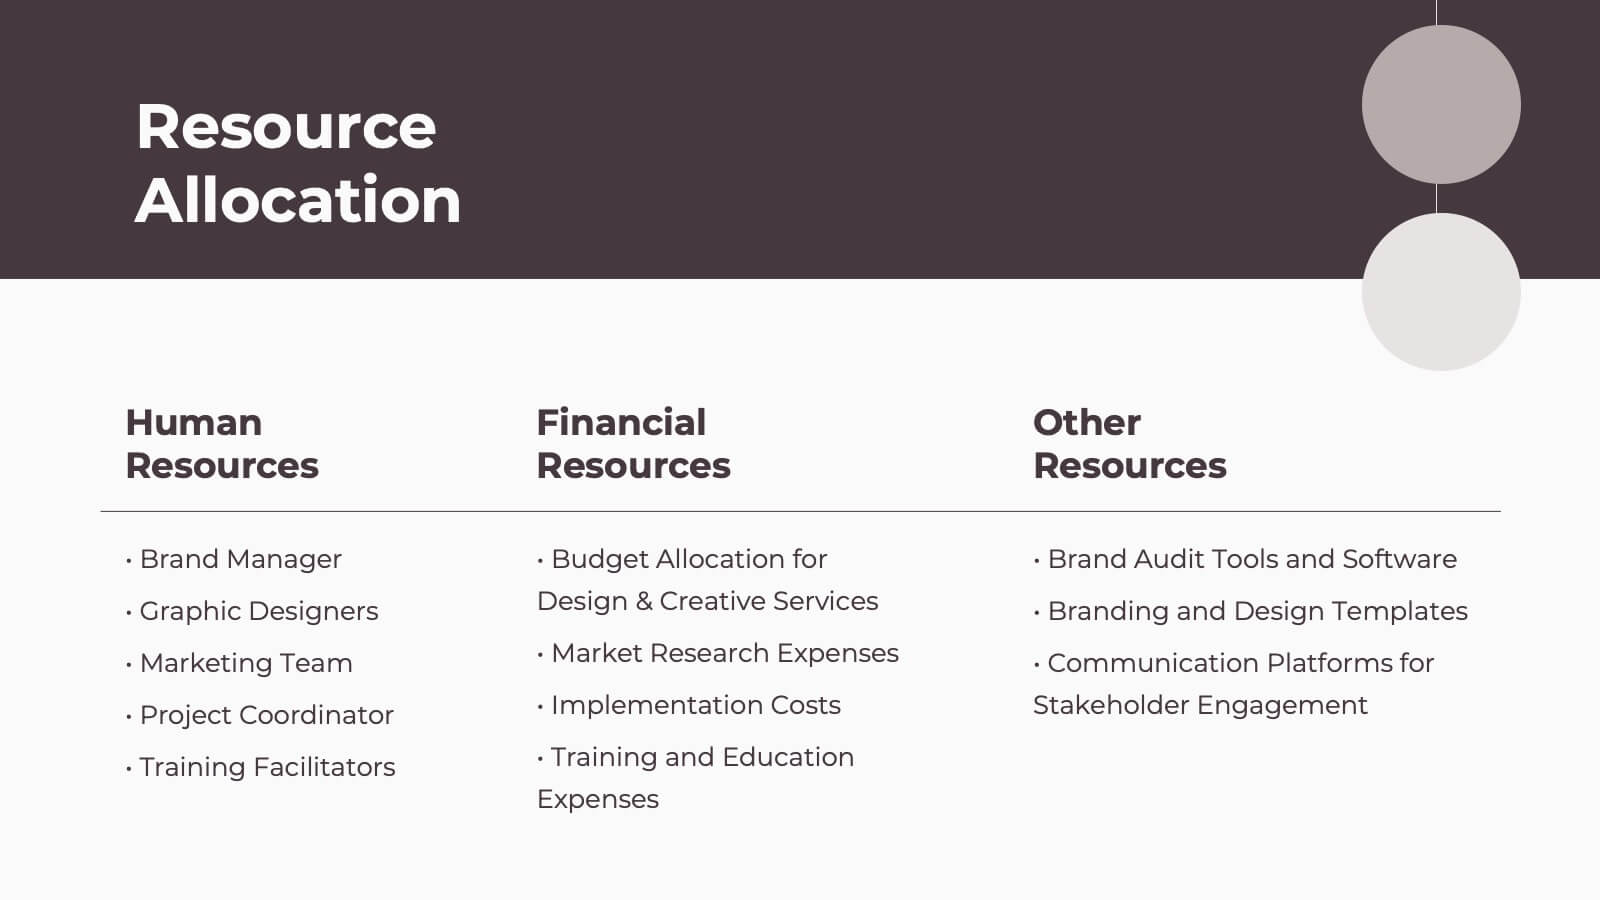
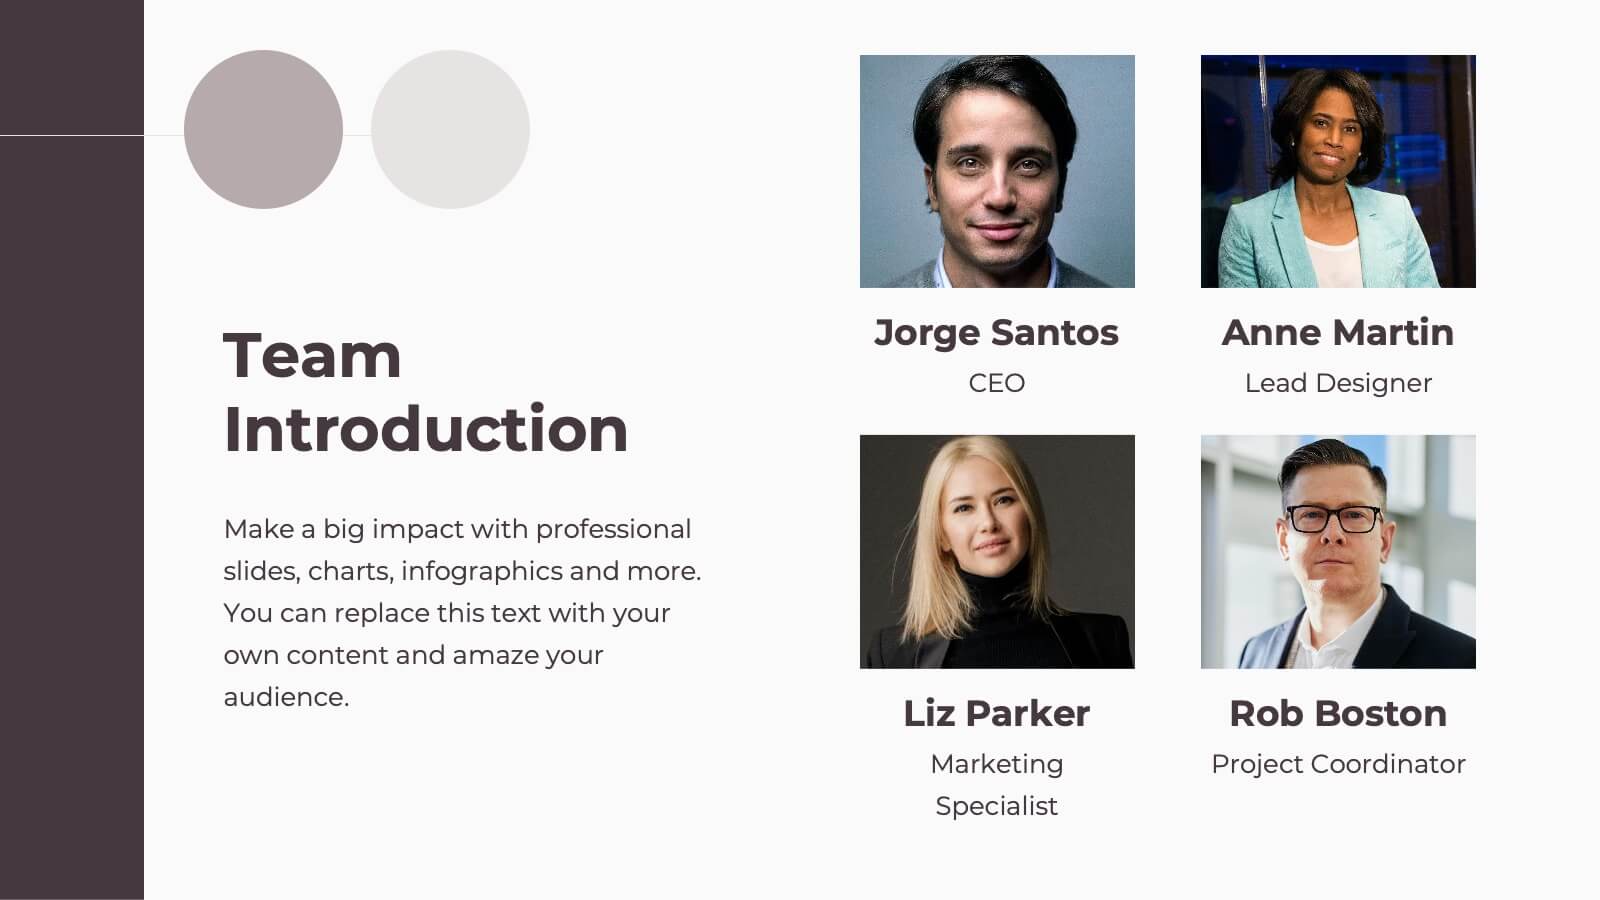
The Haeleigh Powerpoint Template is a 26 modern slide template that is perfect for any presentation. With a clean classy aesthetic and easy to read text, this template is ideal for reading content and looking professional. The use of nude colors helps keep the look clean and easy to read. The theme comes packed with features to target your audience and help you get your message across. The charts, graphics, timelines included are easy to edit. This template is also perfect for businesses seeking to make an impression on their audience. Haeleigh is mobile friendly and easy to navigate.


6 slides
Iceberg Visualization Business Concept Presentation
Make your message stand out with a bold visual that reveals what lies above and below the surface. This presentation uses a clear iceberg structure to help explain business concepts, hidden insights, and layered ideas with ease. Perfect for strategy, planning, and analysis. Compatible with PowerPoint, Keynote, and Google Slides.


5 slides
Editable Data Charts Presentation
Bring your data to life with a clean, engaging layout that makes every insight easy to understand. This presentation helps you explain percentages, comparisons, and key metrics with clarity while keeping your narrative smooth and professional. Designed for clear data storytelling and effortless editing, it's fully compatible with PowerPoint, Keynote, and Google Slides.


26 slides
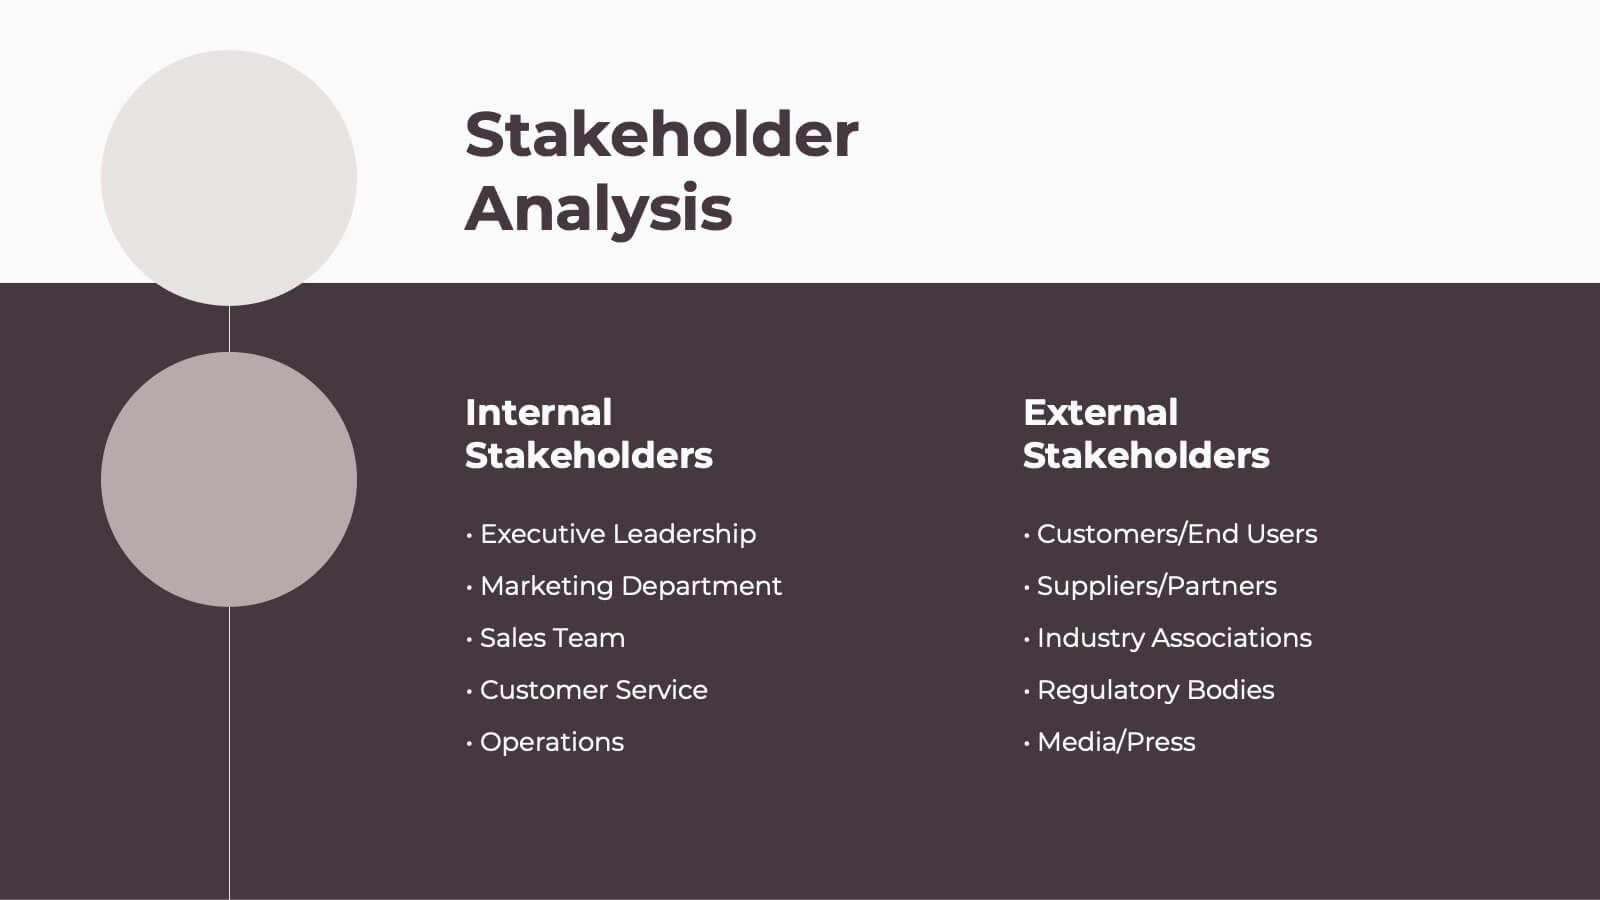
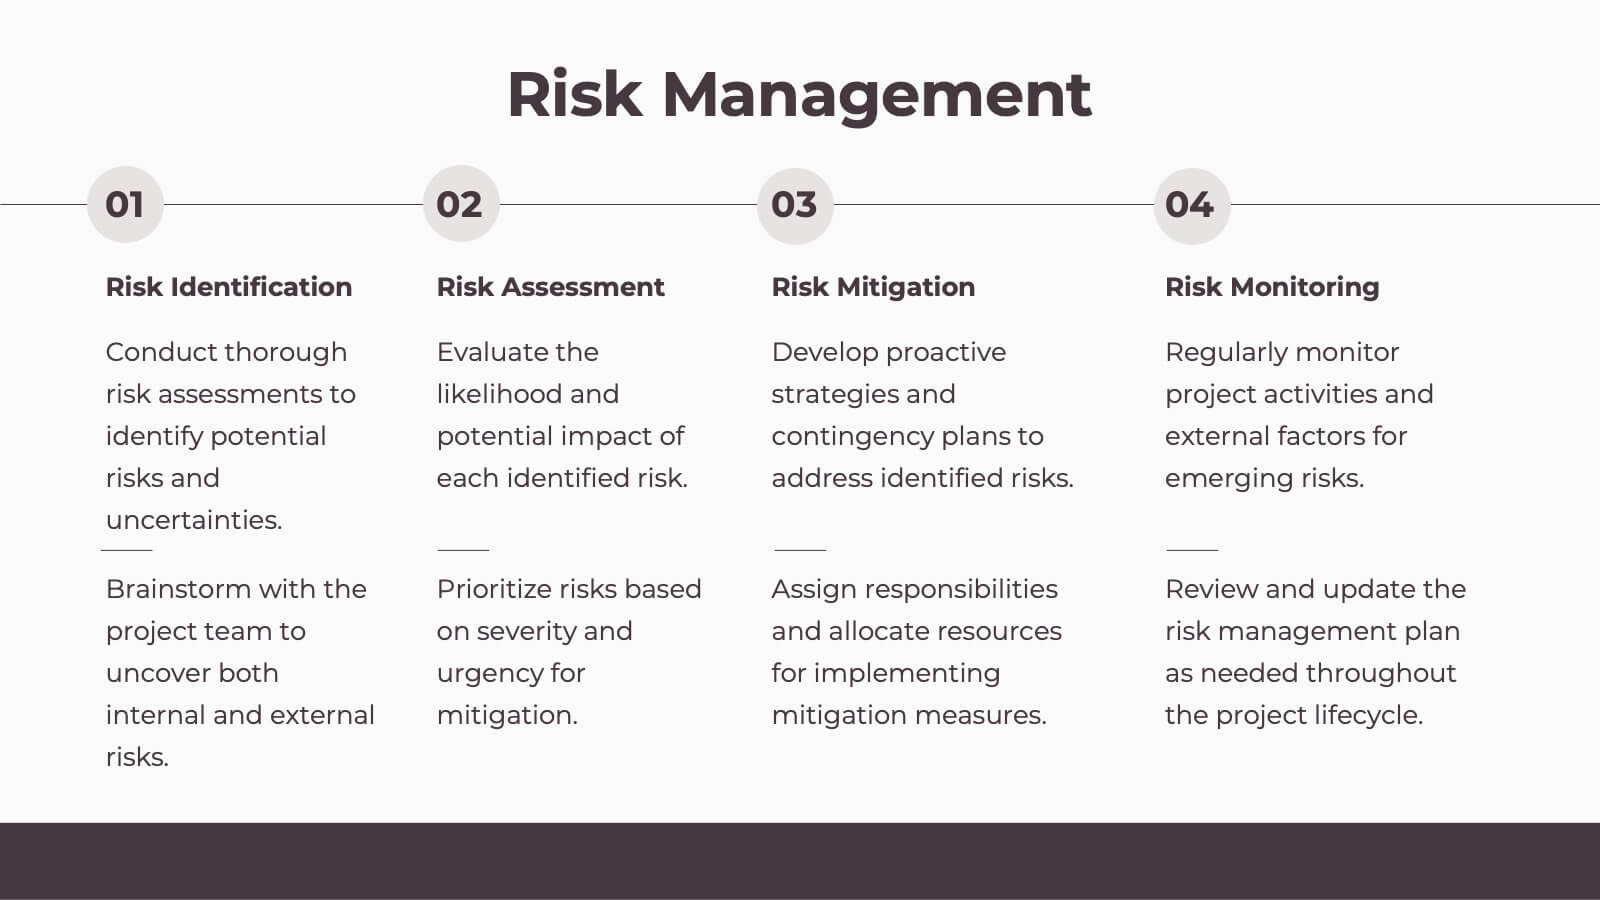
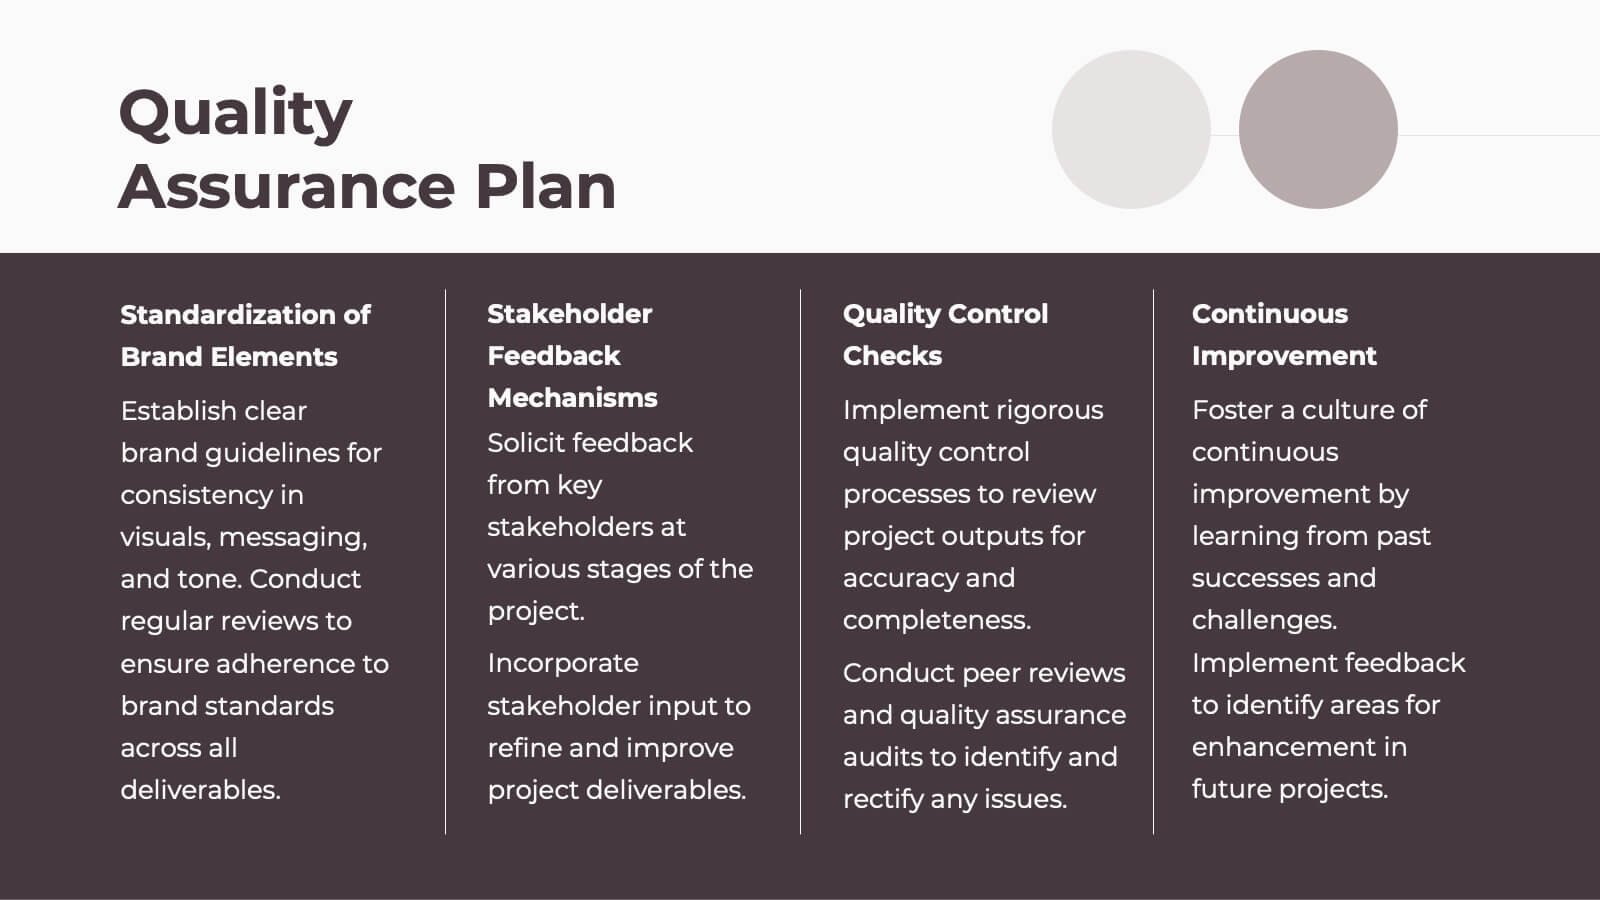
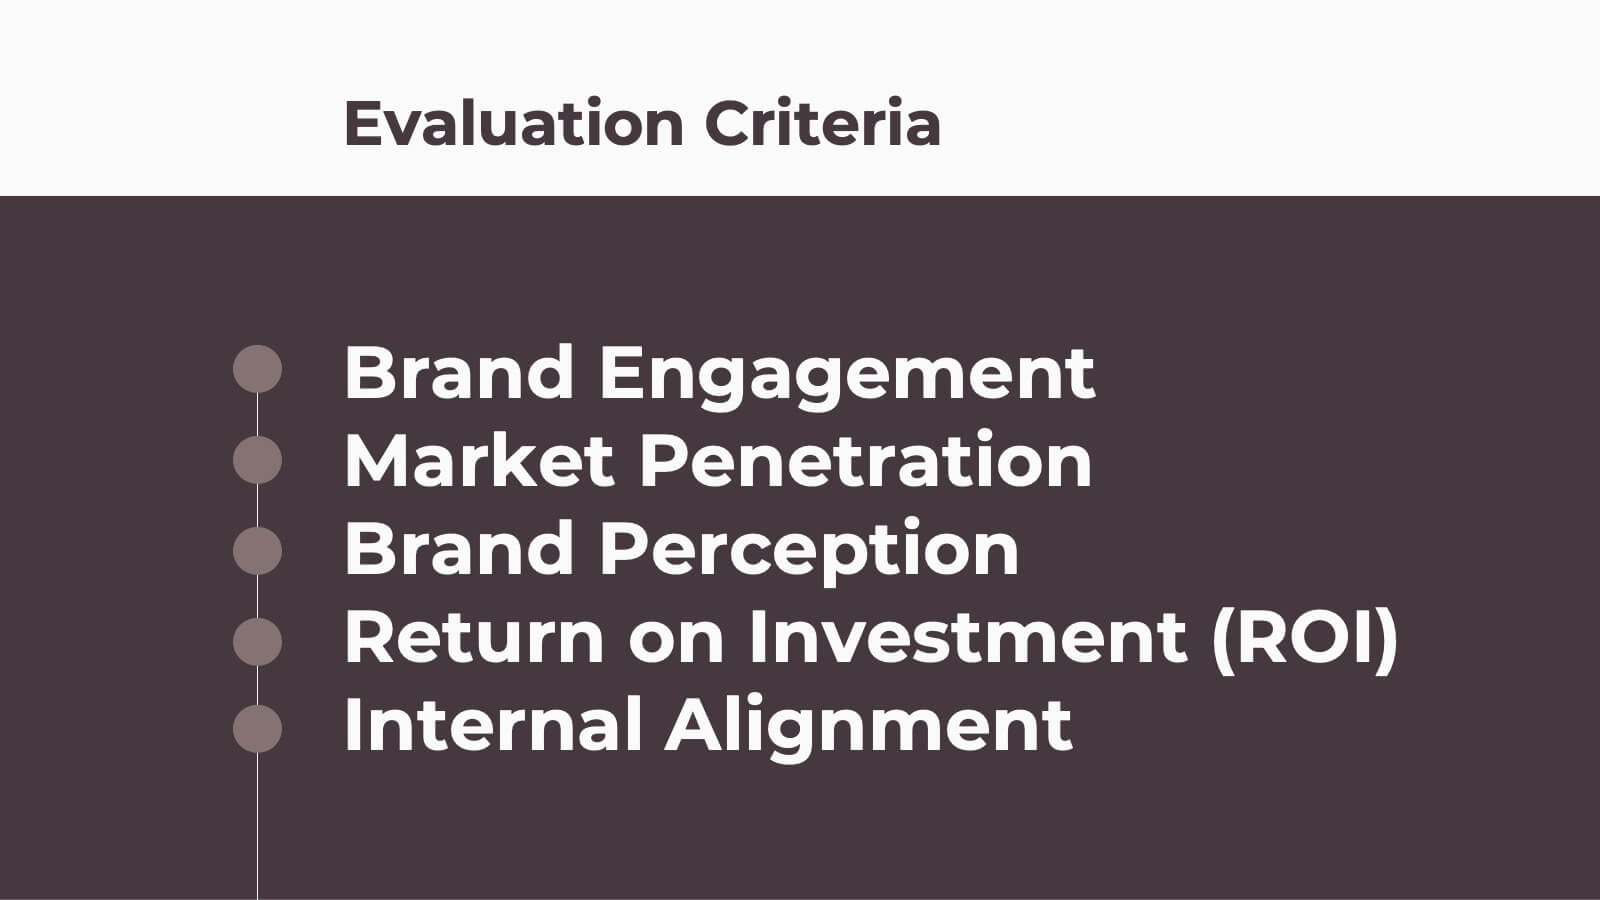
Wilten Presentation Template
This template is a design foundation, and has been built with modern esthetic principles. The shapes are organic and earthy, with image place holders to allow customization. Designed for companies that have a strong connection to nature and the aesthetic, who wants to go beyond just being organic. Wilten template allows you to save time while getting the best result possible. A great clean modern template for creative agencies, business or branding deck. Enhance your presentations with this minimalistic design and impress your audience with smart ideas.


7 slides
Butterfly Visualization Layout Presentation
Bring balance and clarity to your data storytelling with a sleek, symmetrical design that connects ideas seamlessly. This presentation is ideal for visualizing comparisons, workflows, or interconnected topics in a clean and engaging format. Fully customizable and compatible with PowerPoint, Keynote, and Google Slides.


8 slides
Tourism Strategy and Location Guide Presentation
Planning a strategy that inspires wanderlust? This sleek presentation template helps organize global tourism goals with location-based insights, iconic visuals, and easy-to-edit layout sections. Perfect for destination marketing, regional analysis, or travel business pitches. Fully compatible with PowerPoint, Keynote, and Google Slides for effortless editing and impactful delivery.


6 slides
Corporate Sustainability Management Presentation
Step into the future of business with our Corporate Sustainability Management Presentation template. Perfect for strategists seeking to integrate eco-friendly practices, this template facilitates effective communication of sustainability goals and initiatives. It’s a powerful tool for illustrating how environmental strategies can be interwoven with business objectives to foster long-term growth. Tailored for presentations on PowerPoint, Keynote, and Google Slides, it helps leaders inspire action and commitment to sustainability across their organizations.


7 slides
Strategic Business Execution Playbook Presentation
Streamline your execution roadmap with this Strategic Business Execution Playbook. Featuring a sleek, step-by-step layout, it’s ideal for showcasing business stages, workflows, or strategic planning phases. Easy to customize in PowerPoint, Keynote, and Google Slides, this template helps teams visualize priorities and align goals with precision and clarity.


7 slides
Property Market Forecast and Trends Presentation
Present your real estate insights clearly with this Property Market Forecast and Trends Presentation. Featuring a central isometric house graphic surrounded by six editable segments, this layout is perfect for highlighting key indicators like market trends, pricing shifts, and investment zones. Use the icons and color-coded areas to enhance clarity. Ideal for housing reports and investor decks. Fully compatible with PowerPoint, Canva, Keynote, and Google Slides.


6 slides
Machine Learning and Data Science Presentation
Deliver insights with precision using this data-driven presentation template tailored for machine learning, AI, and analytics topics. Featuring a central hub-and-spoke design, this layout allows you to showcase key components like algorithms, tools, processes, or data sources. Each segment includes clean icons and customizable titles for seamless editing. Ideal for data scientists, tech professionals, and academic presentations. Fully editable in PowerPoint, Keynote, and Google Slides.


6 slides
3D Diagram Slide Presentation
Bring your ideas to life with this modern 3D visual layout that adds depth and clarity to any concept. Ideal for breaking down complex information into four connected sections, it enhances understanding through visual hierarchy. Fully customizable and compatible with PowerPoint, Keynote, and Google Slides for effortless use.


23 slides
Starbloom Corporate Strategy Report Presentation
This Corporate Strategy Report Presentation Template provides a sleek and professional layout to present business insights, market opportunities, and strategic goals. It covers essential aspects like SWOT analysis, financial performance, risk management, and future outlook, making it perfect for corporate reports and investor briefings. Fully editable in PowerPoint, Keynote, and Google Slides.


22 slides
Quantum Scientific Research Presentation
Present your scientific research with this comprehensive and professional template! Perfect for detailing research objectives, methodology, and key findings. Ideal for researchers and academics aiming to share their work clearly and effectively. Compatible with PowerPoint, Keynote, and Google Slides, this template ensures your scientific presentations are thorough, engaging, and visually appealing.


26 slides
Textures Company Profile Black Presentation
A company profile is a concise document that provides an overview of a business, its history, products or services, achievements, mission, vision, values, and other relevant information. This presentation template is designed for businesses to showcase their brand identity and services in an elegant and professional manner. With a dominant black color theme, this presentation exudes a sense of modernity and class, making it perfect for businesses in various industries. Introduce your company's history, mission, and values in a concise and compelling manner. Utilize the clean and clear typography to maintain a professional and sophisticated look.


5 slides
Overlapping Venn Chart Presentation
Bring ideas together with a bold visual that highlights how multiple concepts overlap to form stronger insights. This presentation makes comparison and connection effortless using smooth layered shapes and clear labels. Fully editable and compatible with PowerPoint, Keynote, and Google Slides.