


Features
- 4 Unique slides
- Fully editable and easy to edit in Microsoft Powerpoint, Keynote and Google Slides
- 16:9 widescreen layout
- Clean and professional designs
- Export to JPG, PDF or send by email


Do you have any questions?
Recommend


5 slides
Business Vision Statement Presentation
Focus on the future with our "Business Vision Statement" presentation template, ideal for outlining your company's aspirations. This visually engaging template helps you present your business's core values and long-term goals, ensuring alignment across the organization. Perfect for strategic meetings and stakeholder presentations, it is compatible with PowerPoint, Keynote, and Google Slides. This template is a crucial tool for leaders looking to inspire and direct their teams towards common objectives.


26 slides
Soren Presentation Template
Soren is a cool, clean, simple easy to use template. This beautiful template is great for all types of businesses and creative projects. The colors are bold and simple to capture the audience needs. Soren is a multipurpose theme that can be used to capture the attention of your clients in a friendly, unique way. This template is a minimalistic design to attract your customers. The simple text, charts and tables make it easy to customize this template to match your brand. Whether you’re in need of a business presentation, newsletter or even social media posts – Soren is the perfect fit for you.


5 slides
Puzzle-Based Team Alignment Strategy Presentation
Bring collaboration to the forefront with the Puzzle-Based Team Alignment Strategy Presentation. This creative layout uses interlocking puzzle pieces to represent interconnected team roles, milestones, or initiatives—perfect for showcasing synergy and strategic cohesion. Each section is color-coded and icon-enhanced for quick visual recognition, making it ideal for team briefings, onboarding, or workflow planning. Fully editable in PowerPoint, Keynote, and Google Slides.


4 slides
Circular Data Flow in Systems Presentation
Visualize relationships and flow within your systems using the Circular Data Flow in Systems Presentation. Ideal for showcasing input-output dynamics, data loops, or stakeholder interaction, this diagram presents centralized nodes with surrounding connectors for clarity. Each element is editable and works seamlessly in PowerPoint, Google Slides, and Canva.


5 slides
Business Planning and Execution Presentation
Align your business objectives and execution plan with this modern, arrow-themed presentation slide. Featuring four sequential sections with bold icons and customizable titles, this layout is perfect for showcasing milestones, KPIs, or phases of a strategic process. Designed for clarity and impact, it's compatible with PowerPoint, Keynote, and Google Slides.


6 slides
Numeric Data Slide Layout Presentation
Bring your numbers to life with a clean, flowing visual that turns data into an easy-to-follow story. This presentation guides viewers through each step of your process, helping them understand key insights without overwhelm. Ideal for analytics, reporting, and planning. Fully compatible with PowerPoint, Keynote, and Google Slides.


26 slides
Coffee Shop Warm Company Profile Presentation
Coffee shops have become an important part of modern culture, especially in urban areas, and they come in various styles and themes. This presentation template is designed to bring the essence of your coffee haven to life. From the first sip to the last drop, let this presentation showcase the soul-warming experience your coffee shop provides. Fully customizable and compatible with Powerpoint, Keynote, and Google Slides. Utilize warm colors like browns, oranges, and yellows to evoke a cozy, comforting atmosphere. The template integrates coffee cup icons, latte art, and coffee bean graphics for a coffee-centric theme.


10 slides
Six Sigma Process Improvement
Visualize each stage of the Six Sigma DMAIC methodology—Define, Measure, Analyze, Improve, and Control—with this circular diagram layout. Perfect for quality control meetings, workflow optimization, and training sessions. Fully customizable in PowerPoint, Keynote, and Google Slides.


5 slides
Risk Coverage and Claims Process Presentation
Visualize your risk levels and claims procedures with this Risk Coverage and Claims Process slide. The thermometer-style graphic clearly represents stages of coverage or escalation. Ideal for insurance, compliance, or legal teams. Fully editable and compatible with PowerPoint, Keynote, and Google Slides to match your branding and workflow needs.


4 slides
Workflow Phases and Team Coordination Presentation
Clarify responsibilities and sequence with the Workflow Phases and Team Coordination Presentation. This structured diagram template helps visualize how tasks move through different phases and how teams interact at each step. Perfect for project managers, team leads, and operations specialists looking to streamline collaboration. Compatible with PowerPoint, Keynote, and Google Slides.


10 slides
Organizational Hierarchy Infographic Presentation
Clearly define your Organizational Hierarchy with this structured infographic template. Designed for business presentations, HR teams, and corporate strategy, this visual layout simplifies reporting structures, leadership roles, and team organization. Fully customizable and easy to edit in PowerPoint, Keynote, and Google Slides, making it perfect for internal communications and management reports.


7 slides
International Finance Infographic
International finance is a branch of economics and financial studies that deals with monetary interactions that occur between two or more countries. Dive into the intricate world of finance with our visually captivating international finance infographic. This template is your passport to understanding the complexities and opportunities in the global financial landscape. With this template you will be able to analyze the dynamics of exchange rates, foreign investment, and how these factors influence global economics. This infographic is crafted to provide a holistic view of the world of finance.


20 slides
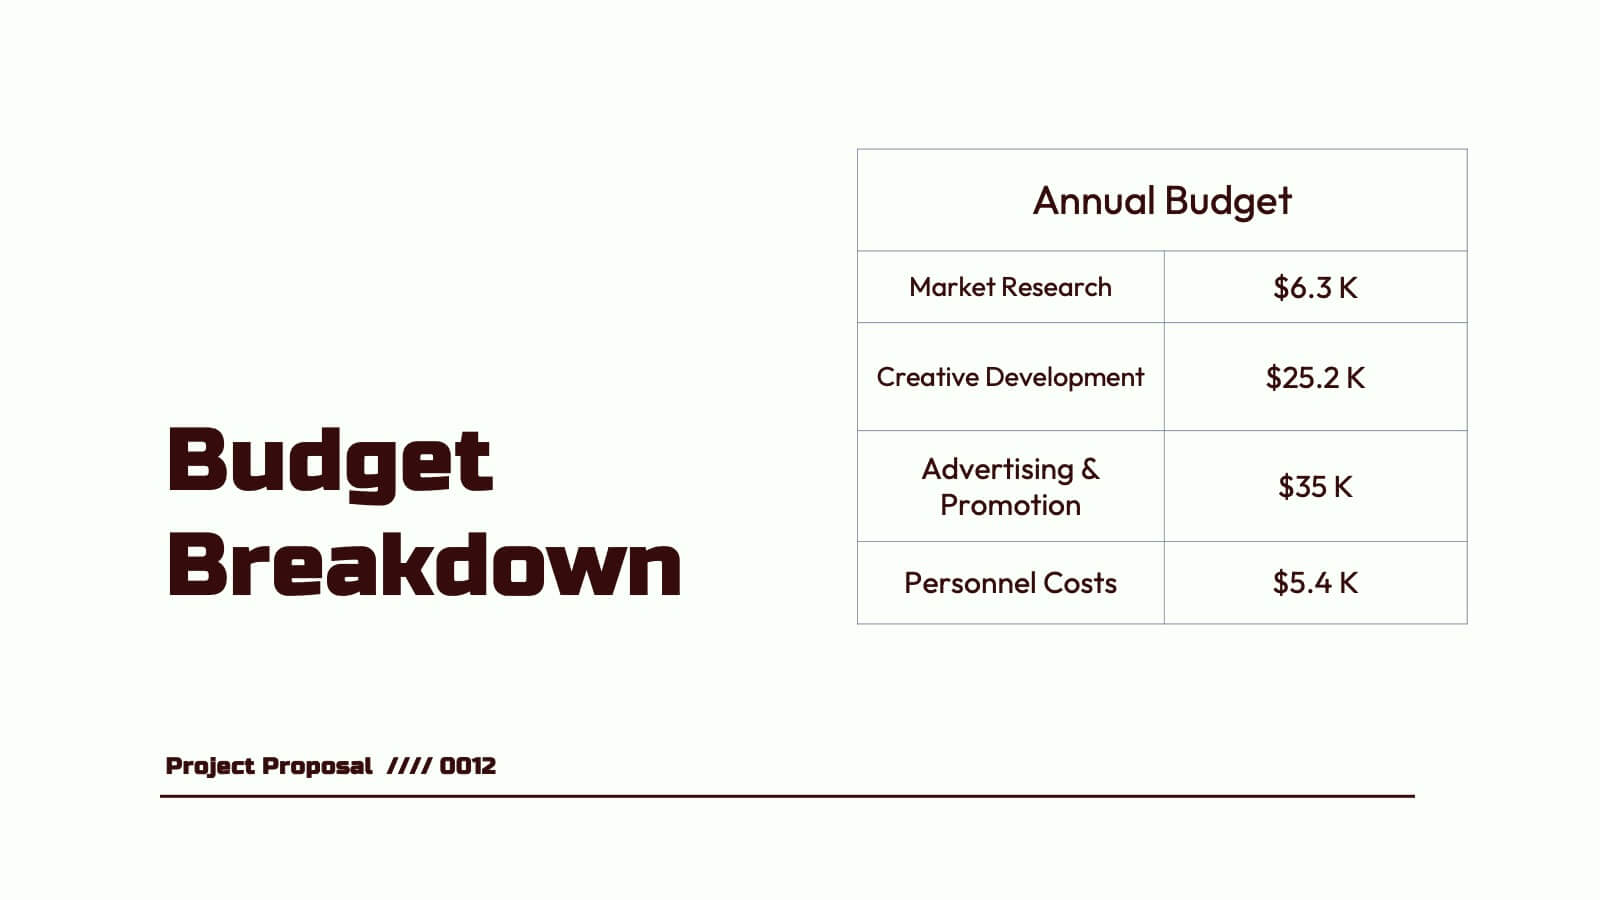
Nebula Project Proposal Presentation
Create a compelling project proposal with this structured, professional template! It includes sections for problem statements, proposed solutions, goals, timelines, and pricing. Perfect for organizing your ideas clearly and professionally, it's fully customizable and compatible with PowerPoint, Keynote, and Google Slides. This template makes it easy to present your proposals effectively and win clients.


2 slides
App Design Mockup Presentation
Present your mobile app in style with the App Design Mockup slide. This sleek and modern template features a large smartphone frame to showcase your UI/UX designs with a creative touch. Ideal for app developers, designers, and pitch decks. Fully customizable and compatible with PowerPoint, Keynote, and Google Slides.


5 slides
Business Gap Identification Presentation
Identify key performance gaps from point A to B with this step-based visualization. Each arch-shaped column represents a stage in the improvement process. Use it to highlight capability gaps, missed opportunities, or strategy breakdowns. Fully editable and compatible with PowerPoint, Keynote, and Google Slides—ideal for consulting, planning, and reporting.


8 slides
Green Business Sustainability Strategy Presentation
Promote eco-friendly business strategies with the Green Business Sustainability Strategy infographic. Featuring a circular flow diagram, this template highlights key sustainable initiatives, resource management, and environmental impact strategies. Fully editable and compatible with PowerPoint, Keynote, and Google Slides.


8 slides
Team Roles & Skills Chart Presentation
Bring your team’s strengths to life with this clean, engaging slide designed to highlight individual roles, skill levels, and key capabilities. It helps teams clearly visualize expertise, compare competencies, and communicate responsibilities with ease. Fully editable and compatible with PowerPoint, Keynote, and Google Slides.