


Features
- 5 Unique slides
- Fully editable and easy to edit in Microsoft Powerpoint, Keynote and Google Slides
- 16:9 widescreen layout
- Clean and professional designs
- Export to JPG, PDF or send by email


Do you have any questions?
Recommend


4 slides
Business Partnership Development Presentation
Showcase key elements of collaboration with the Business Partnership Development Presentation. This quadrant-style layout is perfect for outlining strategies, stakeholders, or phases of a partnership. Ideal for business proposals, joint ventures, and strategic planning decks. Fully editable in PowerPoint, Keynote, and Google Slides.


5 slides
Cloud Computing Services Overview Presentation
Simplify cloud service explanations with this Cloud Computing Services Overview template. Perfect for IT professionals, business leaders, and tech strategists, this slide visually breaks down key cloud services and infrastructure using an intuitive, easy-to-understand layout. Featuring color-coded icons and modern design, this template helps showcase essential cloud computing components effectively. Fully compatible with PowerPoint, Keynote, and Google Slides for seamless integration into your presentations.


8 slides
Critical Challenges Analysis
Visualize obstacles and growth milestones with this mountain-themed slide—ideal for outlining major challenges and the efforts required to overcome them. Each peak highlights a key hurdle, complete with customizable icons and text. Fully editable in PowerPoint, Keynote, and Google Slides.


4 slides
Incident Prevention and Safety Culture Presentation
Promote a proactive approach to workplace wellbeing with the Incident Prevention and Safety Culture presentation. This visually structured slide uses bold safety icons—such as warning signs, first aid, and hazard symbols—to represent core pillars of a safety-first environment. Ideal for outlining safety protocols, risk mitigation strategies, training initiatives, and cultural values, each section includes editable placeholders for concise messaging. The clean layout supports quick communication in HR briefings, onboarding, or compliance meetings. Fully customizable and compatible with PowerPoint, Keynote, and Google Slides.


20 slides
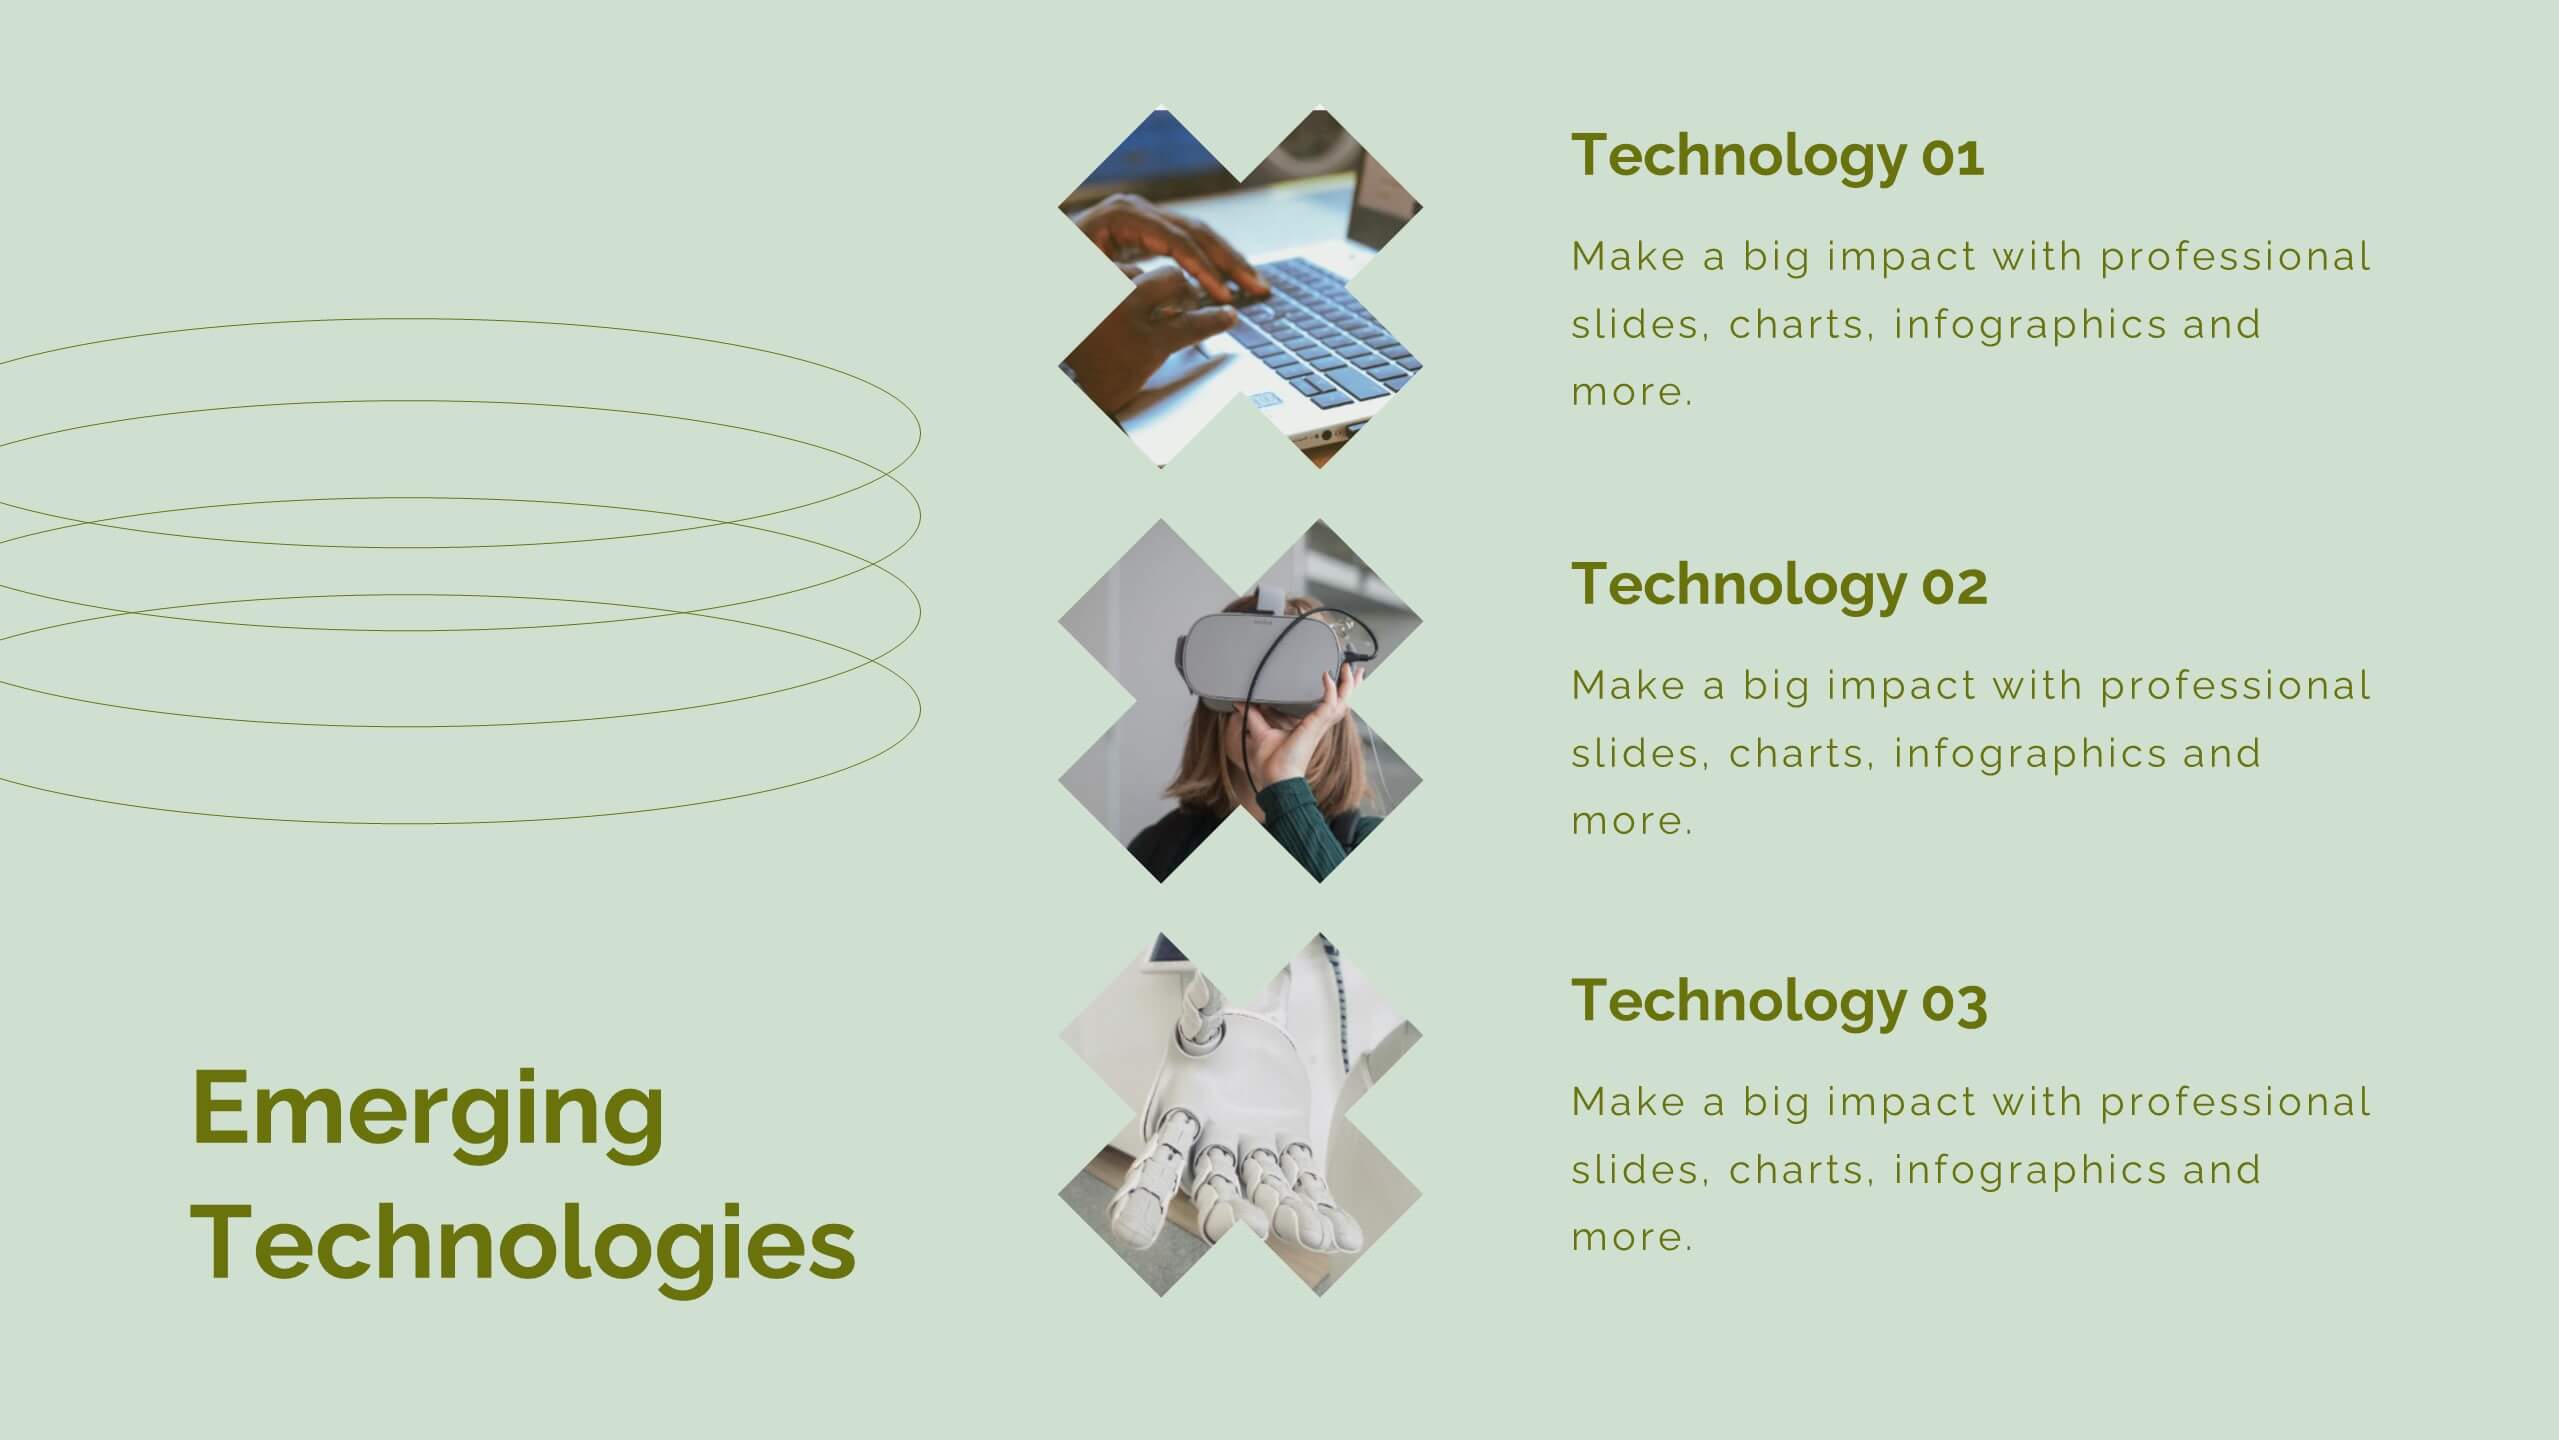
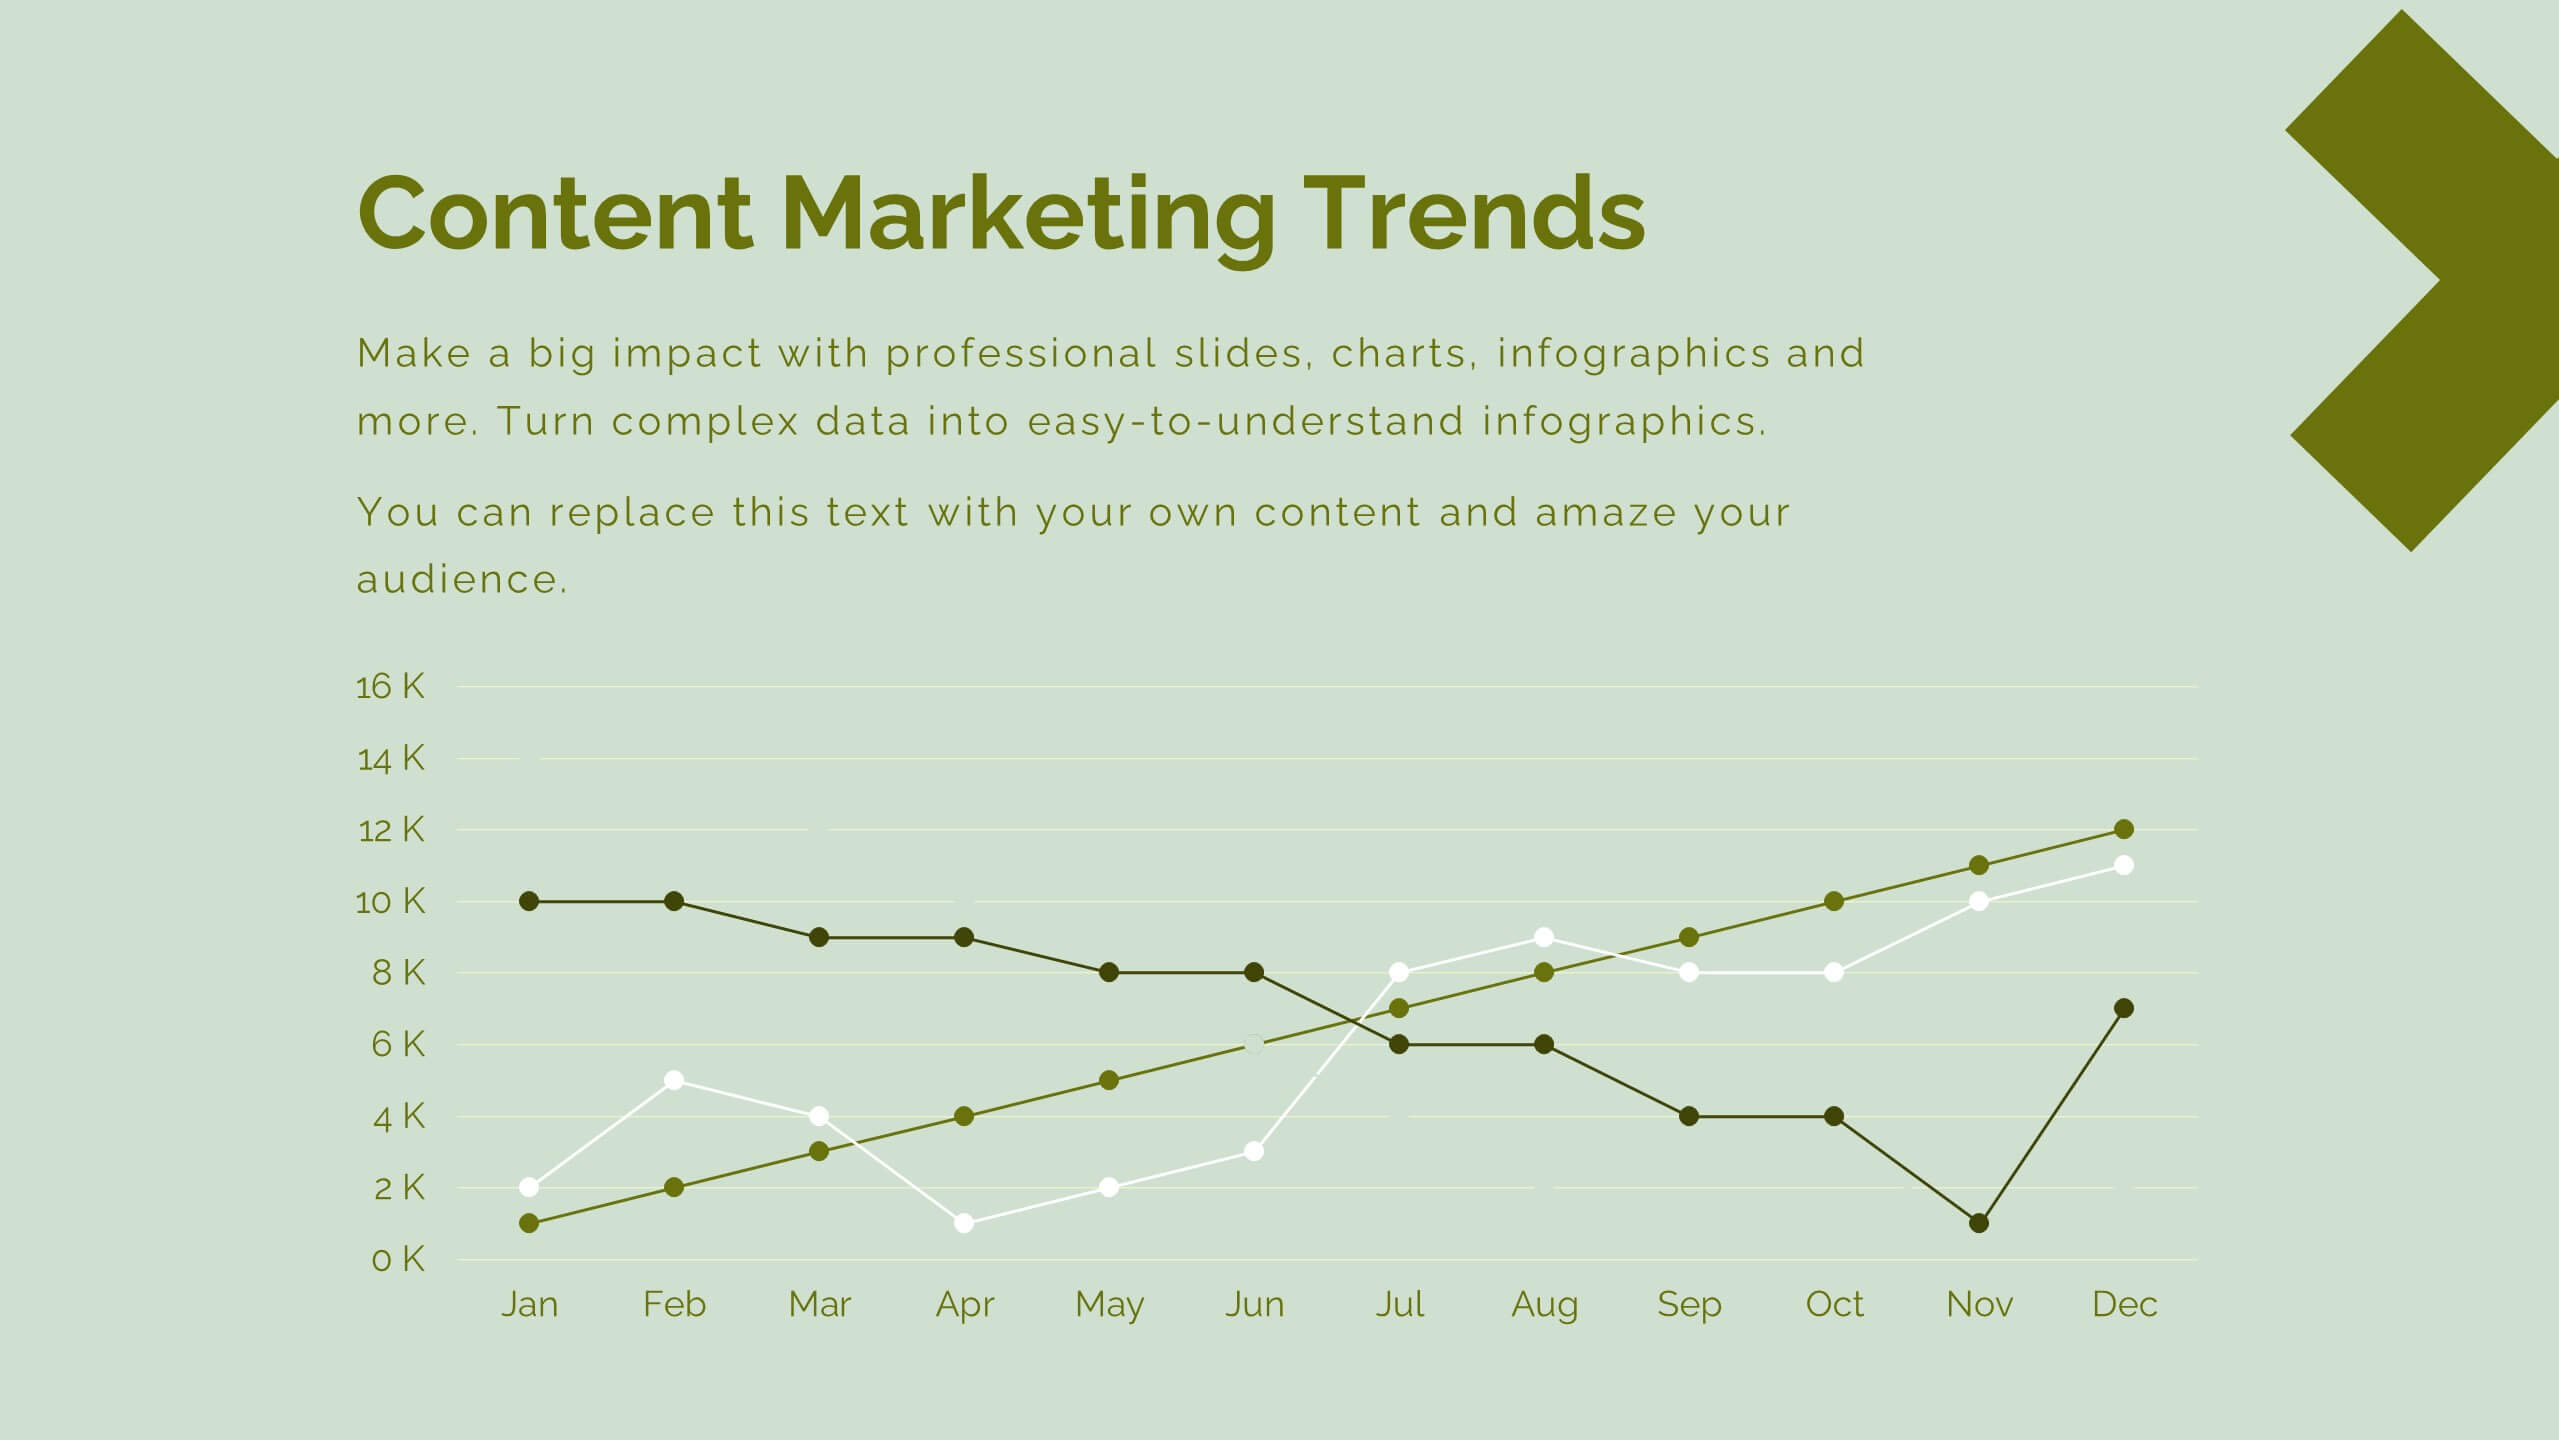
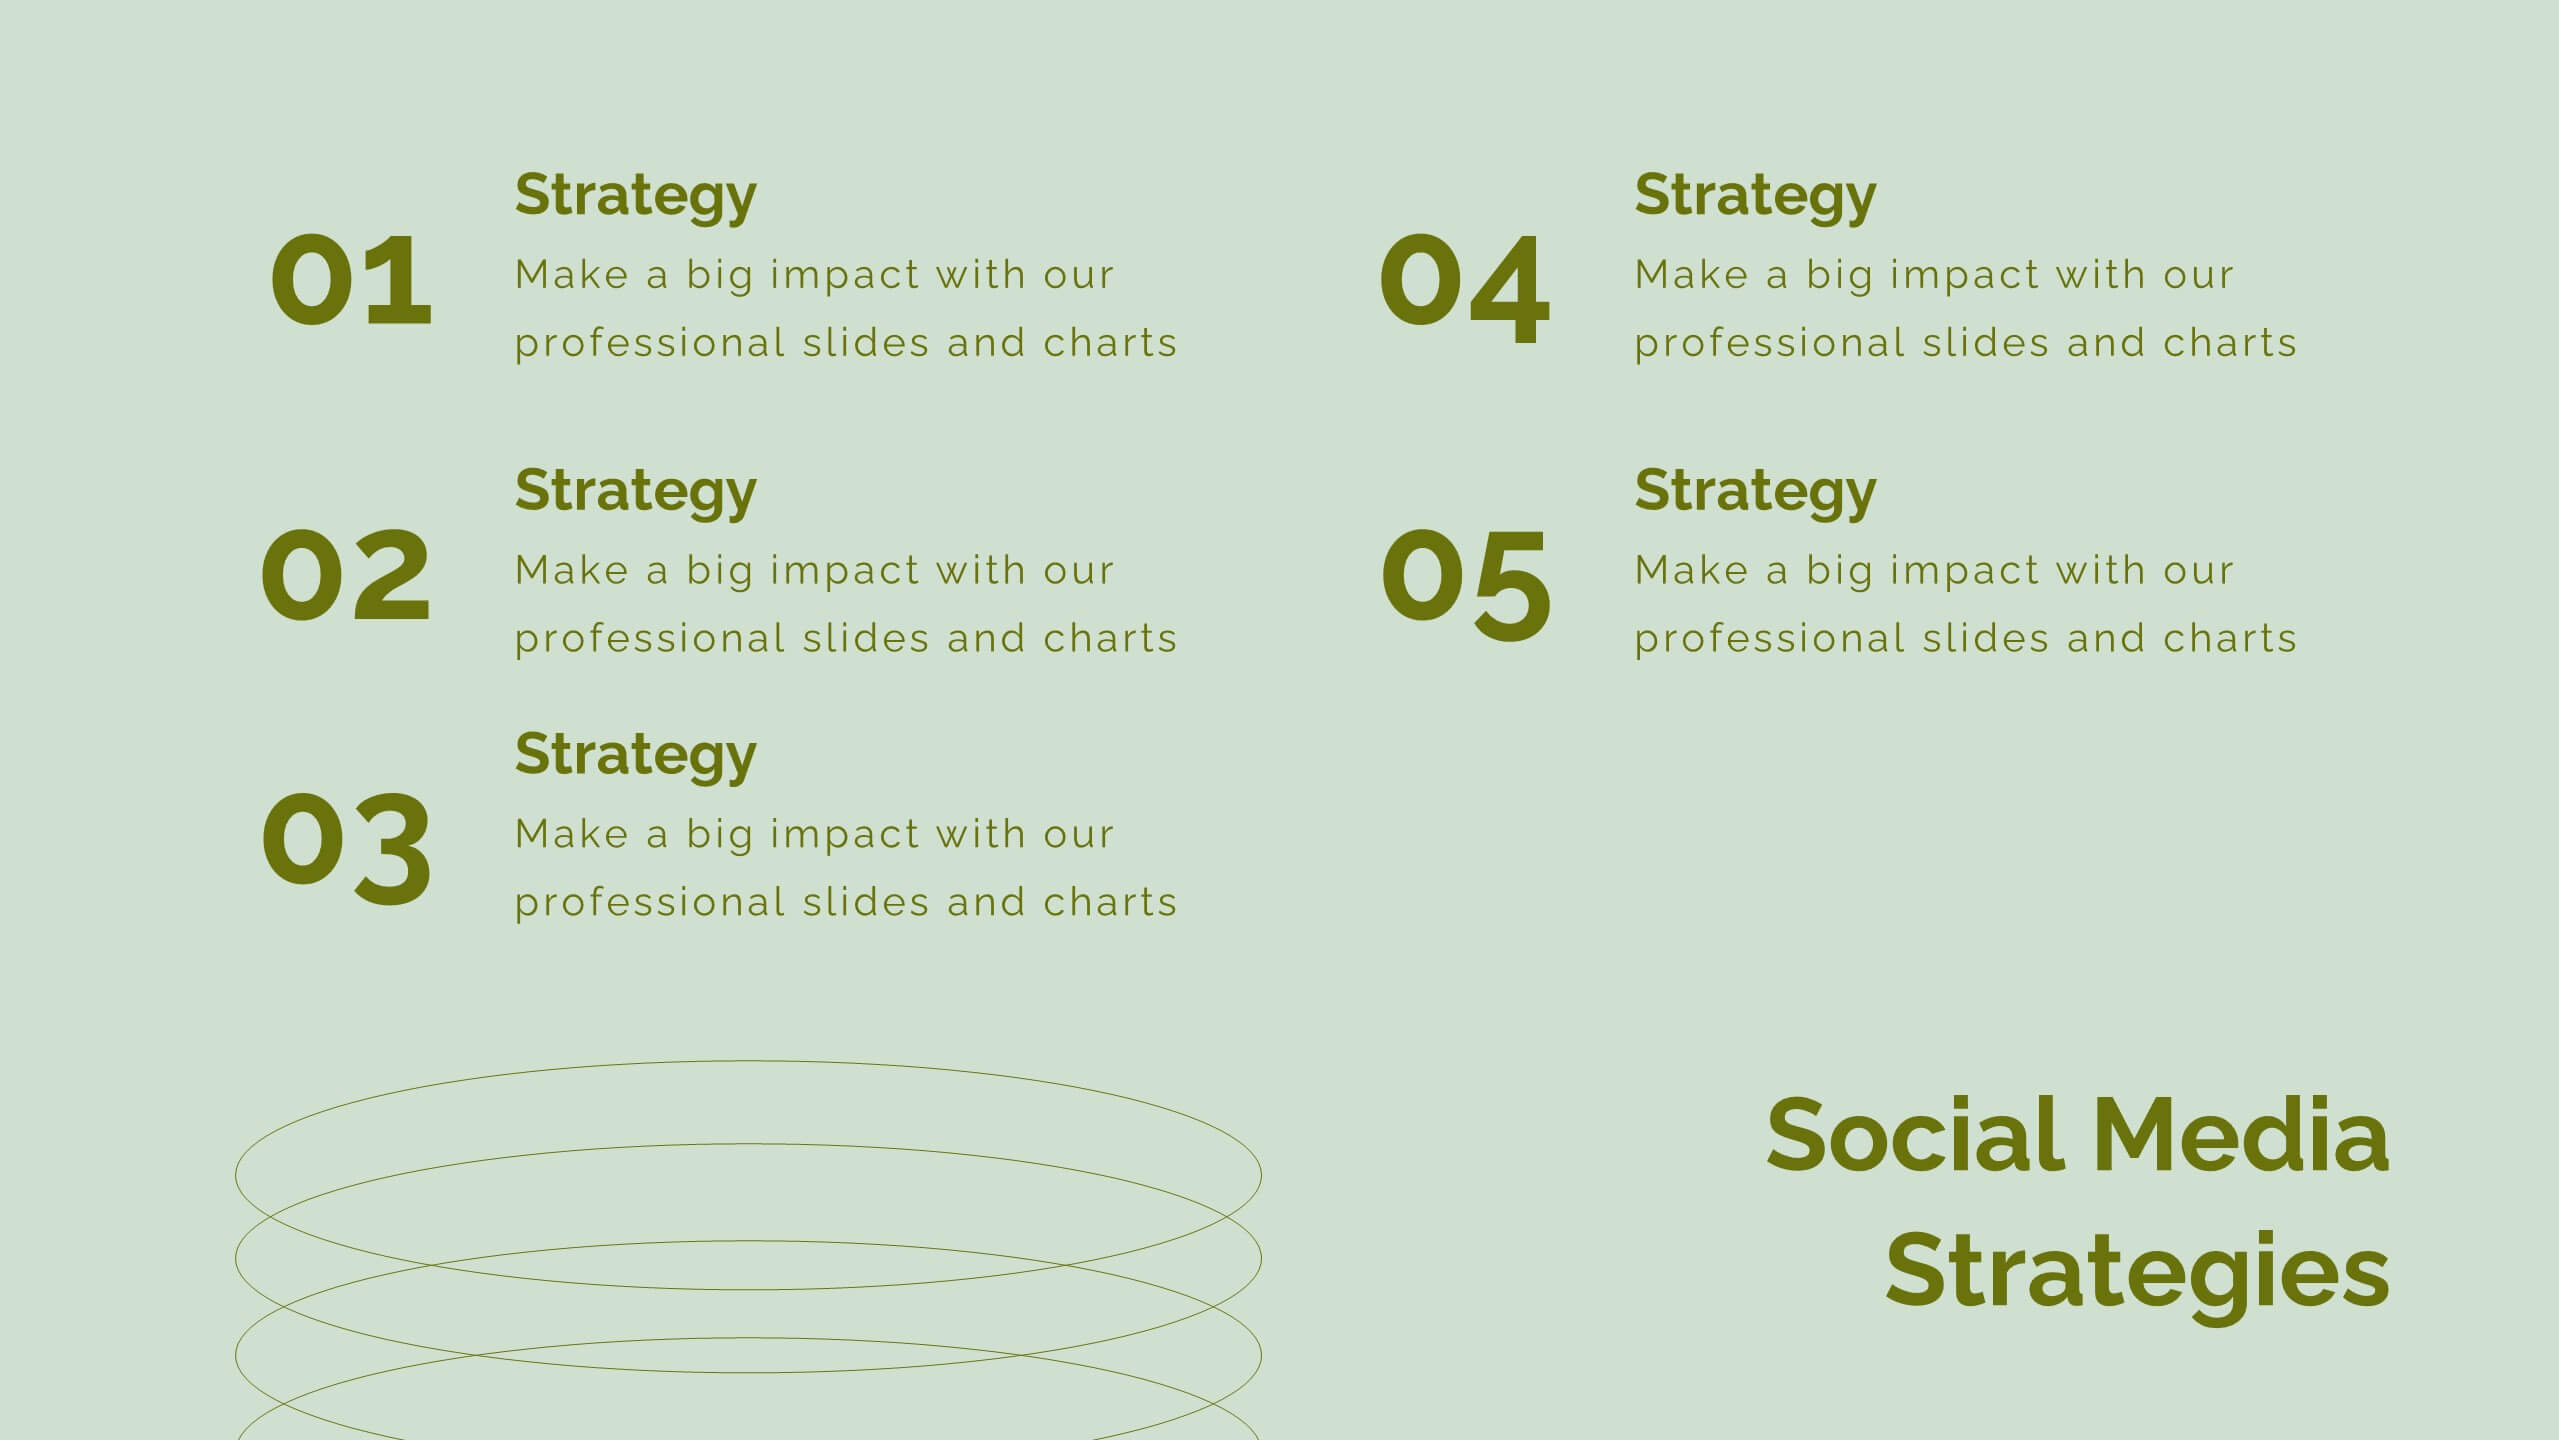
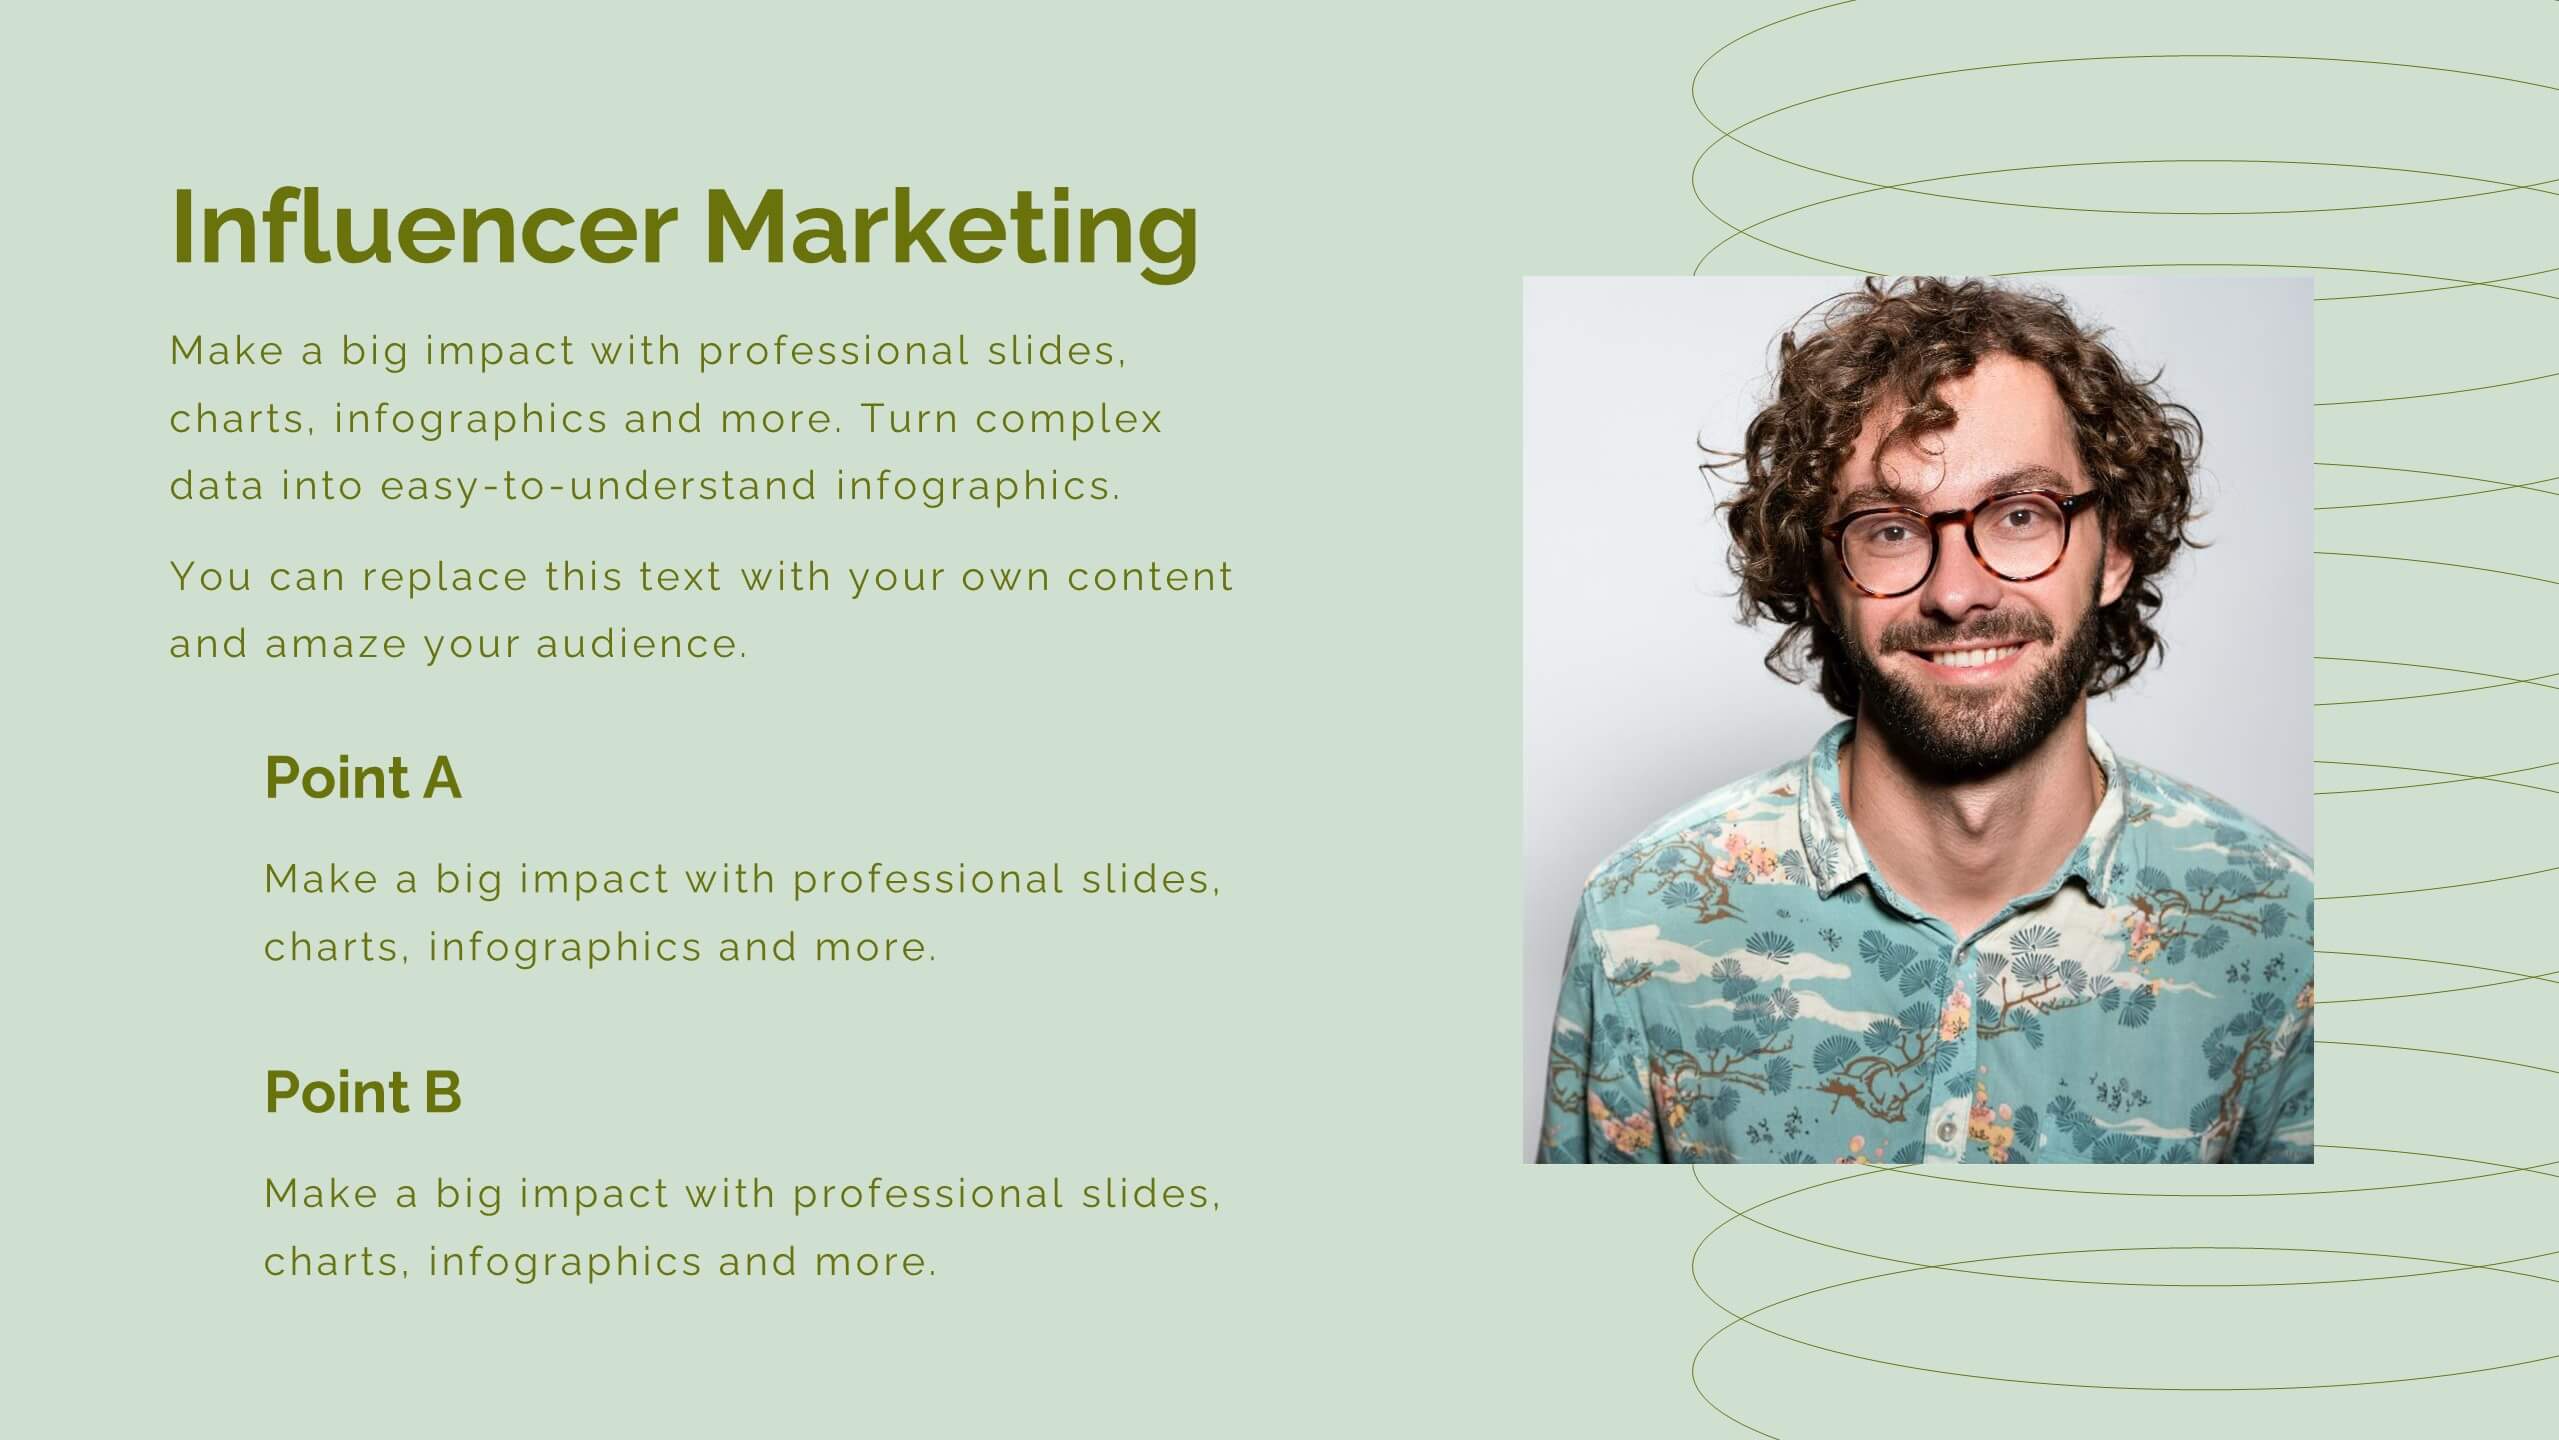
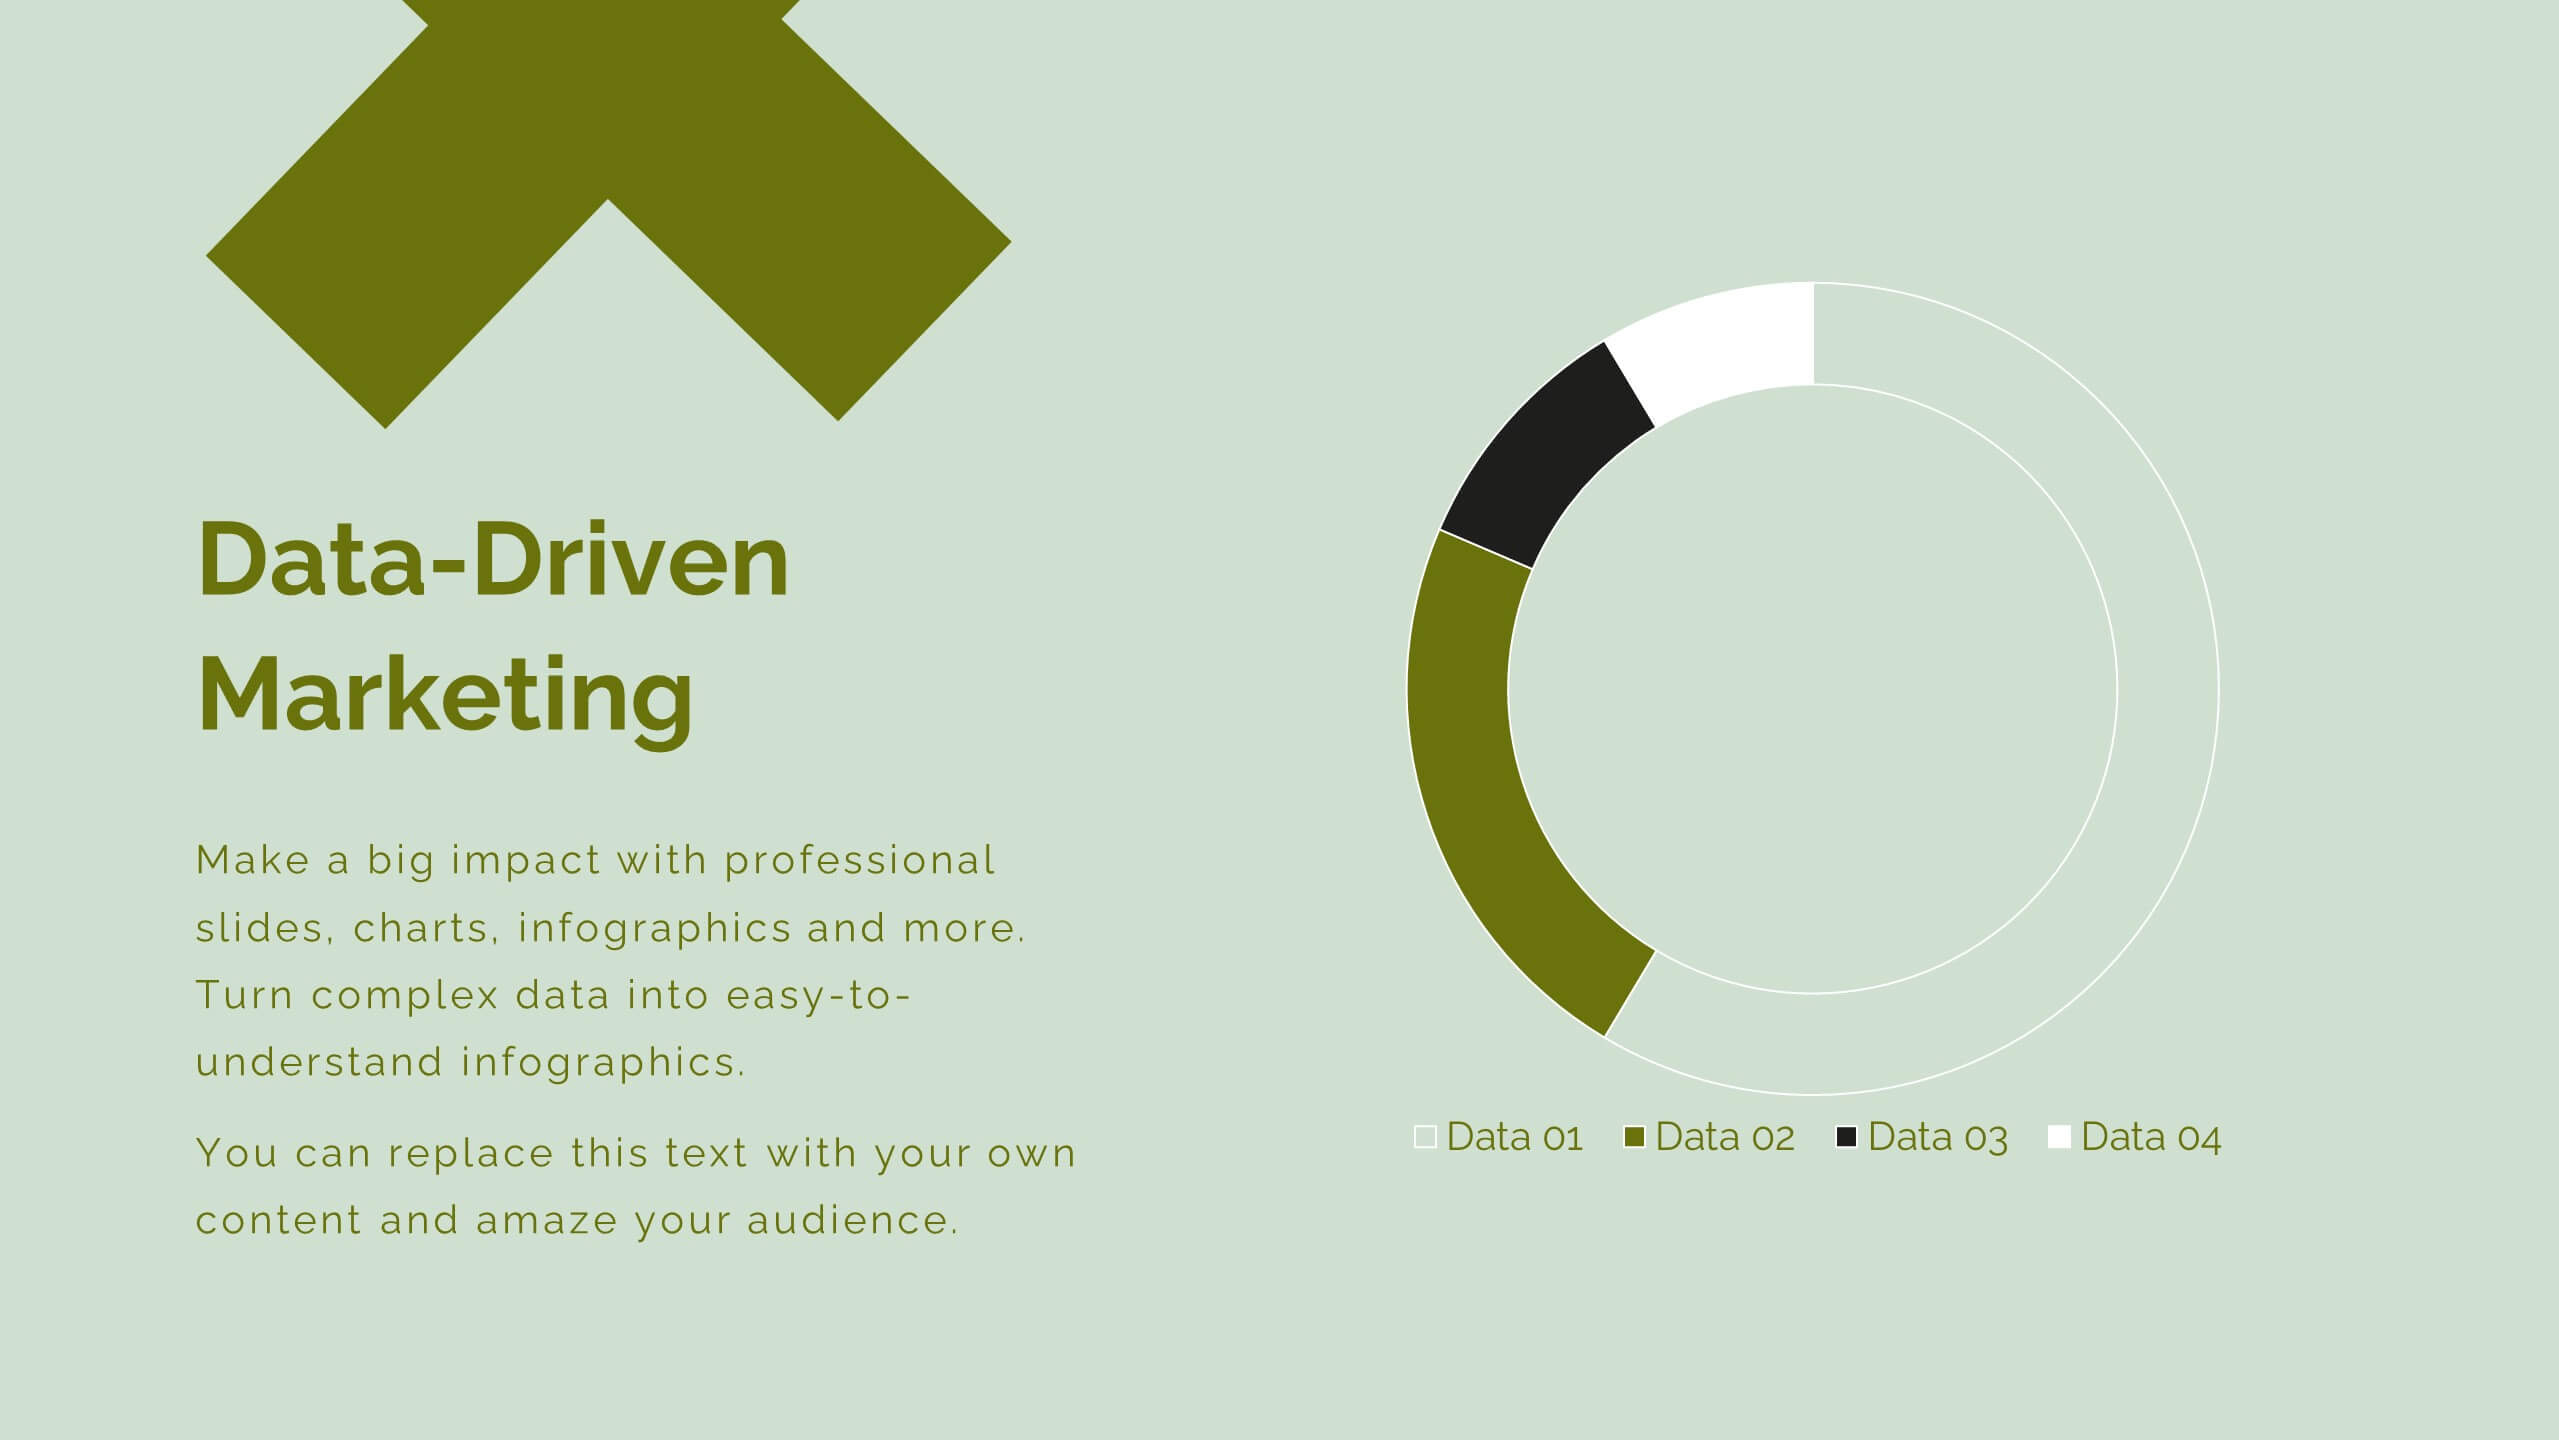
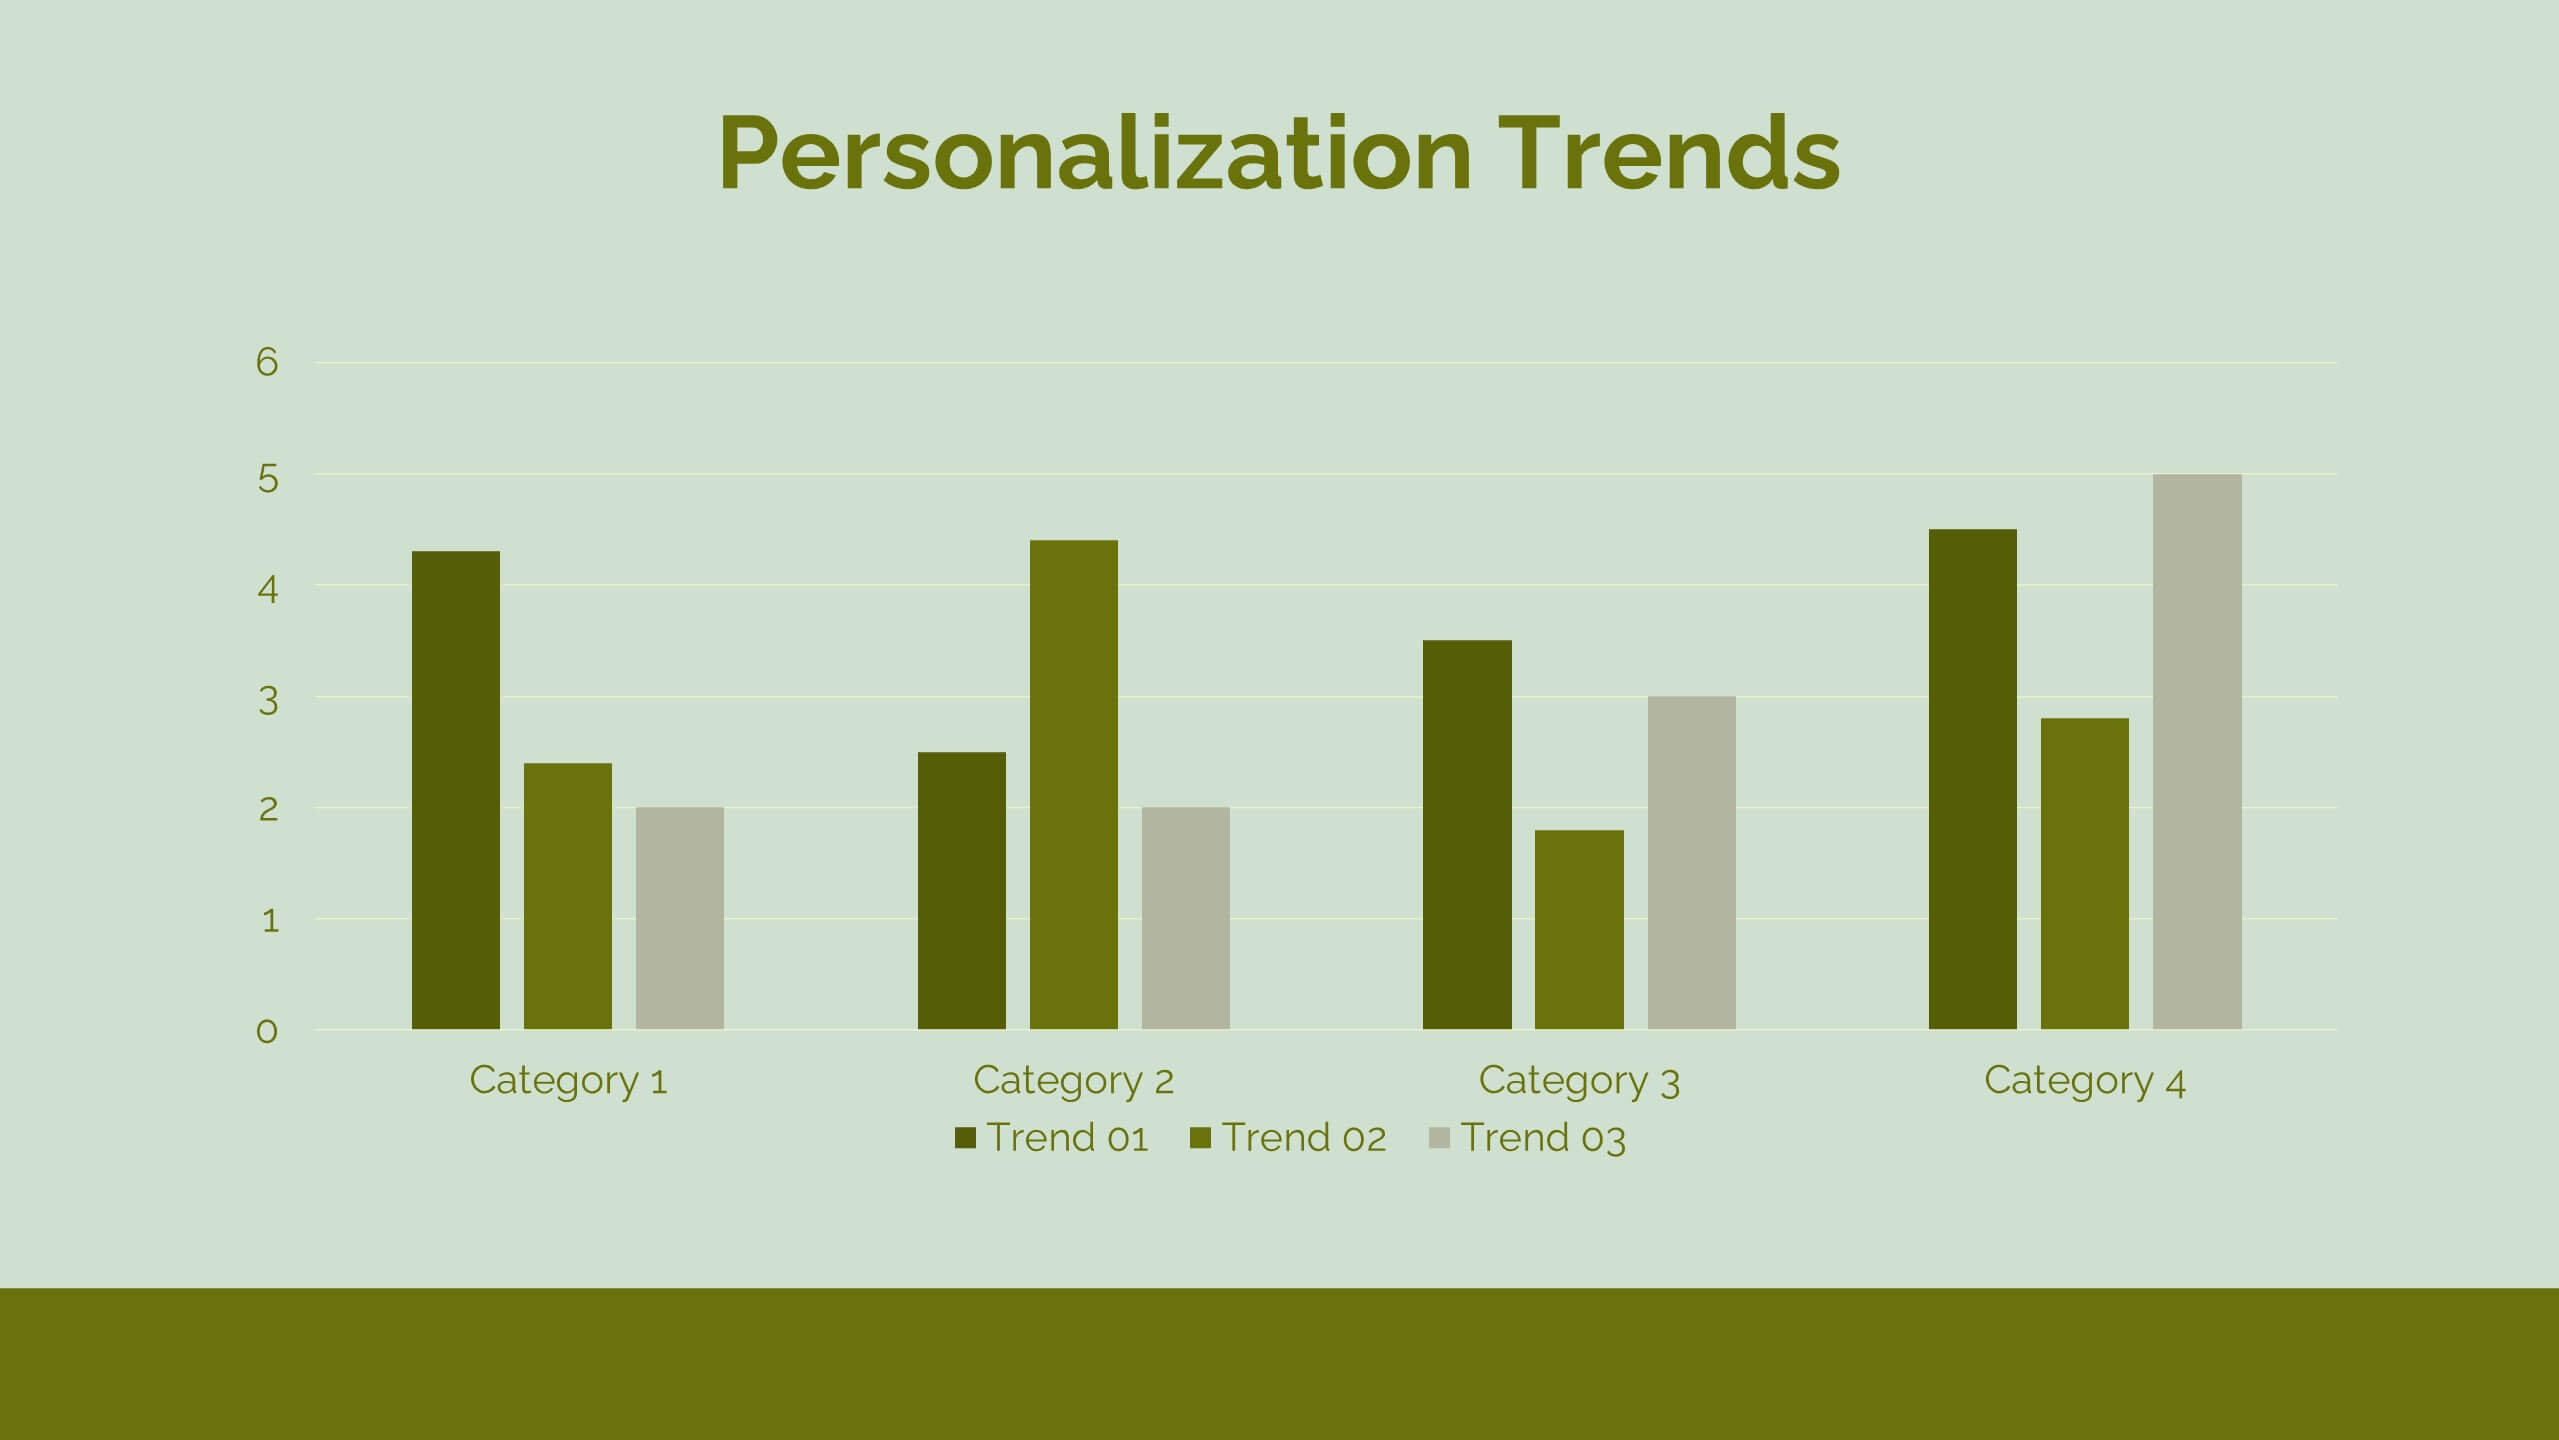
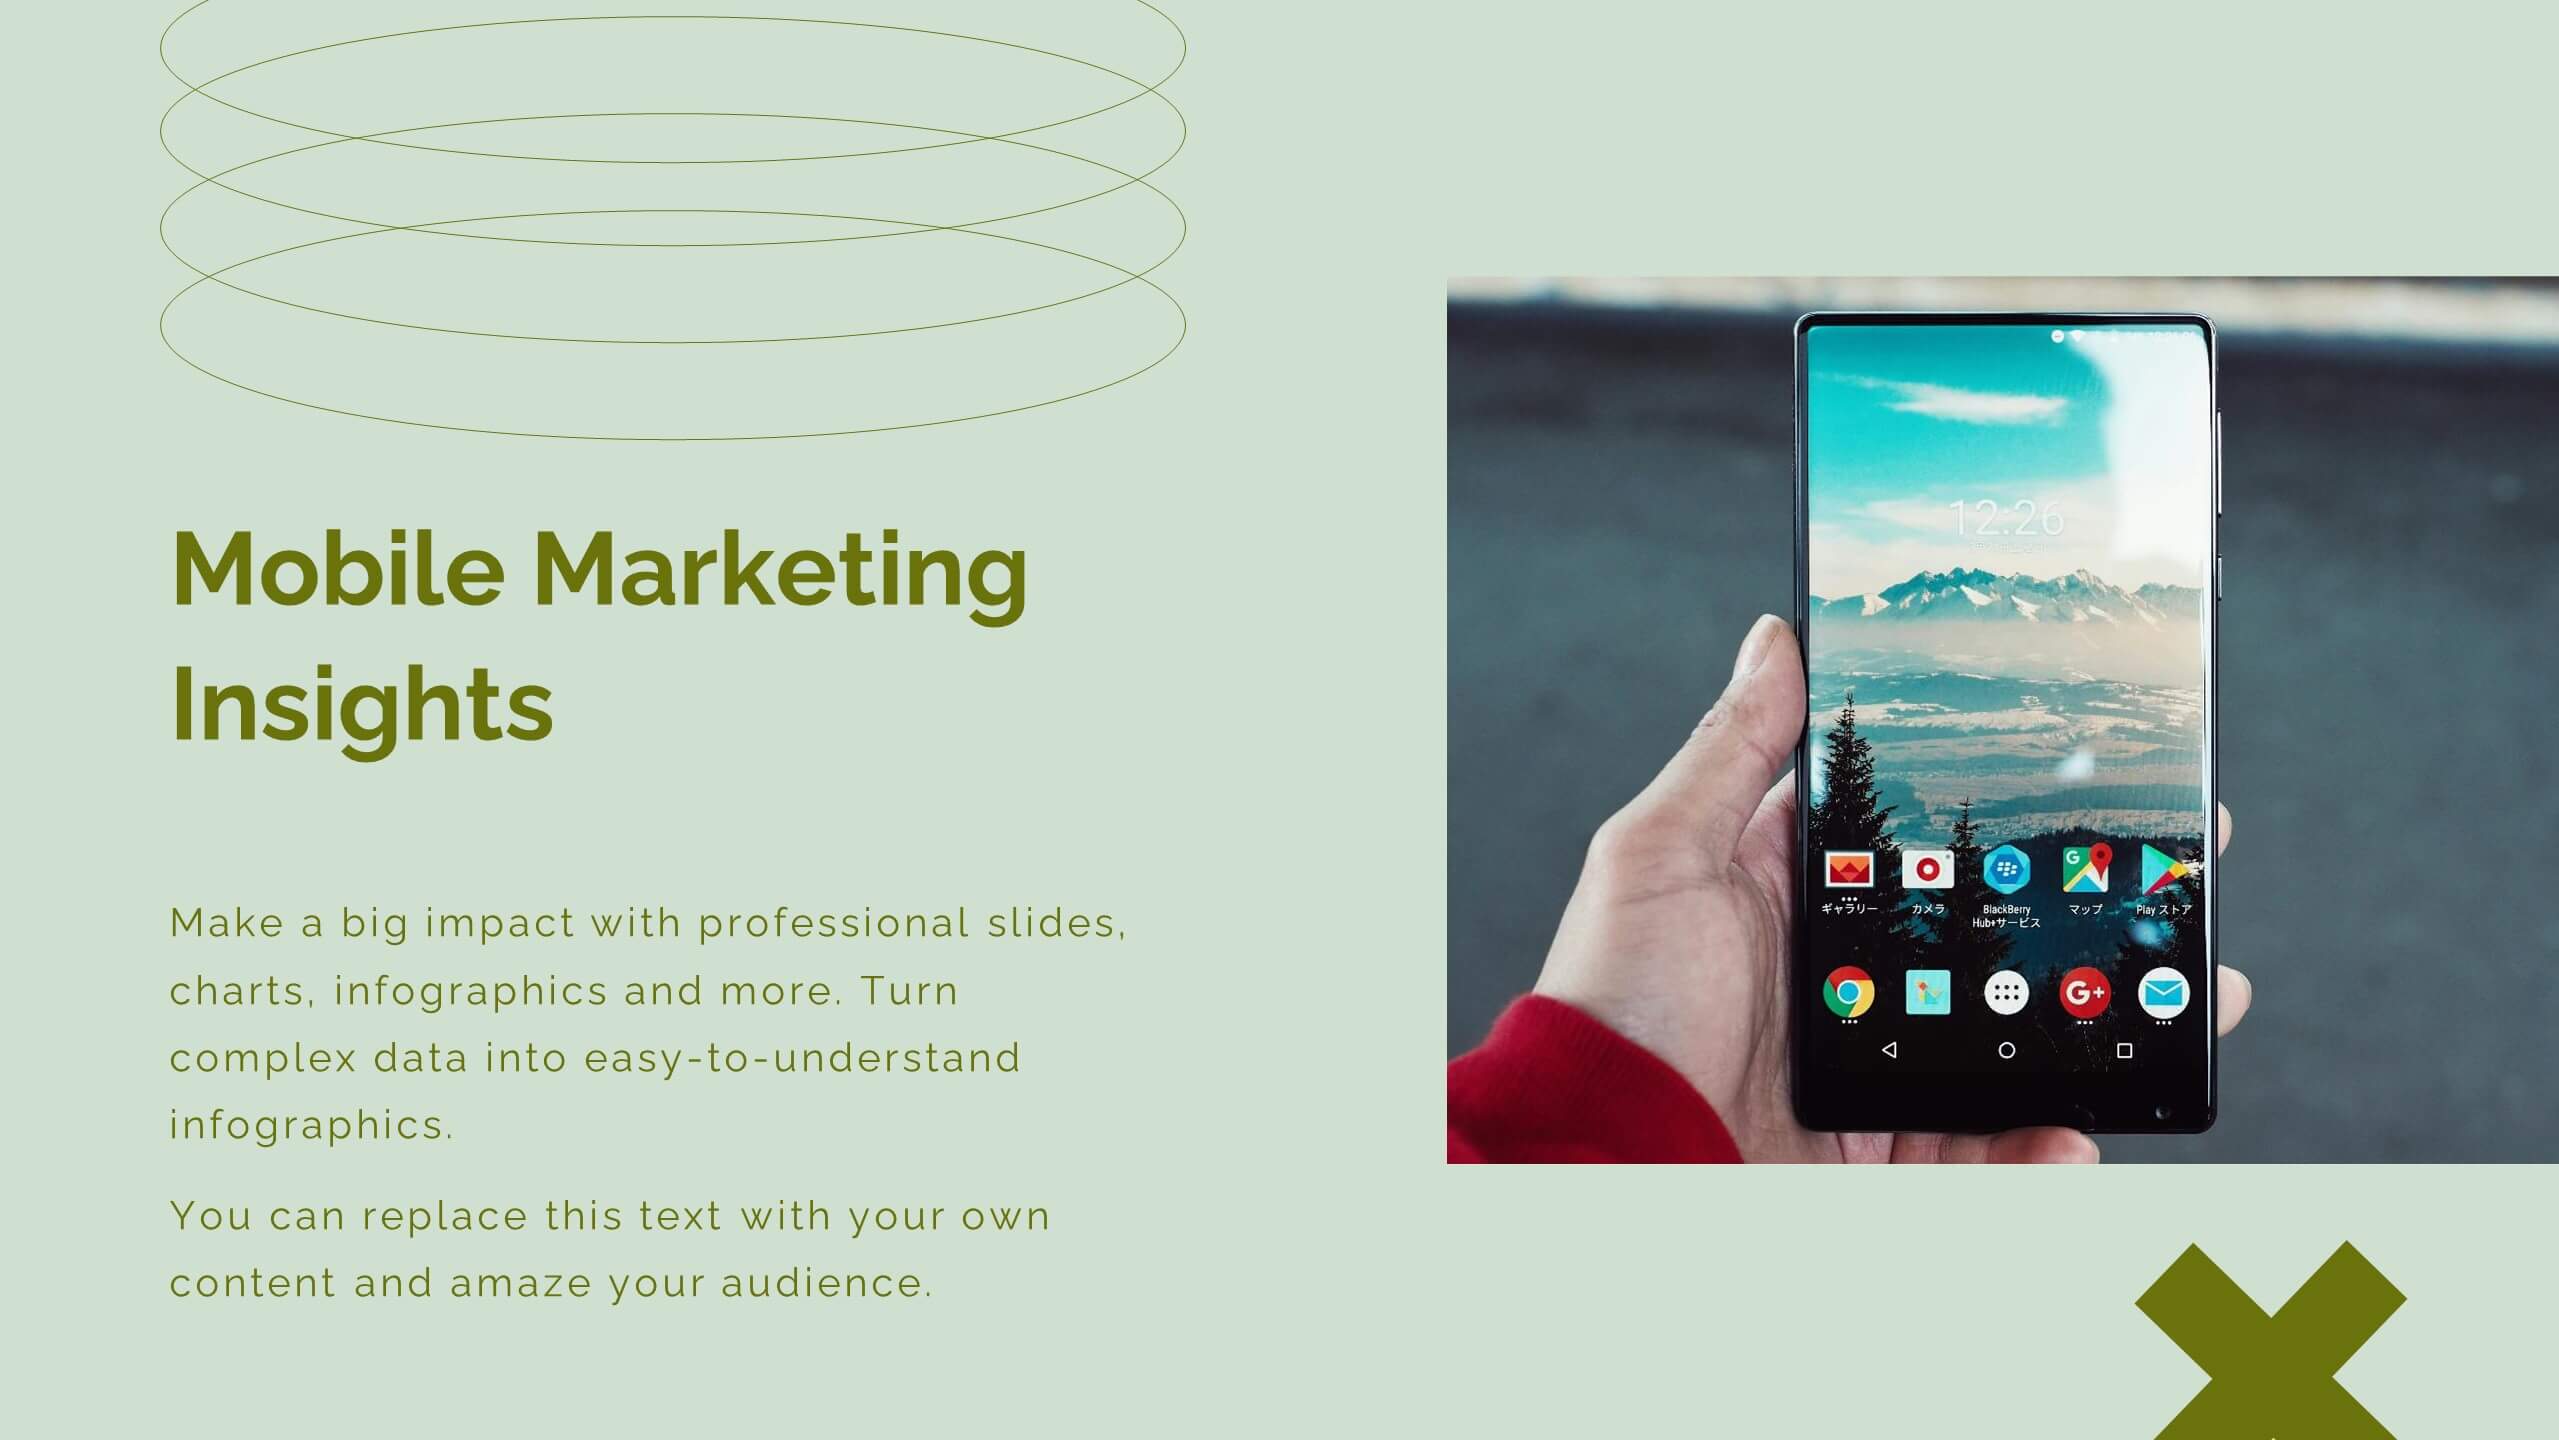
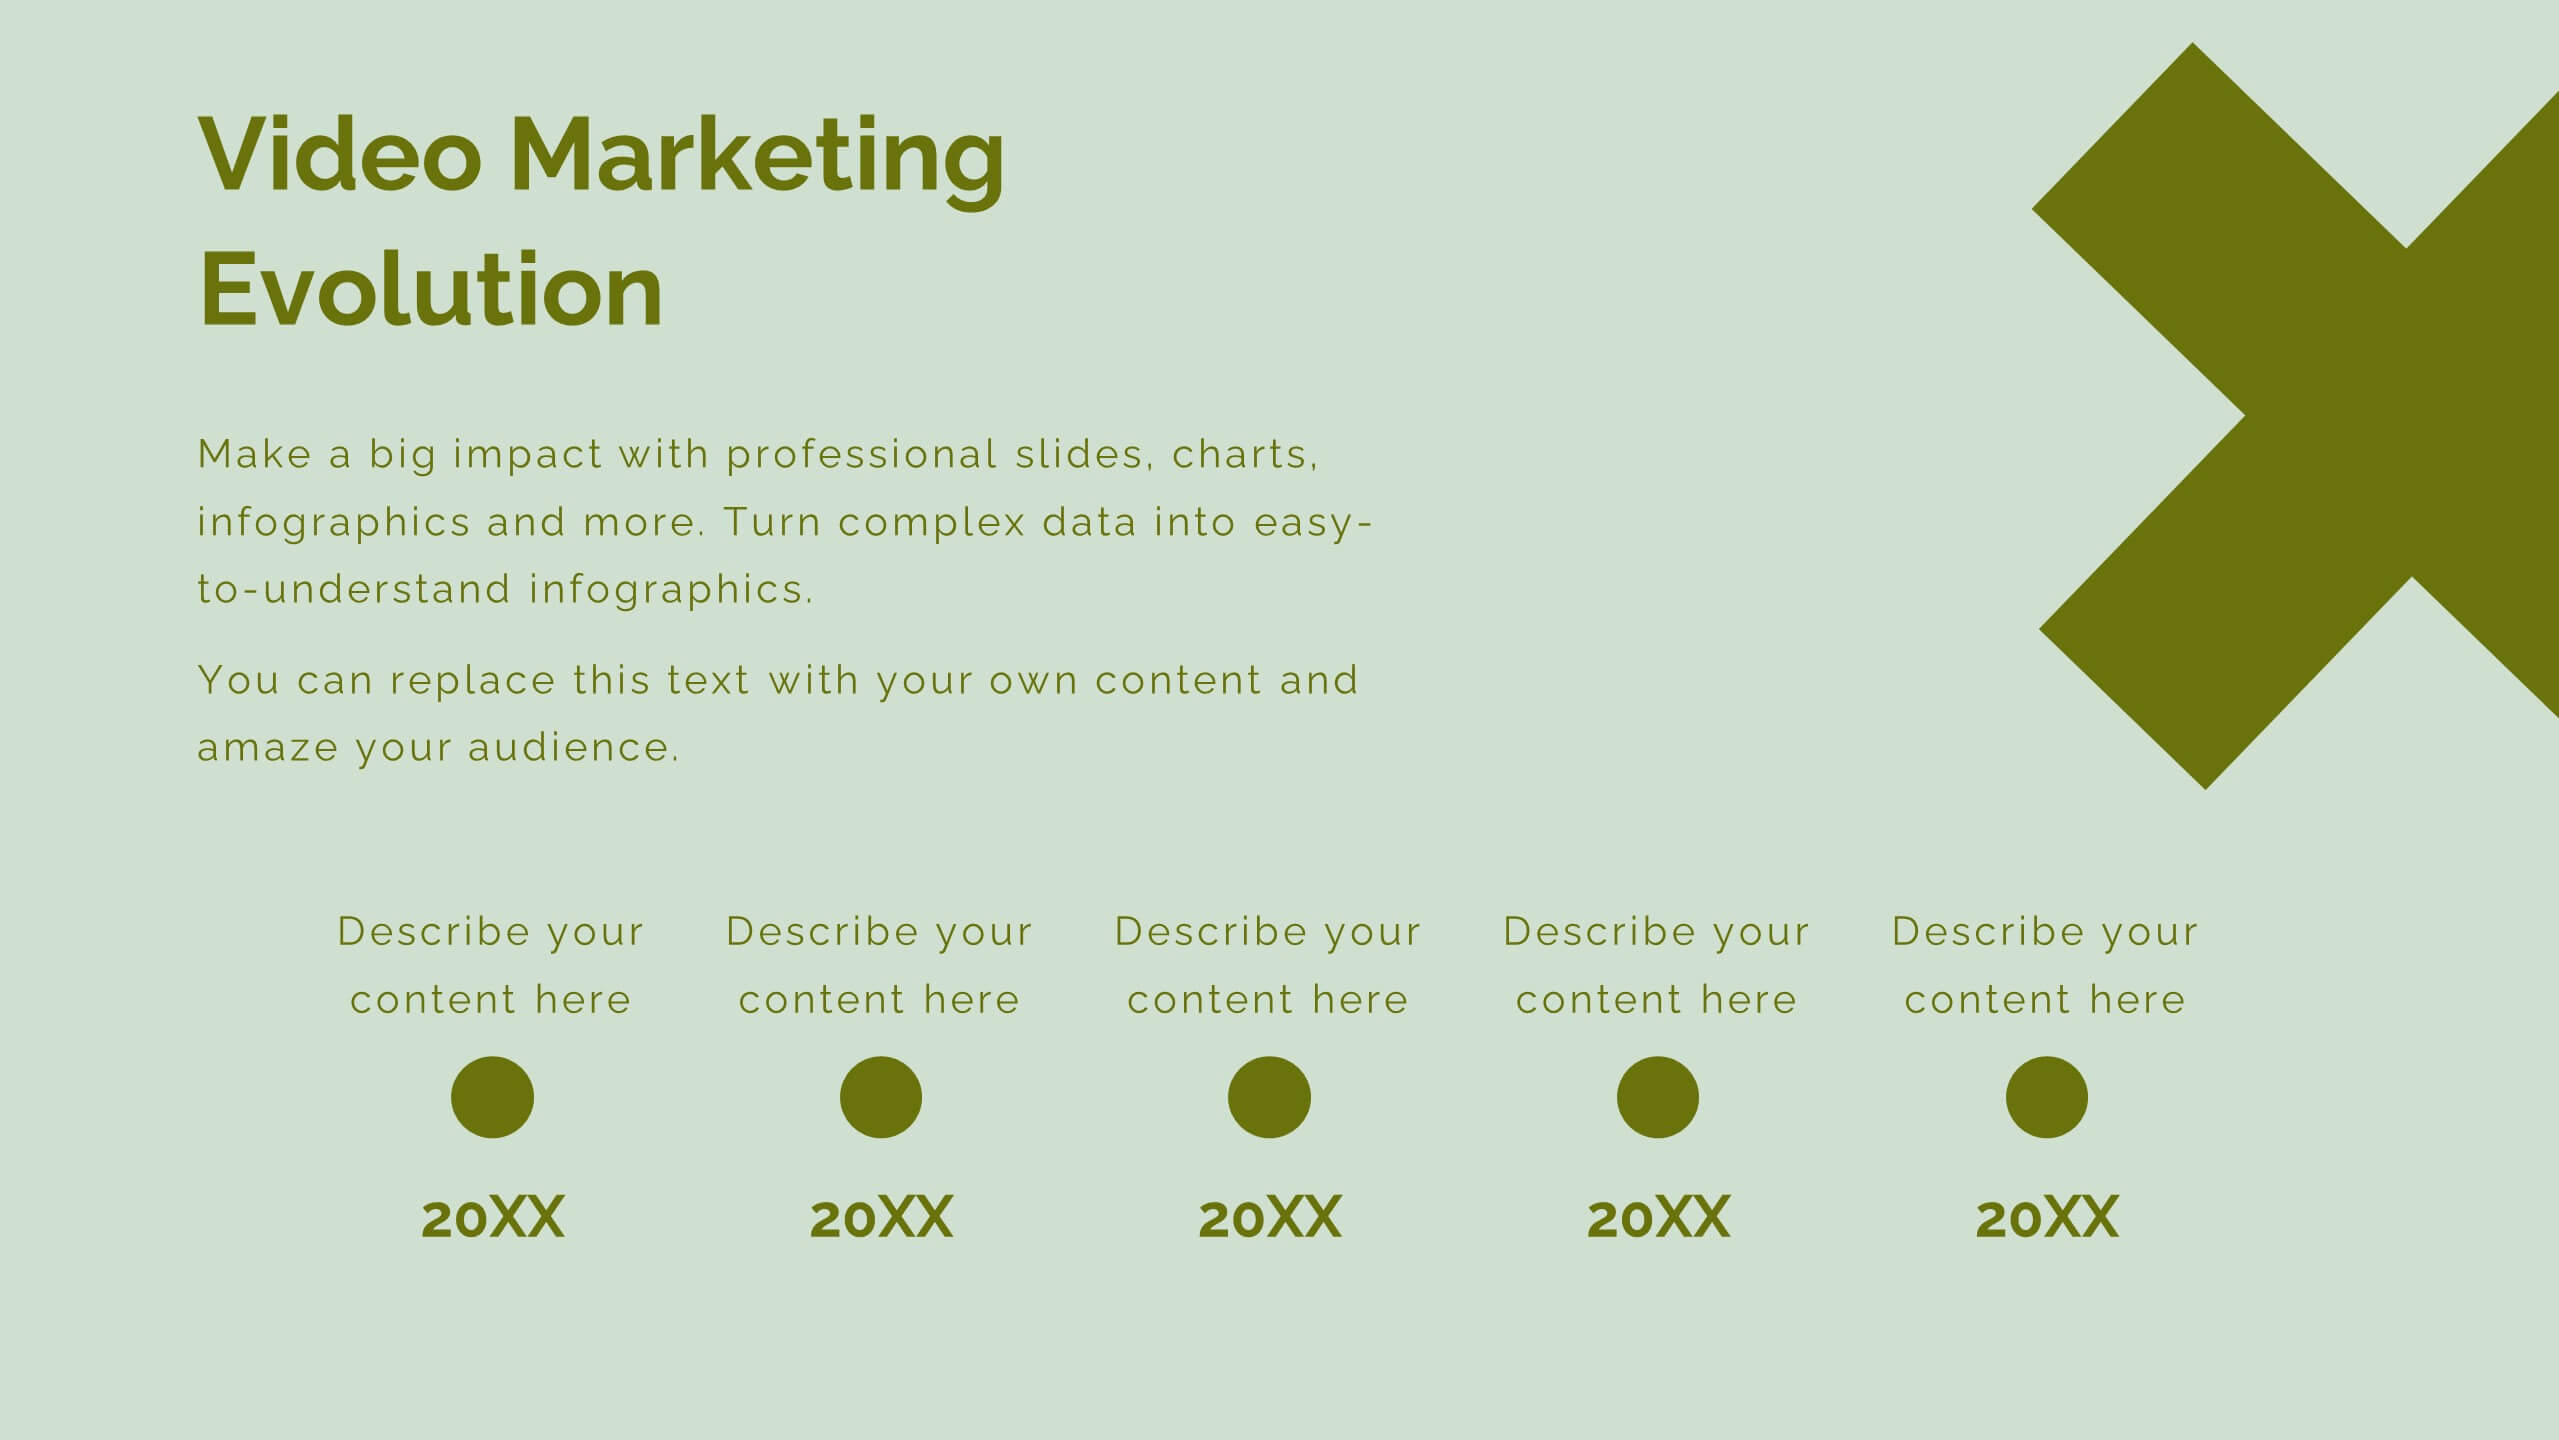
Aura Digital Marketing Strategy Plan Presentation
Revamp your digital marketing strategies with this dynamic template! Covering everything from industry overviews and consumer behavior analysis to emerging technologies and social media strategies, this template has it all. Perfect for creating compelling presentations that highlight data-driven marketing and brand storytelling. Compatible with PowerPoint, Keynote, and Google Slides.


21 slides
Crystalhearth UX Design Presentation
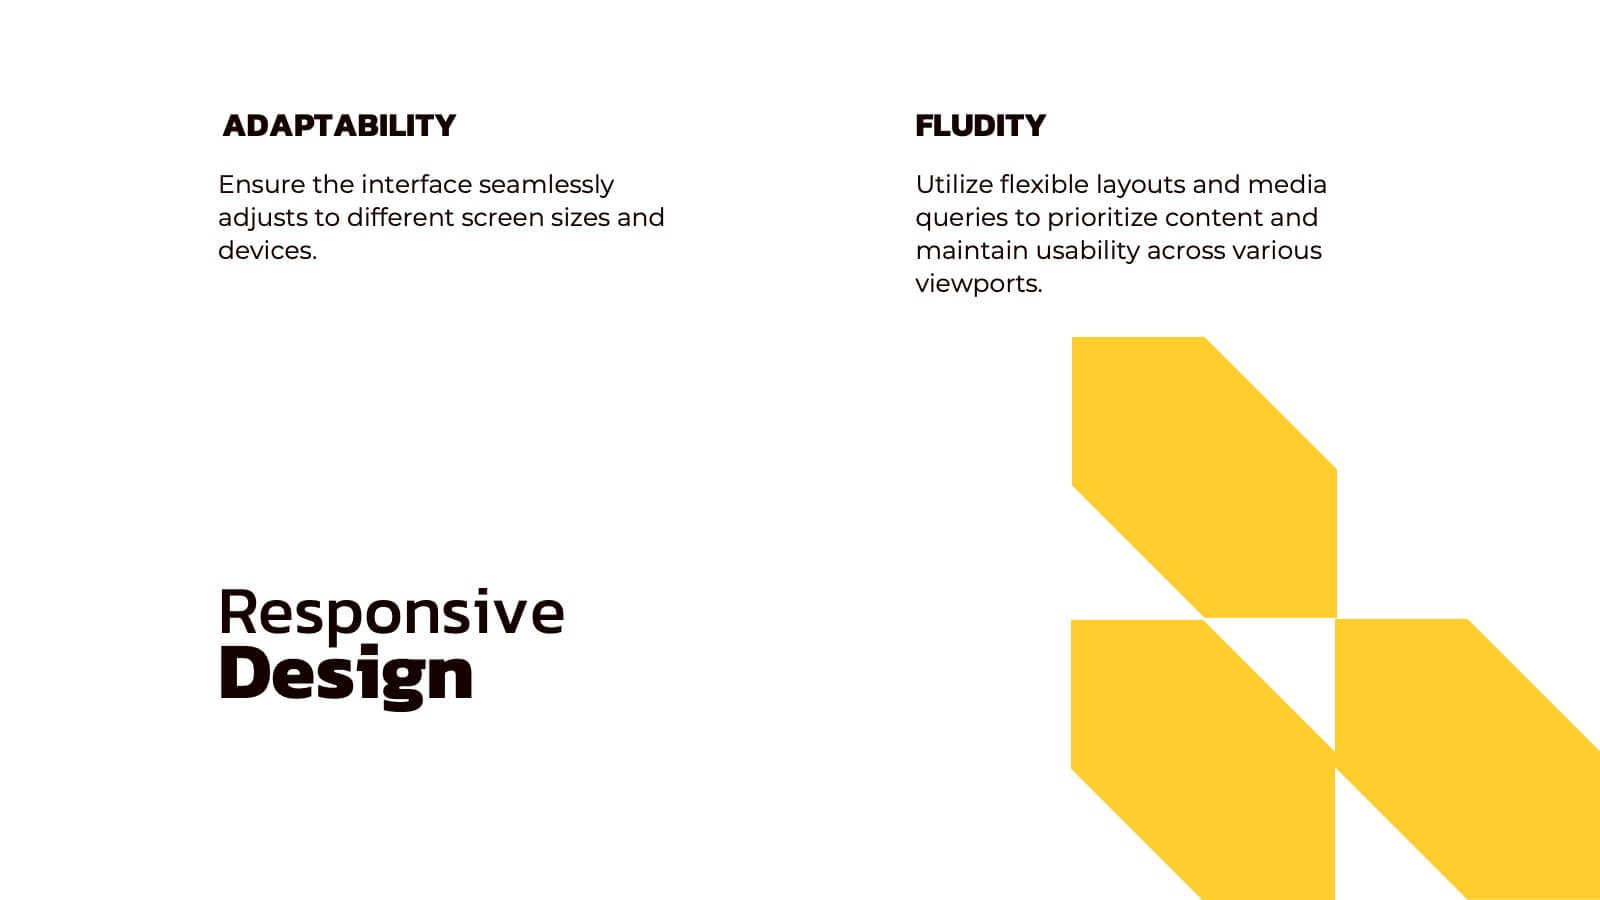
This professional template simplifies UX/UI design presentations, covering user research, personas, journey mapping, wireframes, and usability guidelines. Showcase visual elements, branding, accessibility, and responsive design. Ideal for illustrating the iterative process, testing insights, and project showcases. Fully customizable and compatible with PowerPoint, Keynote, and Google Slides.
21 slides
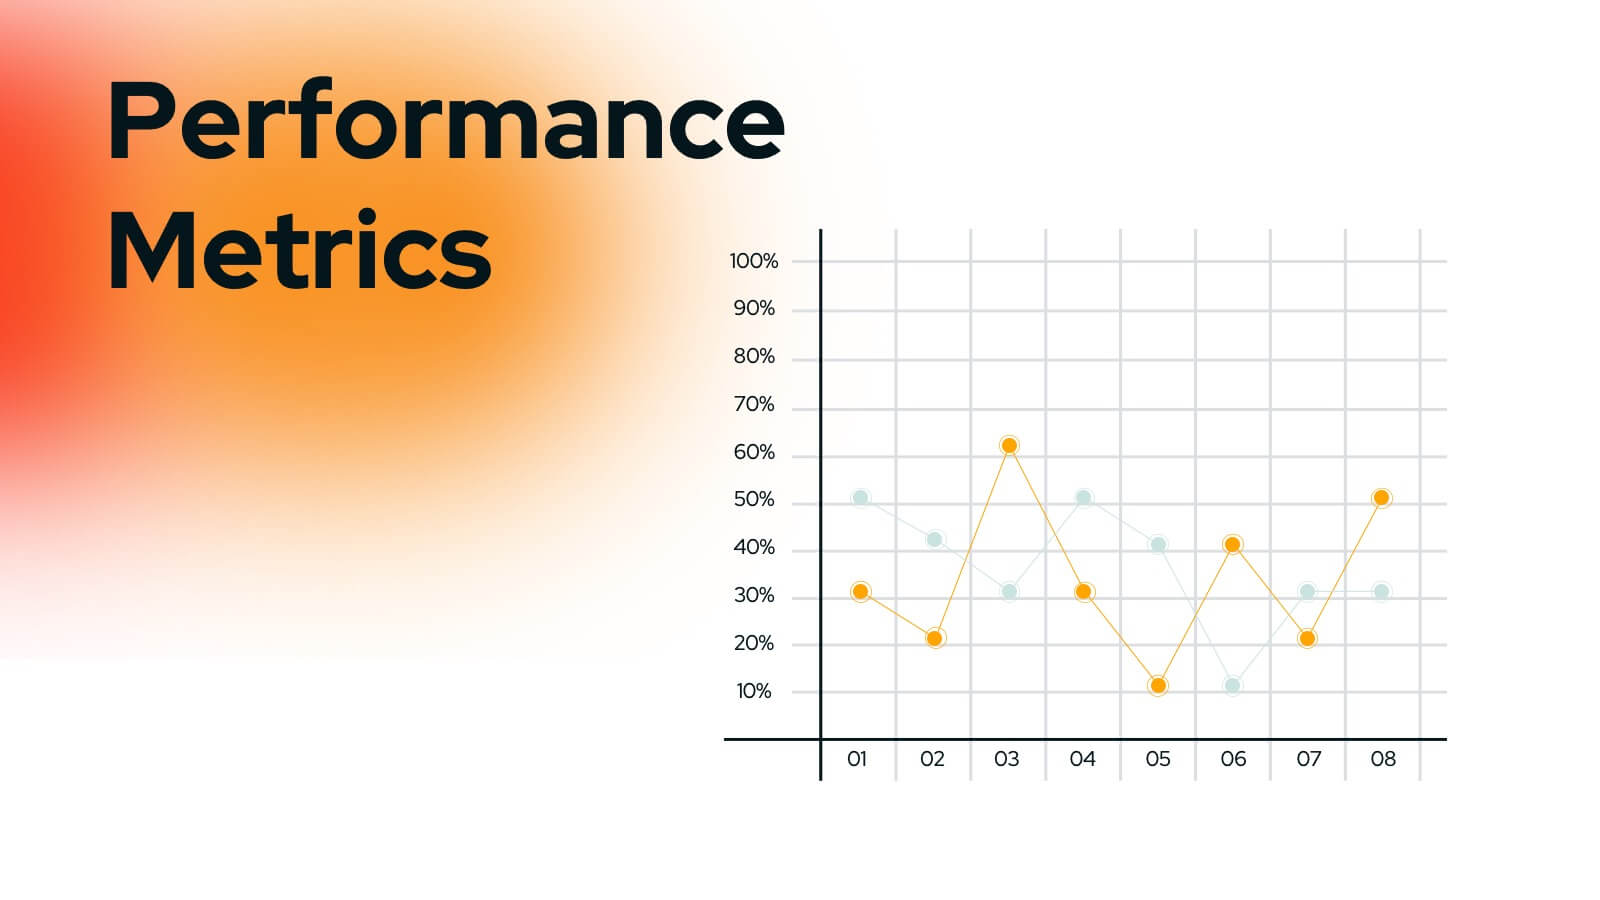
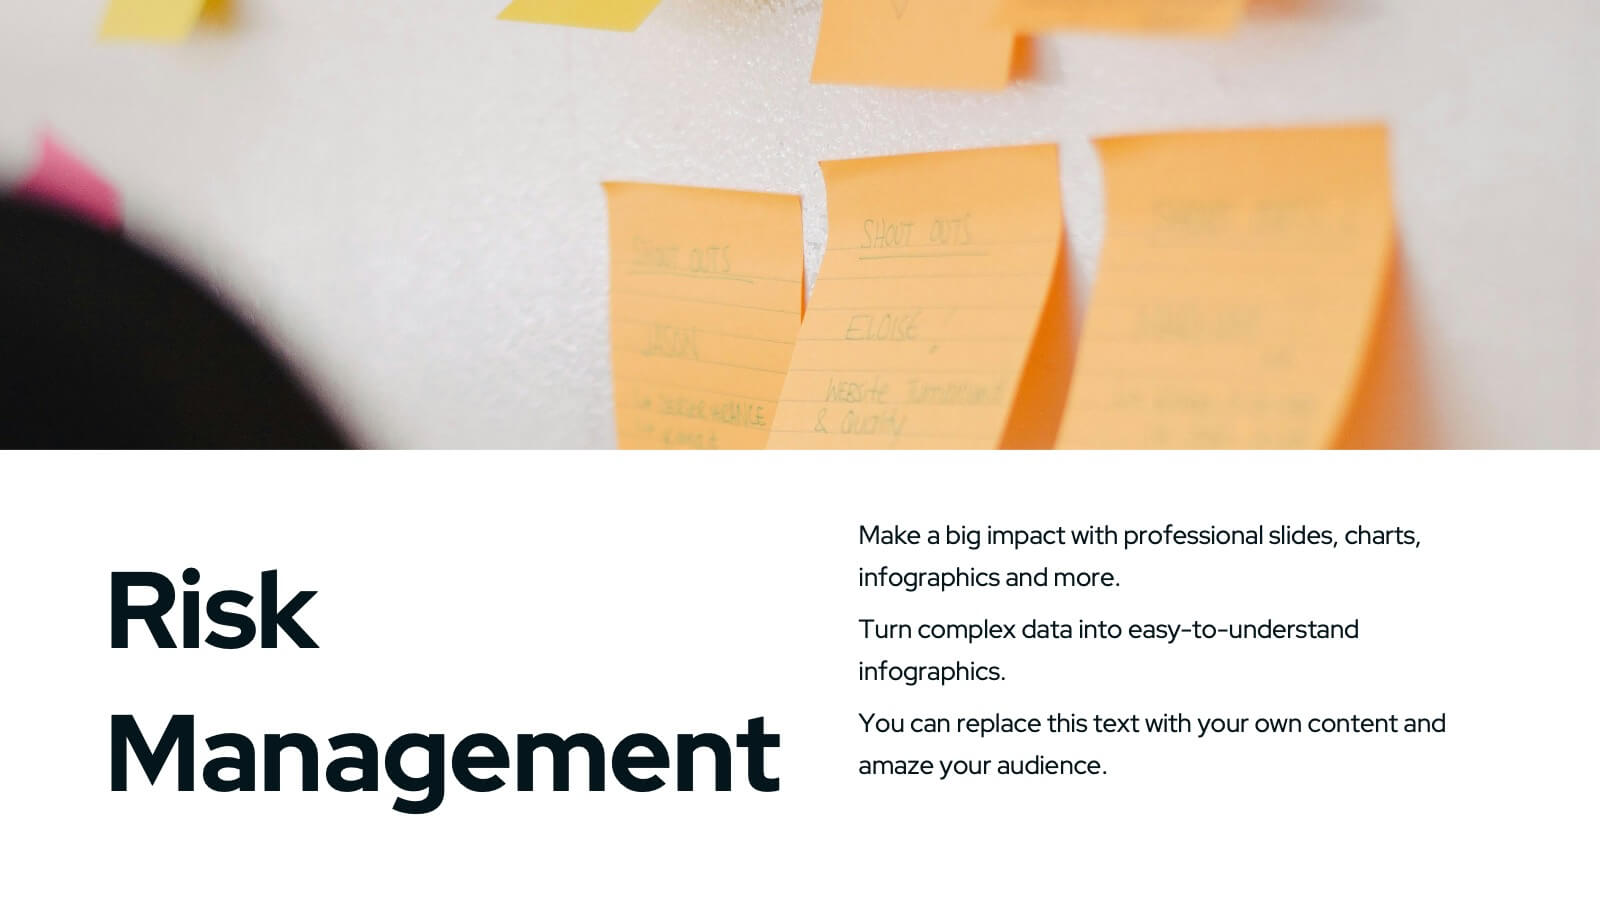
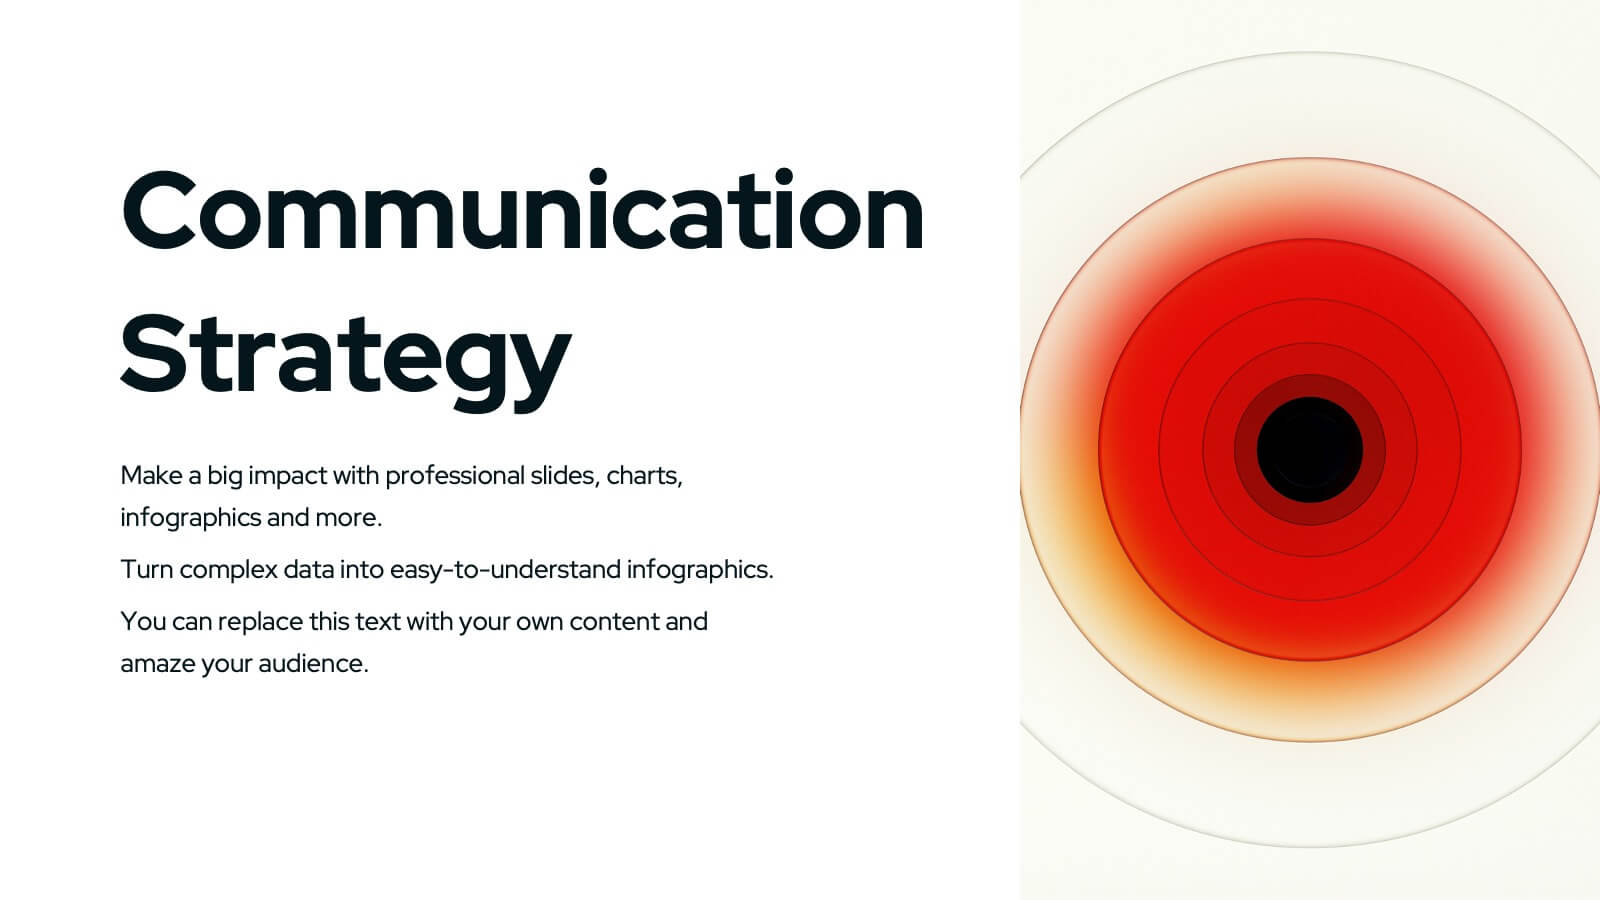
Wyrm Marketing Strategy Plan Presentation
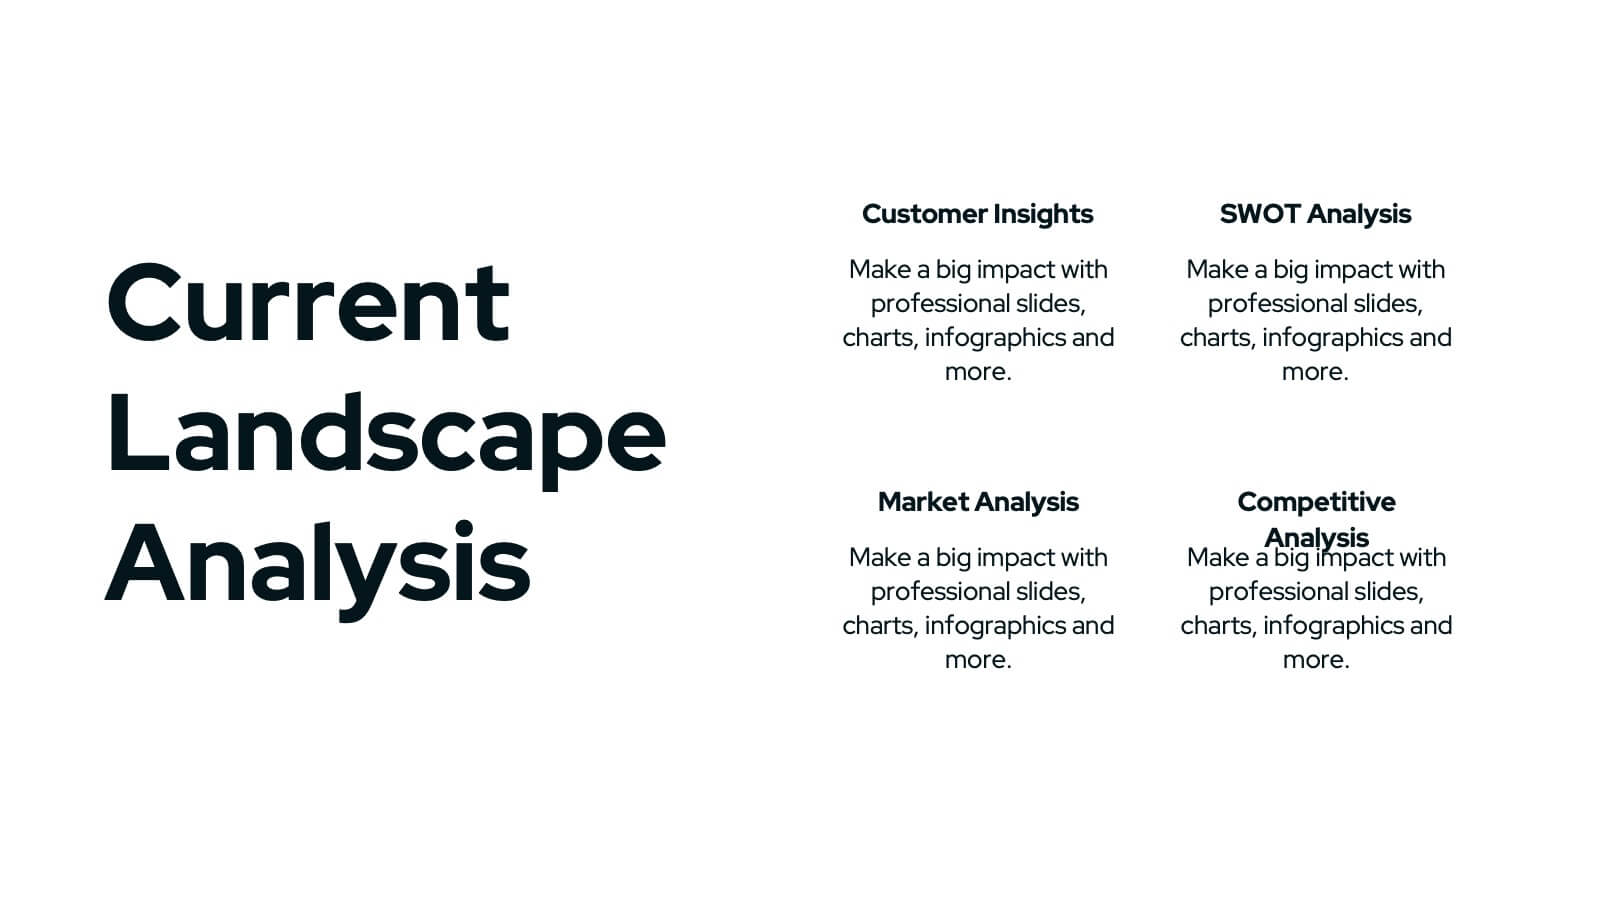
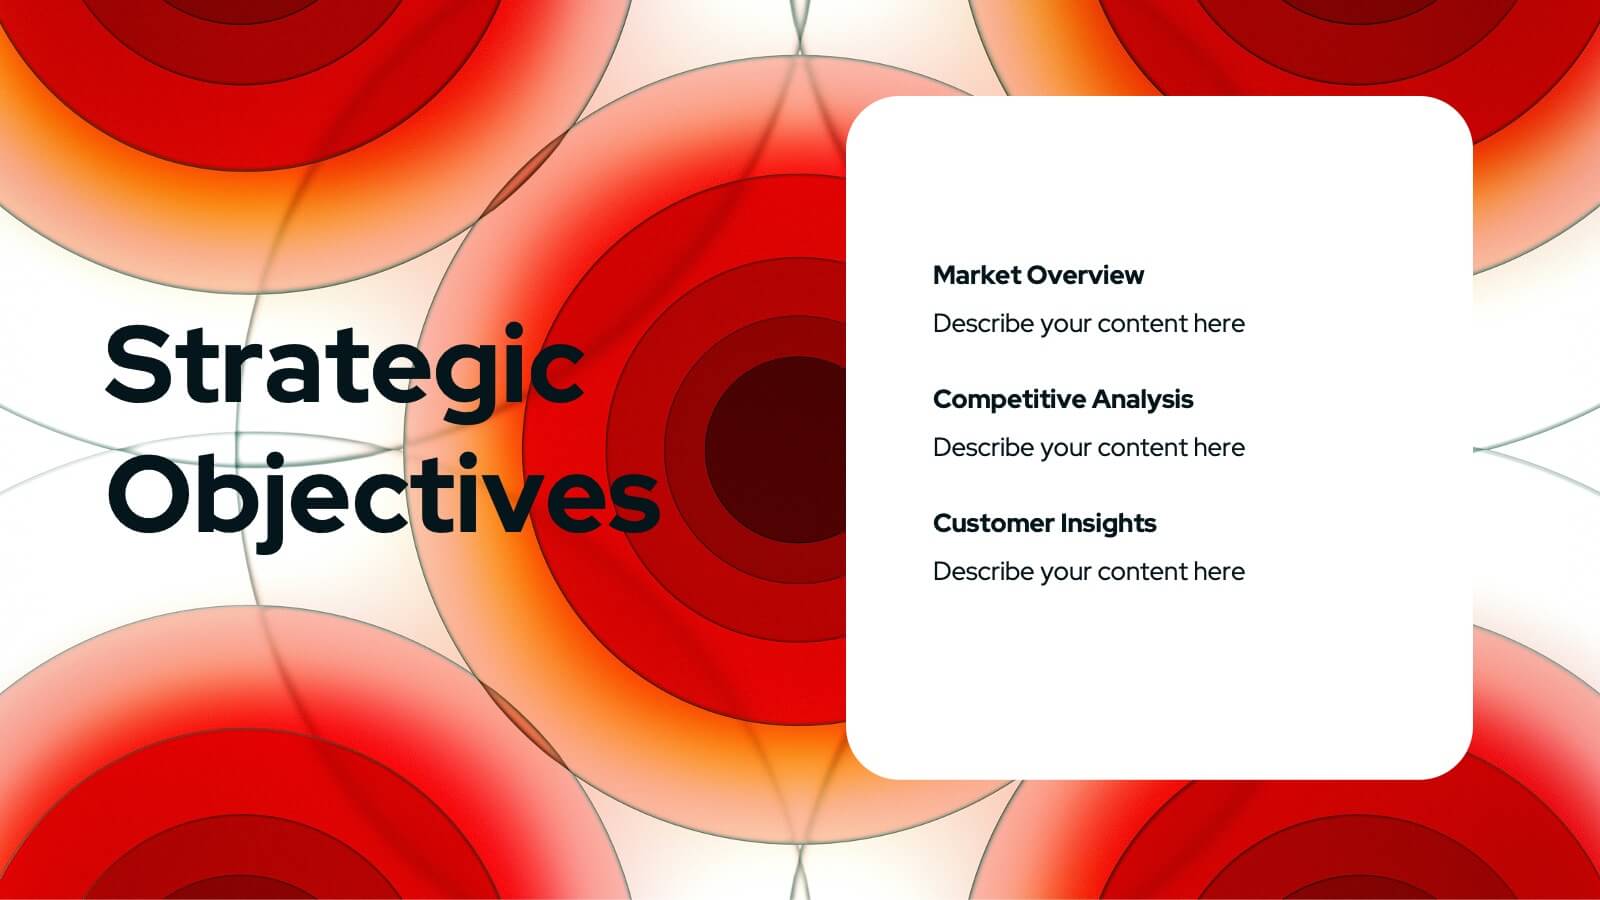
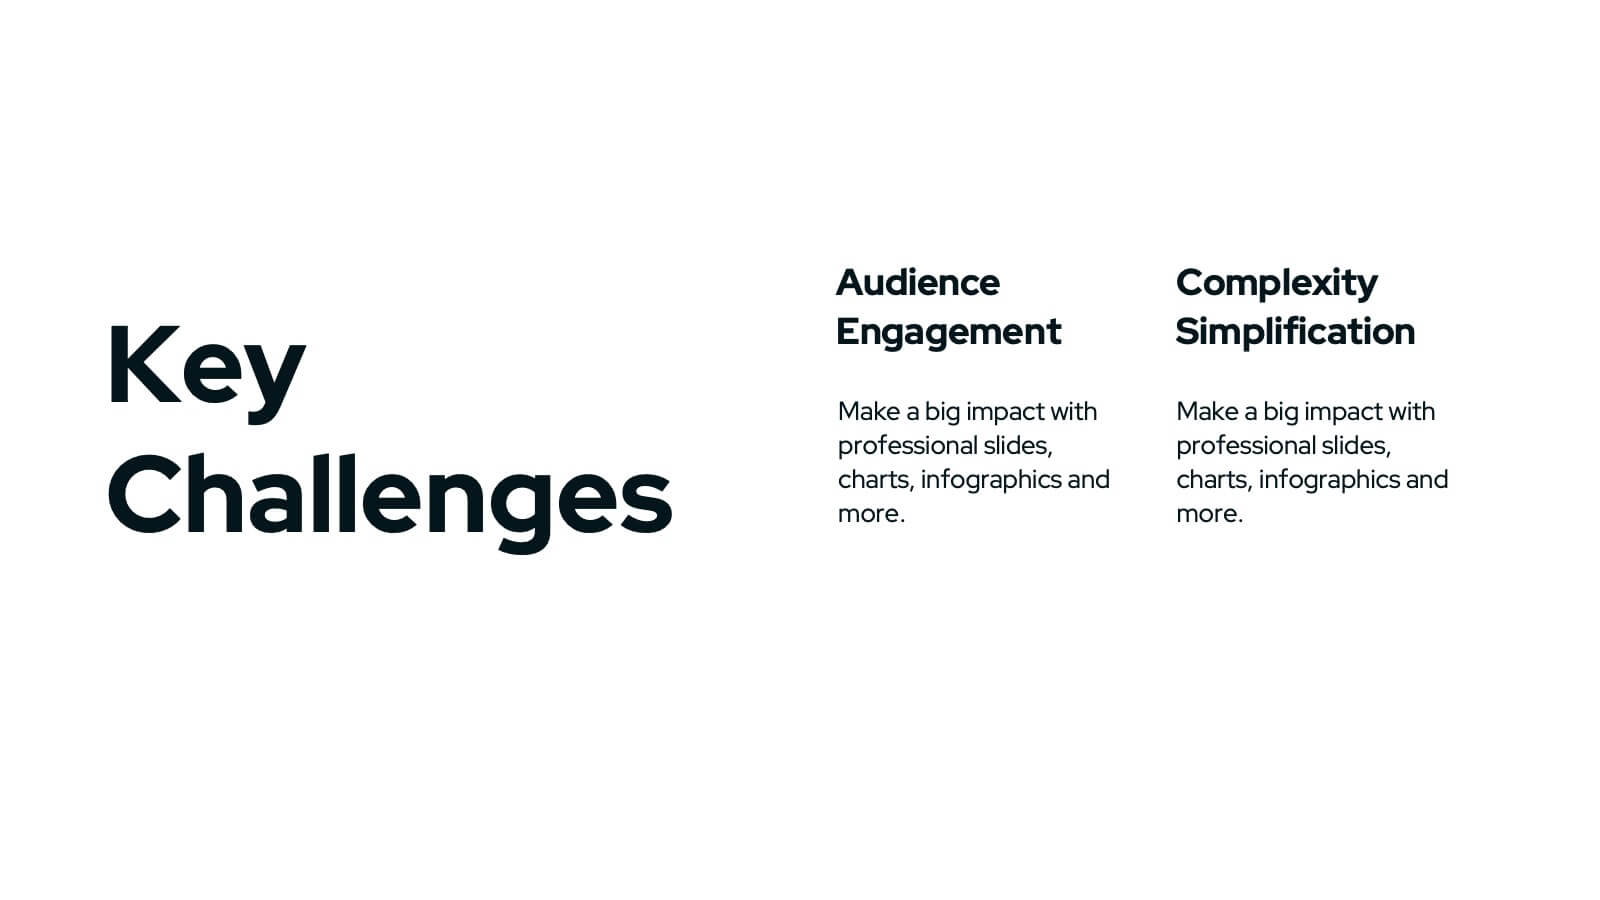
Unleash the power of your marketing strategy with this bold and dynamic presentation template! Perfect for covering everything from landscape analysis and target audience identification to performance metrics and risk management. This template helps guide your audience through key challenges, SWOT analysis, and strategic initiatives with clarity and impact. Compatible with PowerPoint, Keynote, and Google Slides for effortless and engaging presentations.


4 slides
Project Milestone Path Roadmap Presentation
Bring your project plan to life with a clean, colorful layout that makes every milestone easy to follow across each quarter. This presentation helps you organize tasks, timelines, and progress in a clear visual path that supports smarter planning and team alignment. Fully compatible with PowerPoint, Keynote, and Google Slides.


12 slides
Sales Metrics Dashboard Presentation
Unlock a sharper view of your sales story with a clean, data-driven layout that highlights performance trends at a glance. This presentation organizes KPIs, charts, and progress indicators into an easy-to-follow dashboard that supports smarter decision-making. Fully compatible with PowerPoint, Keynote, and Google Slides.


6 slides
Solution Architect Infographics
Our Solution Architect infographic is an exceptional visual aid designed for Powerpoint, Keynote, and Google Slides. This infographic is perfectly suited for solution architects, systems engineers, and IT professionals who need to convey complex architectural solutions in a clear and concise manner. The infographic is structured to outline the components of a solution architecture framework, including the software, hardware, and network infrastructure. It helps in visualizing the relationships between different system components, making it easier to understand how they work together to create a comprehensive solution. Using this infographic in your presentations will not only add a professional touch but also enhance the audience's comprehension of the solution architecture. Whether you're explaining the architecture of a new software system, the integration of various technologies, or the planning of an IT project, this infographic provides a streamlined way to share that information, ensuring your concepts are communicated effectively.


4 slides
Gap Identification for Strategic Planning Presentation
Bridge the gap between where you are and where you want to be with this clean and practical layout. Ideal for outlining current challenges, action plans, and future goals, this presentation template helps visualize strategic progress with clarity. Fully compatible with PowerPoint, Keynote, and Google Slides.


7 slides
Question Infographic
Enhance your presentations and encourage audience engagement with our collection of slide templates, designed to prompt interactive discussions and feedback. This assortment features a variety of styles, from clean and simple to colorful and dynamic, ensuring the perfect fit for the atmosphere and theme of any presentation. Each template is thoughtfully crafted to captivate your audience and facilitate a seamless transition into Q&A sessions. Whether concluding a business meeting, educational lecture, or training seminar, these slides provide an elegant and effective way to invite questions and foster open communication. Fully customizable, these templates can be tailored to align seamlessly with your presentation's overall aesthetic, reinforcing your message while encouraging participation. Ideal for drawing attention and sparking dialogue, they help create a more interactive and engaging presentation experience.


3 slides
Business Revenue Break-Even Strategy Presentation
Understand profitability with the Business Revenue Break-Even Strategy template. This visual tool illustrates the break-even point, helping businesses analyze costs, revenue, and profitability. Ideal for financial planning, it simplifies complex data into an easy-to-read format. Fully customizable and compatible with PowerPoint, Keynote, and Google Slides for seamless presentations.


5 slides
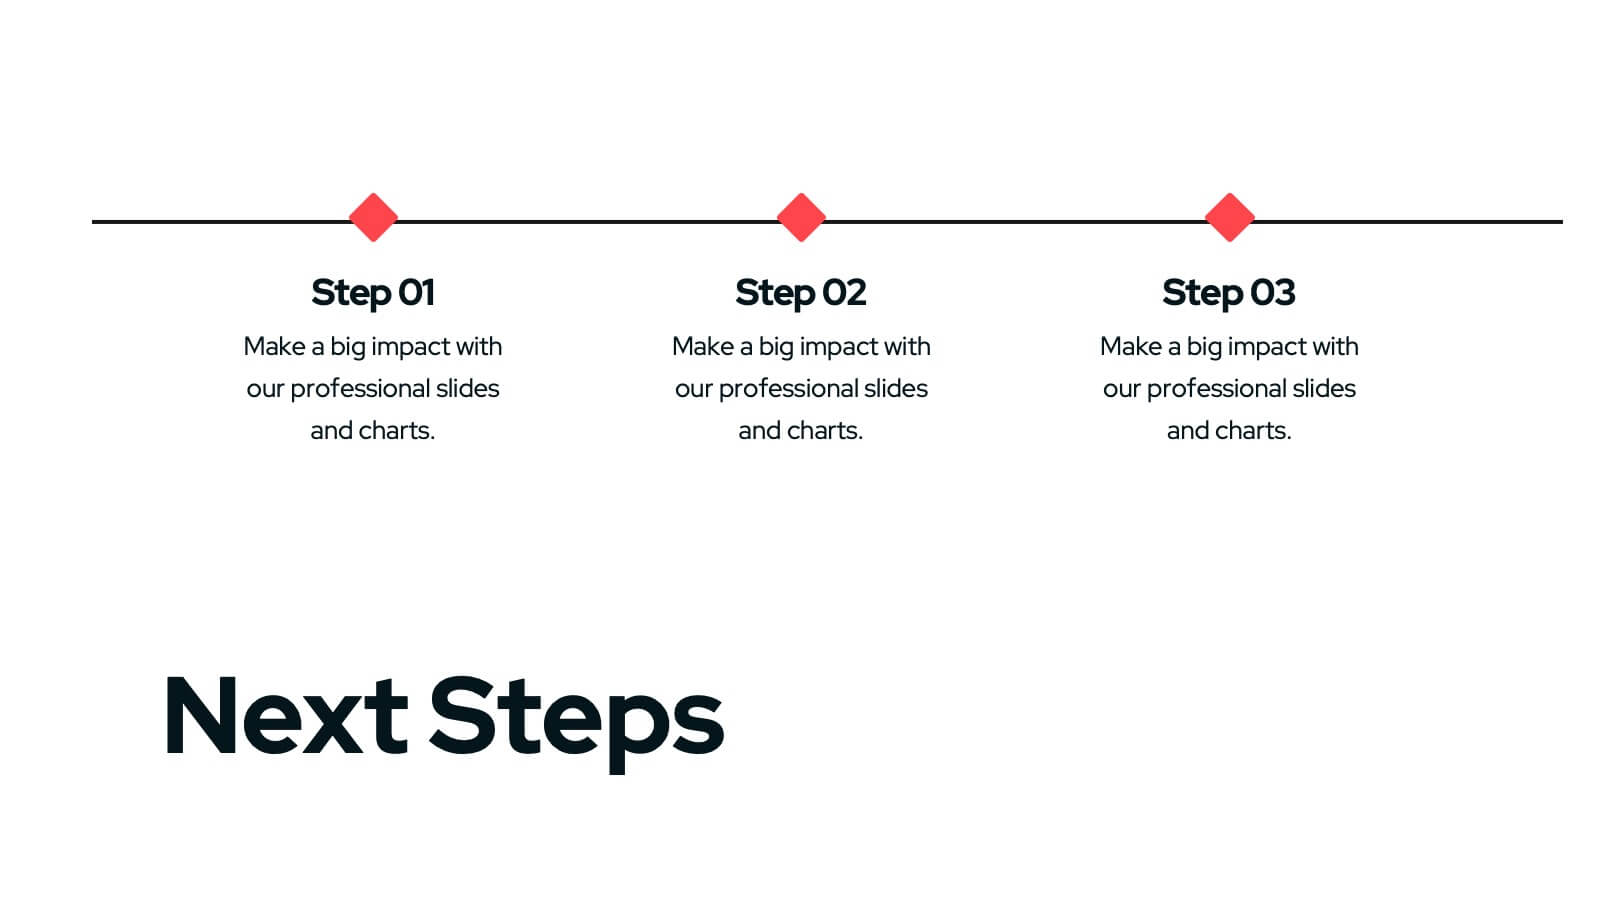
Project Execution Next Steps Presentation
Streamline your workflow with the Project Execution Next Steps Presentation template. Designed for project managers and teams, this visual slide helps break down execution phases into clear, actionable steps. The connected chain layout ensures smooth project tracking, making it easy to communicate progress and responsibilities. Fully customizable in PowerPoint, Keynote, and Google Slides for seamless project planning and execution.


7 slides
Harvey Ball Infographics Presentation Template
Featuring our Harvey Ball Infographic template, this is best used for presenting data from a variety of sources in an interactive way, showing charts and graphs, with the main point highlighted by using a bullet-pointed list at the bottom of the slide. This presentation template was designed to help you put your data into a visual representation that will capture the attention of your audience. This is great for business presentations and data visualizations, it is simple to create a professional looking presentations that will showcase your data in the most effective way possible.


26 slides
Blockchain for Businesses Presentation
Navigate the world of decentralized technology with our Blockchain for Businesses presentation template, compatible with PowerPoint, Keynote, and Google Slides. Tailored for business leaders, tech entrepreneurs, and financial experts, this template is a gateway to understanding blockchain's impact on the corporate landscape. Our template demystifies blockchain, presenting its core concepts and applications in business, from enhancing security to streamlining transactions. It provides a visual narrative to explain how blockchain can be a game-changer in various industries by fostering transparency, efficiency, and trust. With customizable diagrams, charts, and case studies, you can illustrate the practical benefits of blockchain integration in business operations. This template is SEO-optimized to reach audiences interested in leveraging blockchain technology for competitive advantage. Use our template to educate your audience about the strategic implementation of blockchain and position your business at the forefront of technological innovation.


5 slides
Ideal Customer Profile Breakdown
Shine a light on your perfect customer with this bright, idea-inspired layout—designed to guide you through the essential traits, needs, and behaviors that define your ideal client. Perfect for marketing strategy, sales enablement, or persona creation. Fully compatible with PowerPoint, Keynote, and Google Slides.