


Features
- 10 Unique slides
- Fully editable and easy to edit in Microsoft Powerpoint, Keynote and Google Slides
- 16:9 widescreen layout
- Clean and professional designs
- Export to JPG, PDF or send by email


Do you have any questions?
Recommend
23 slides
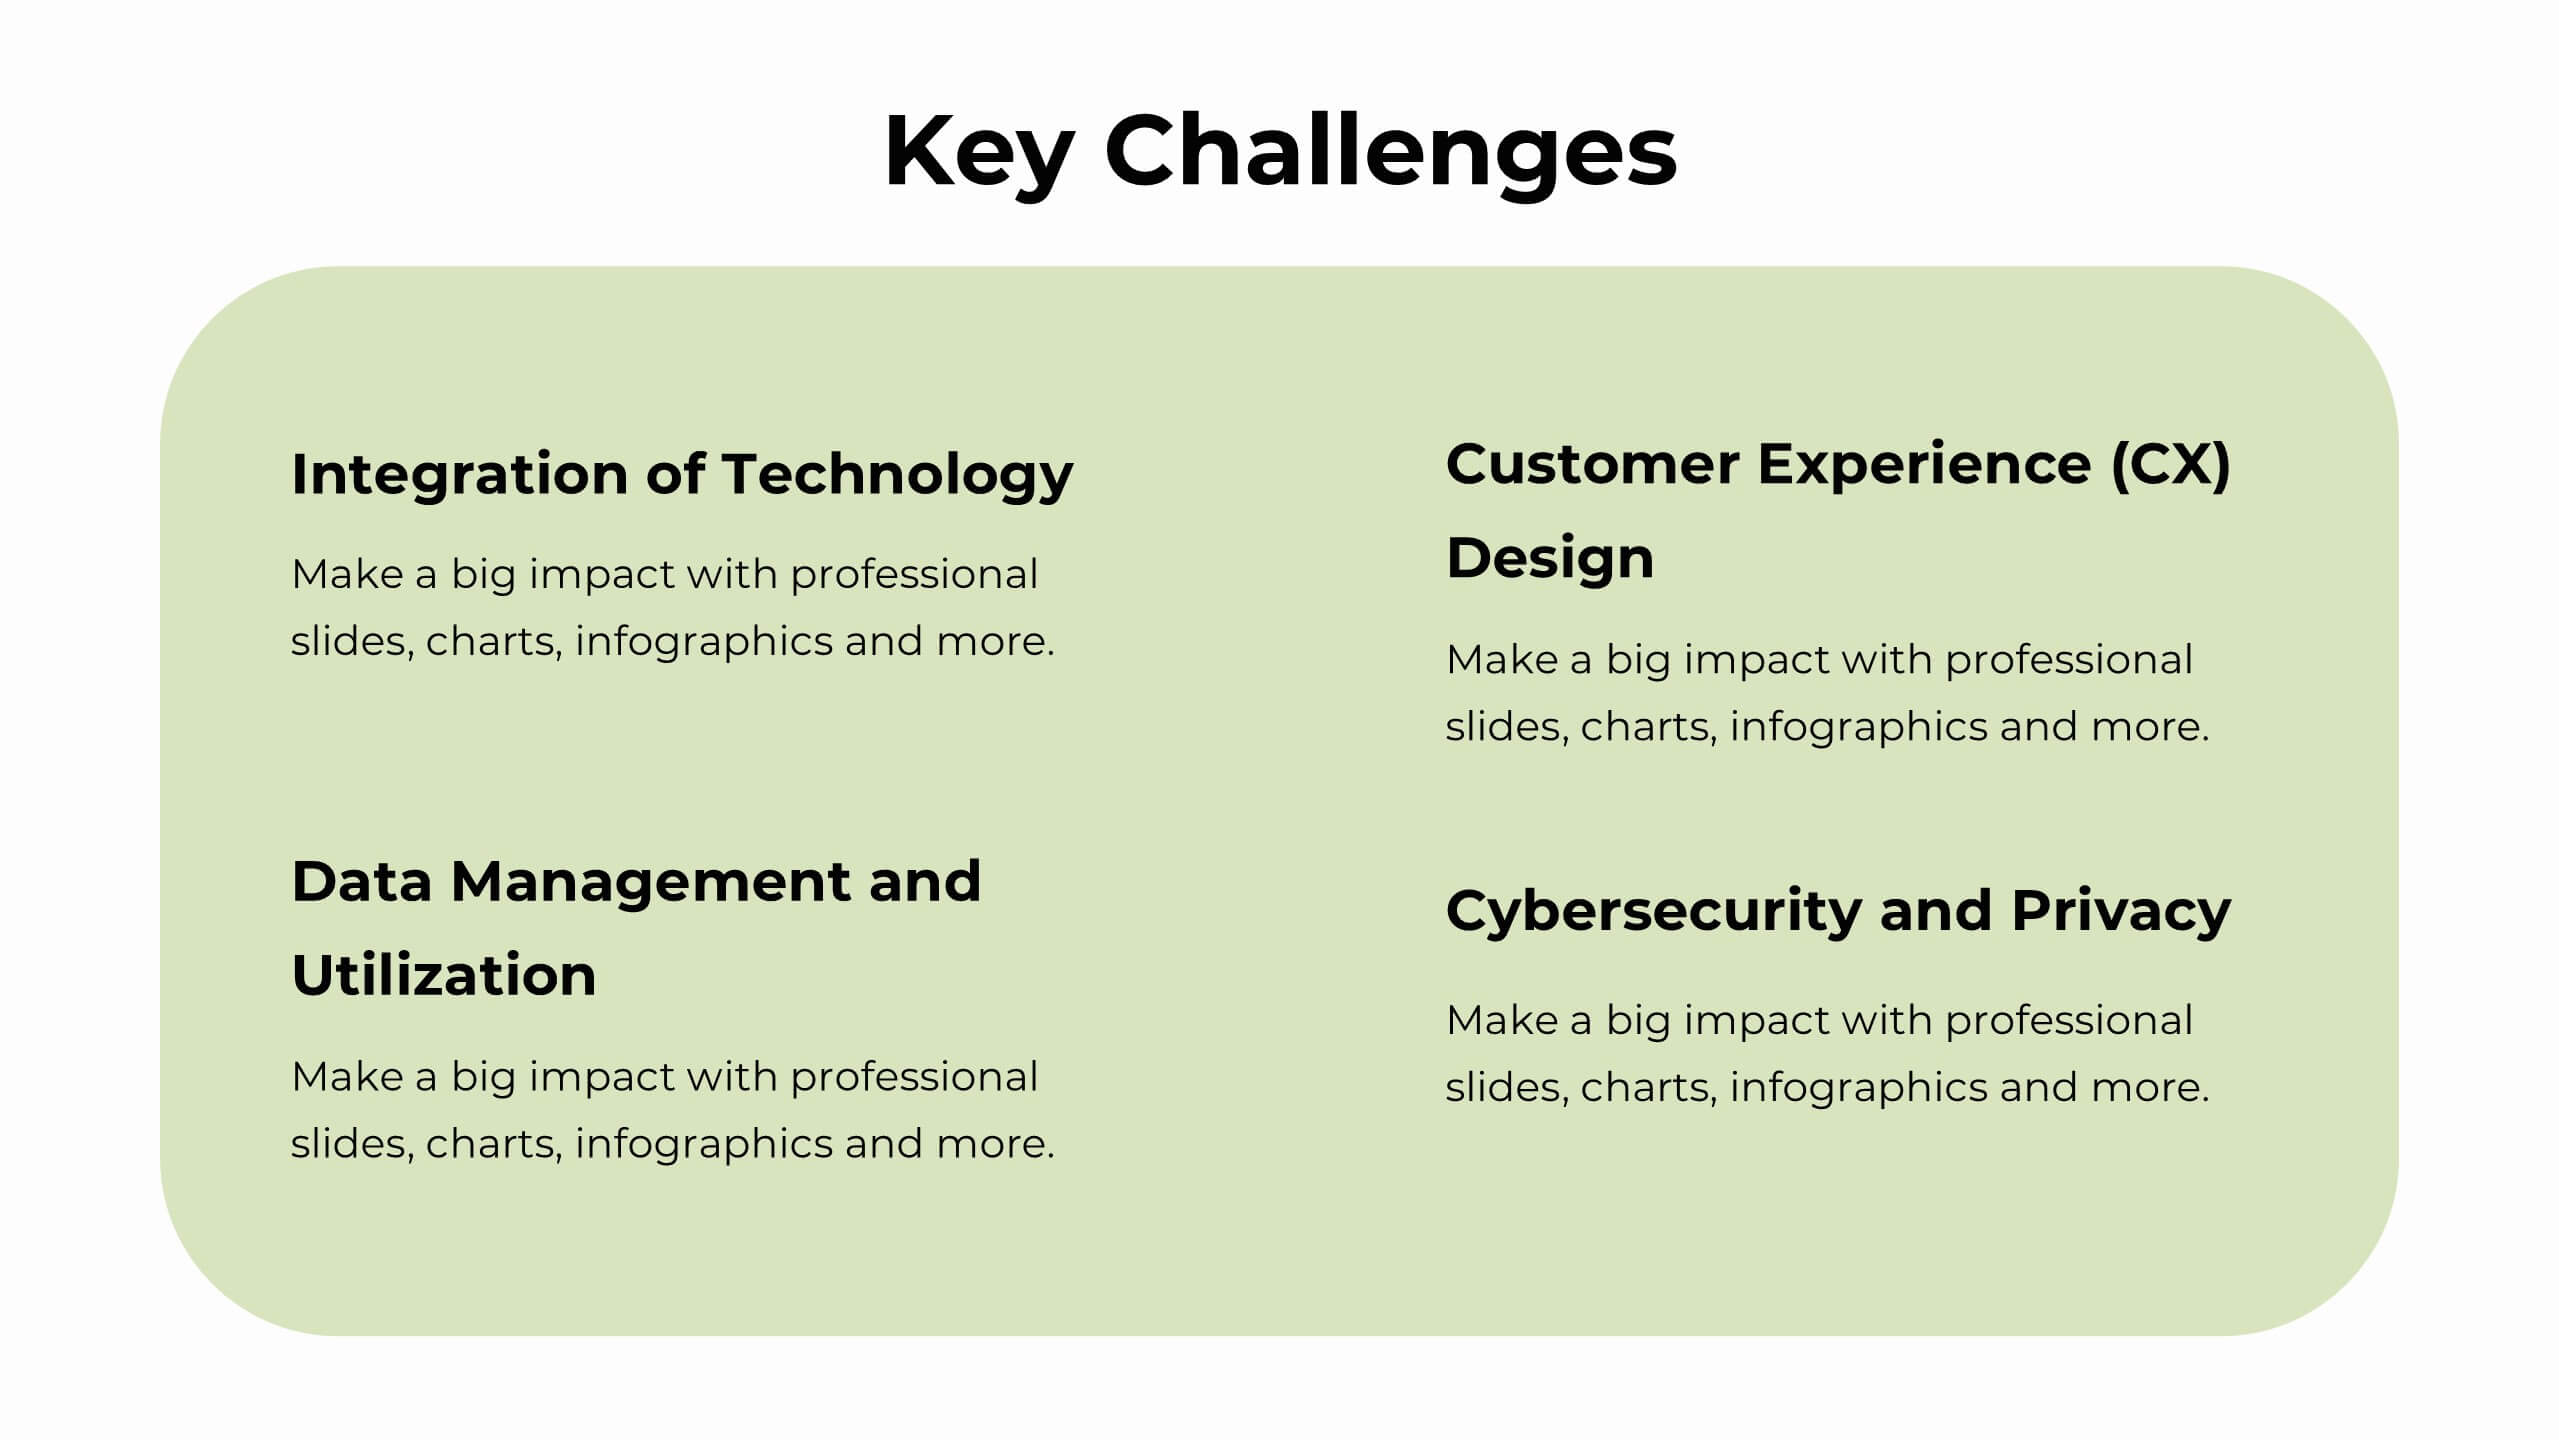
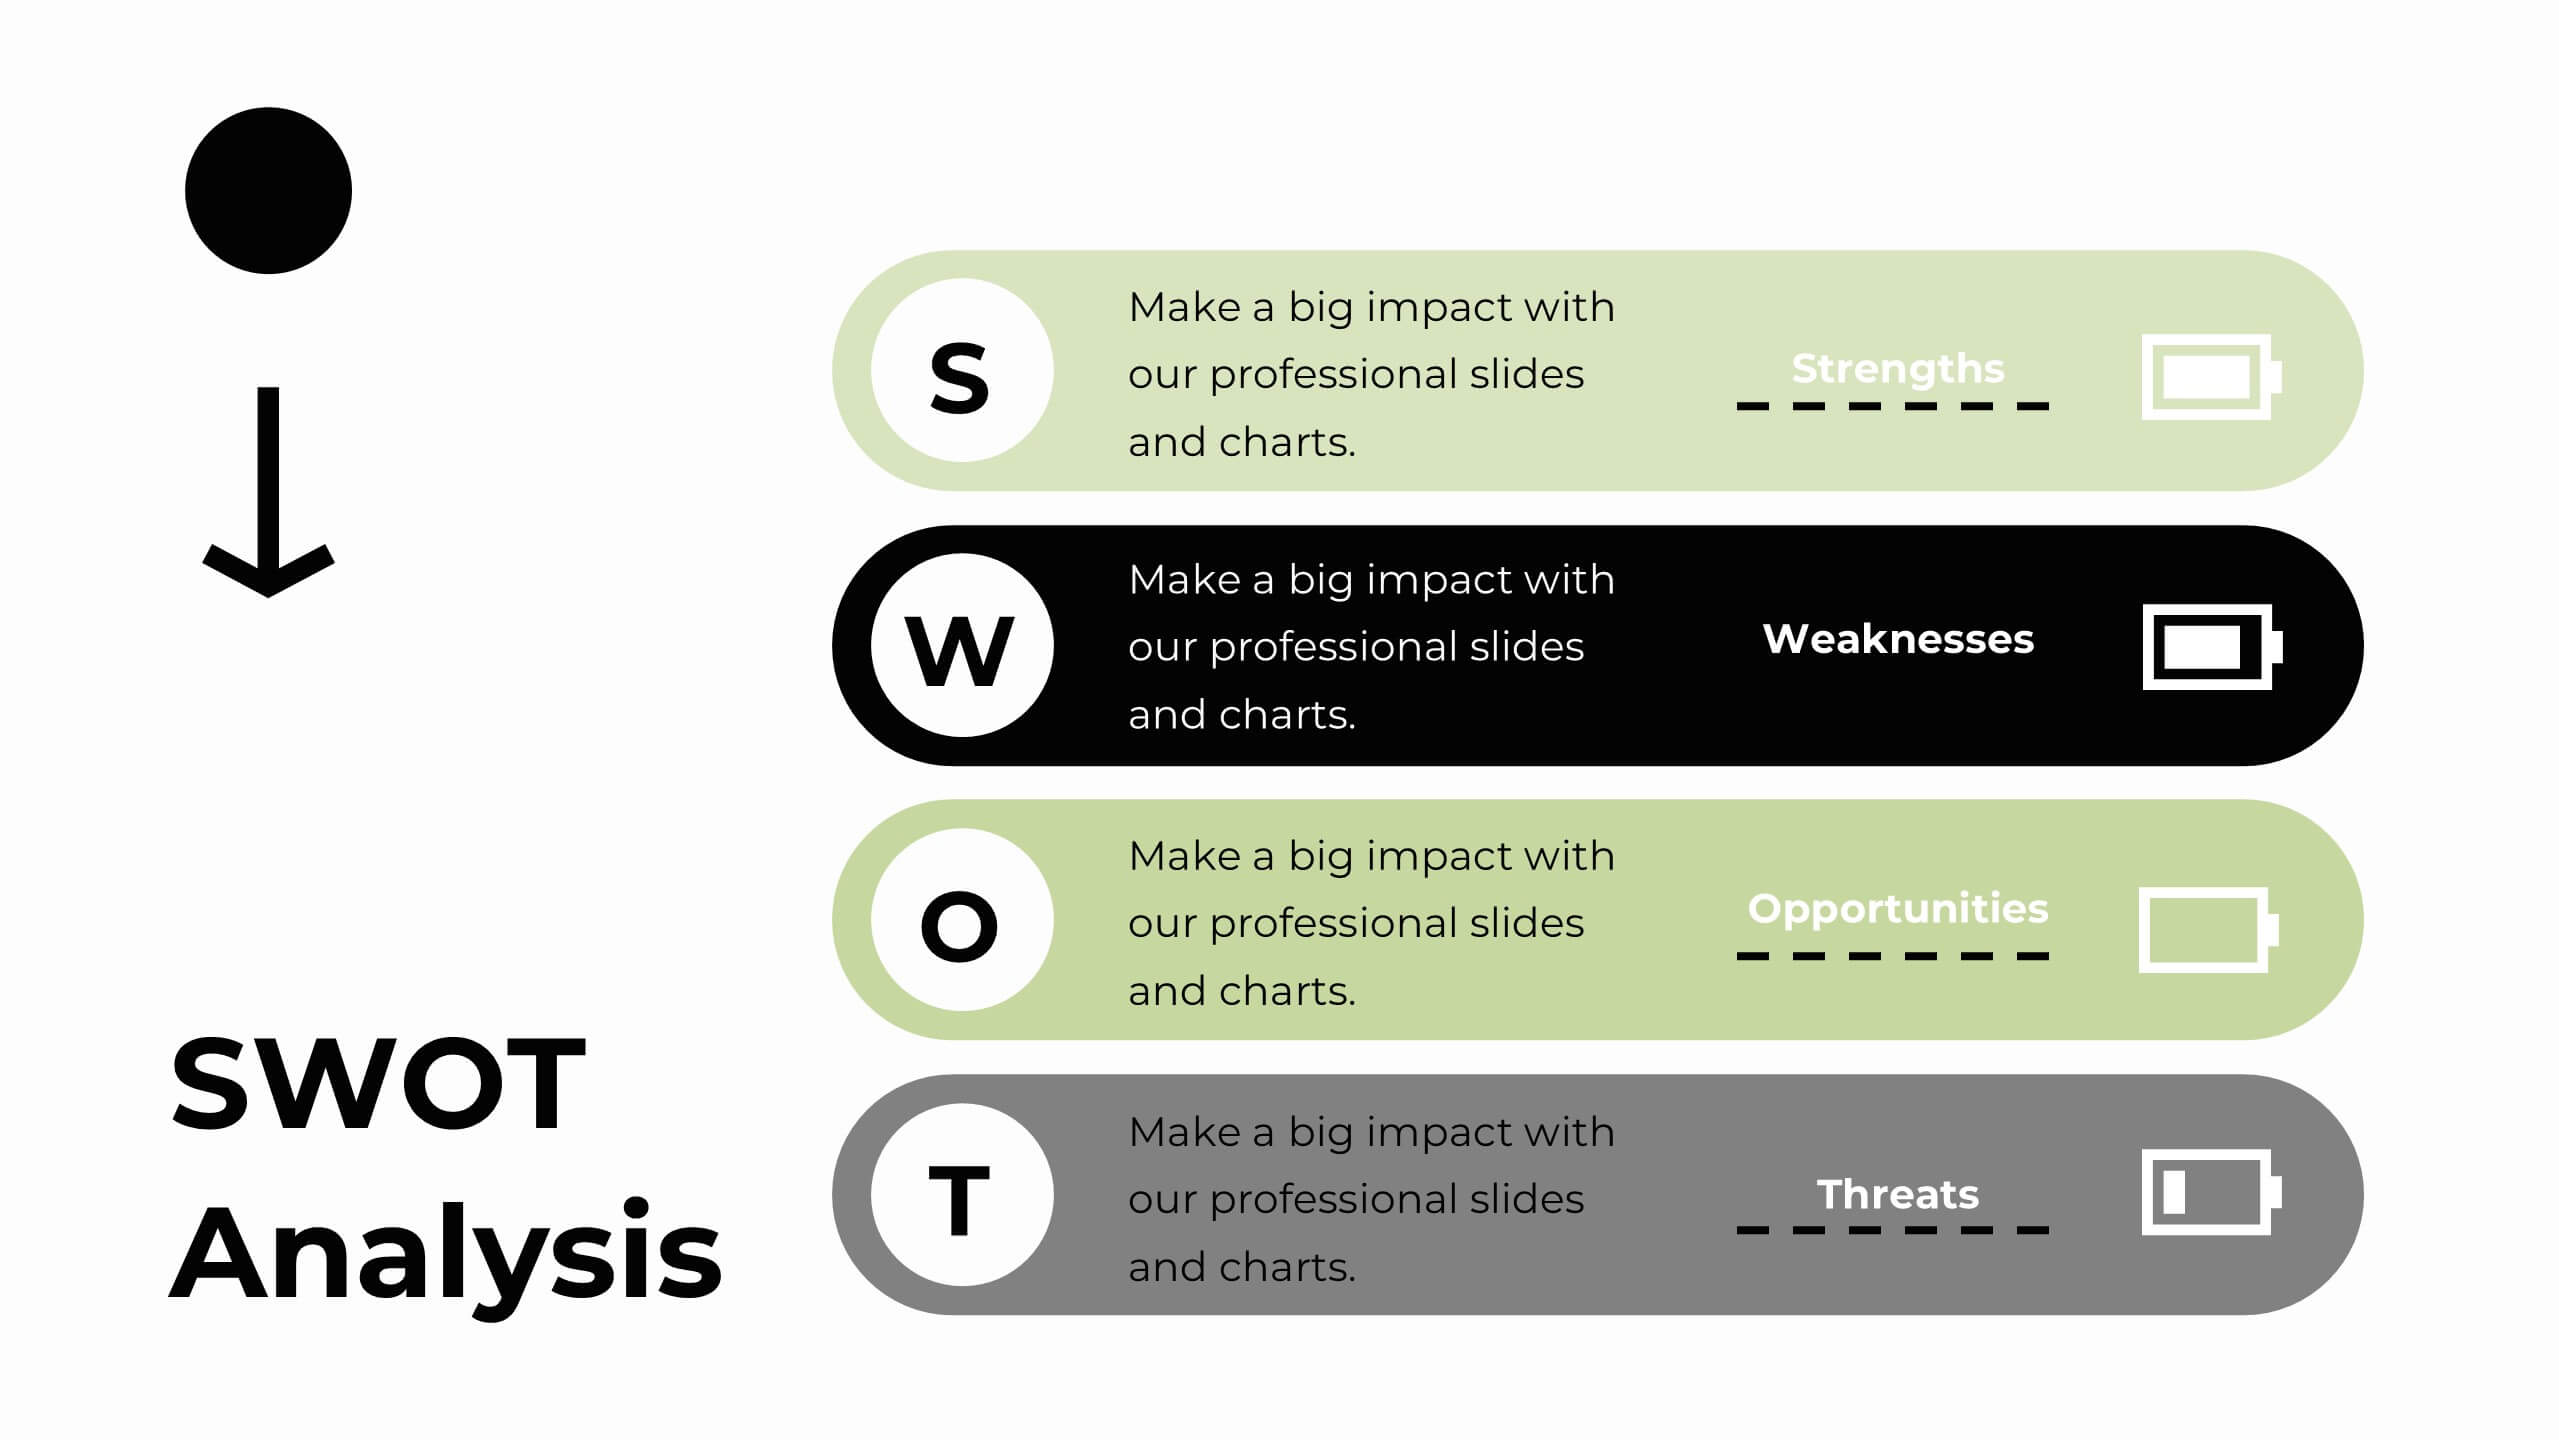
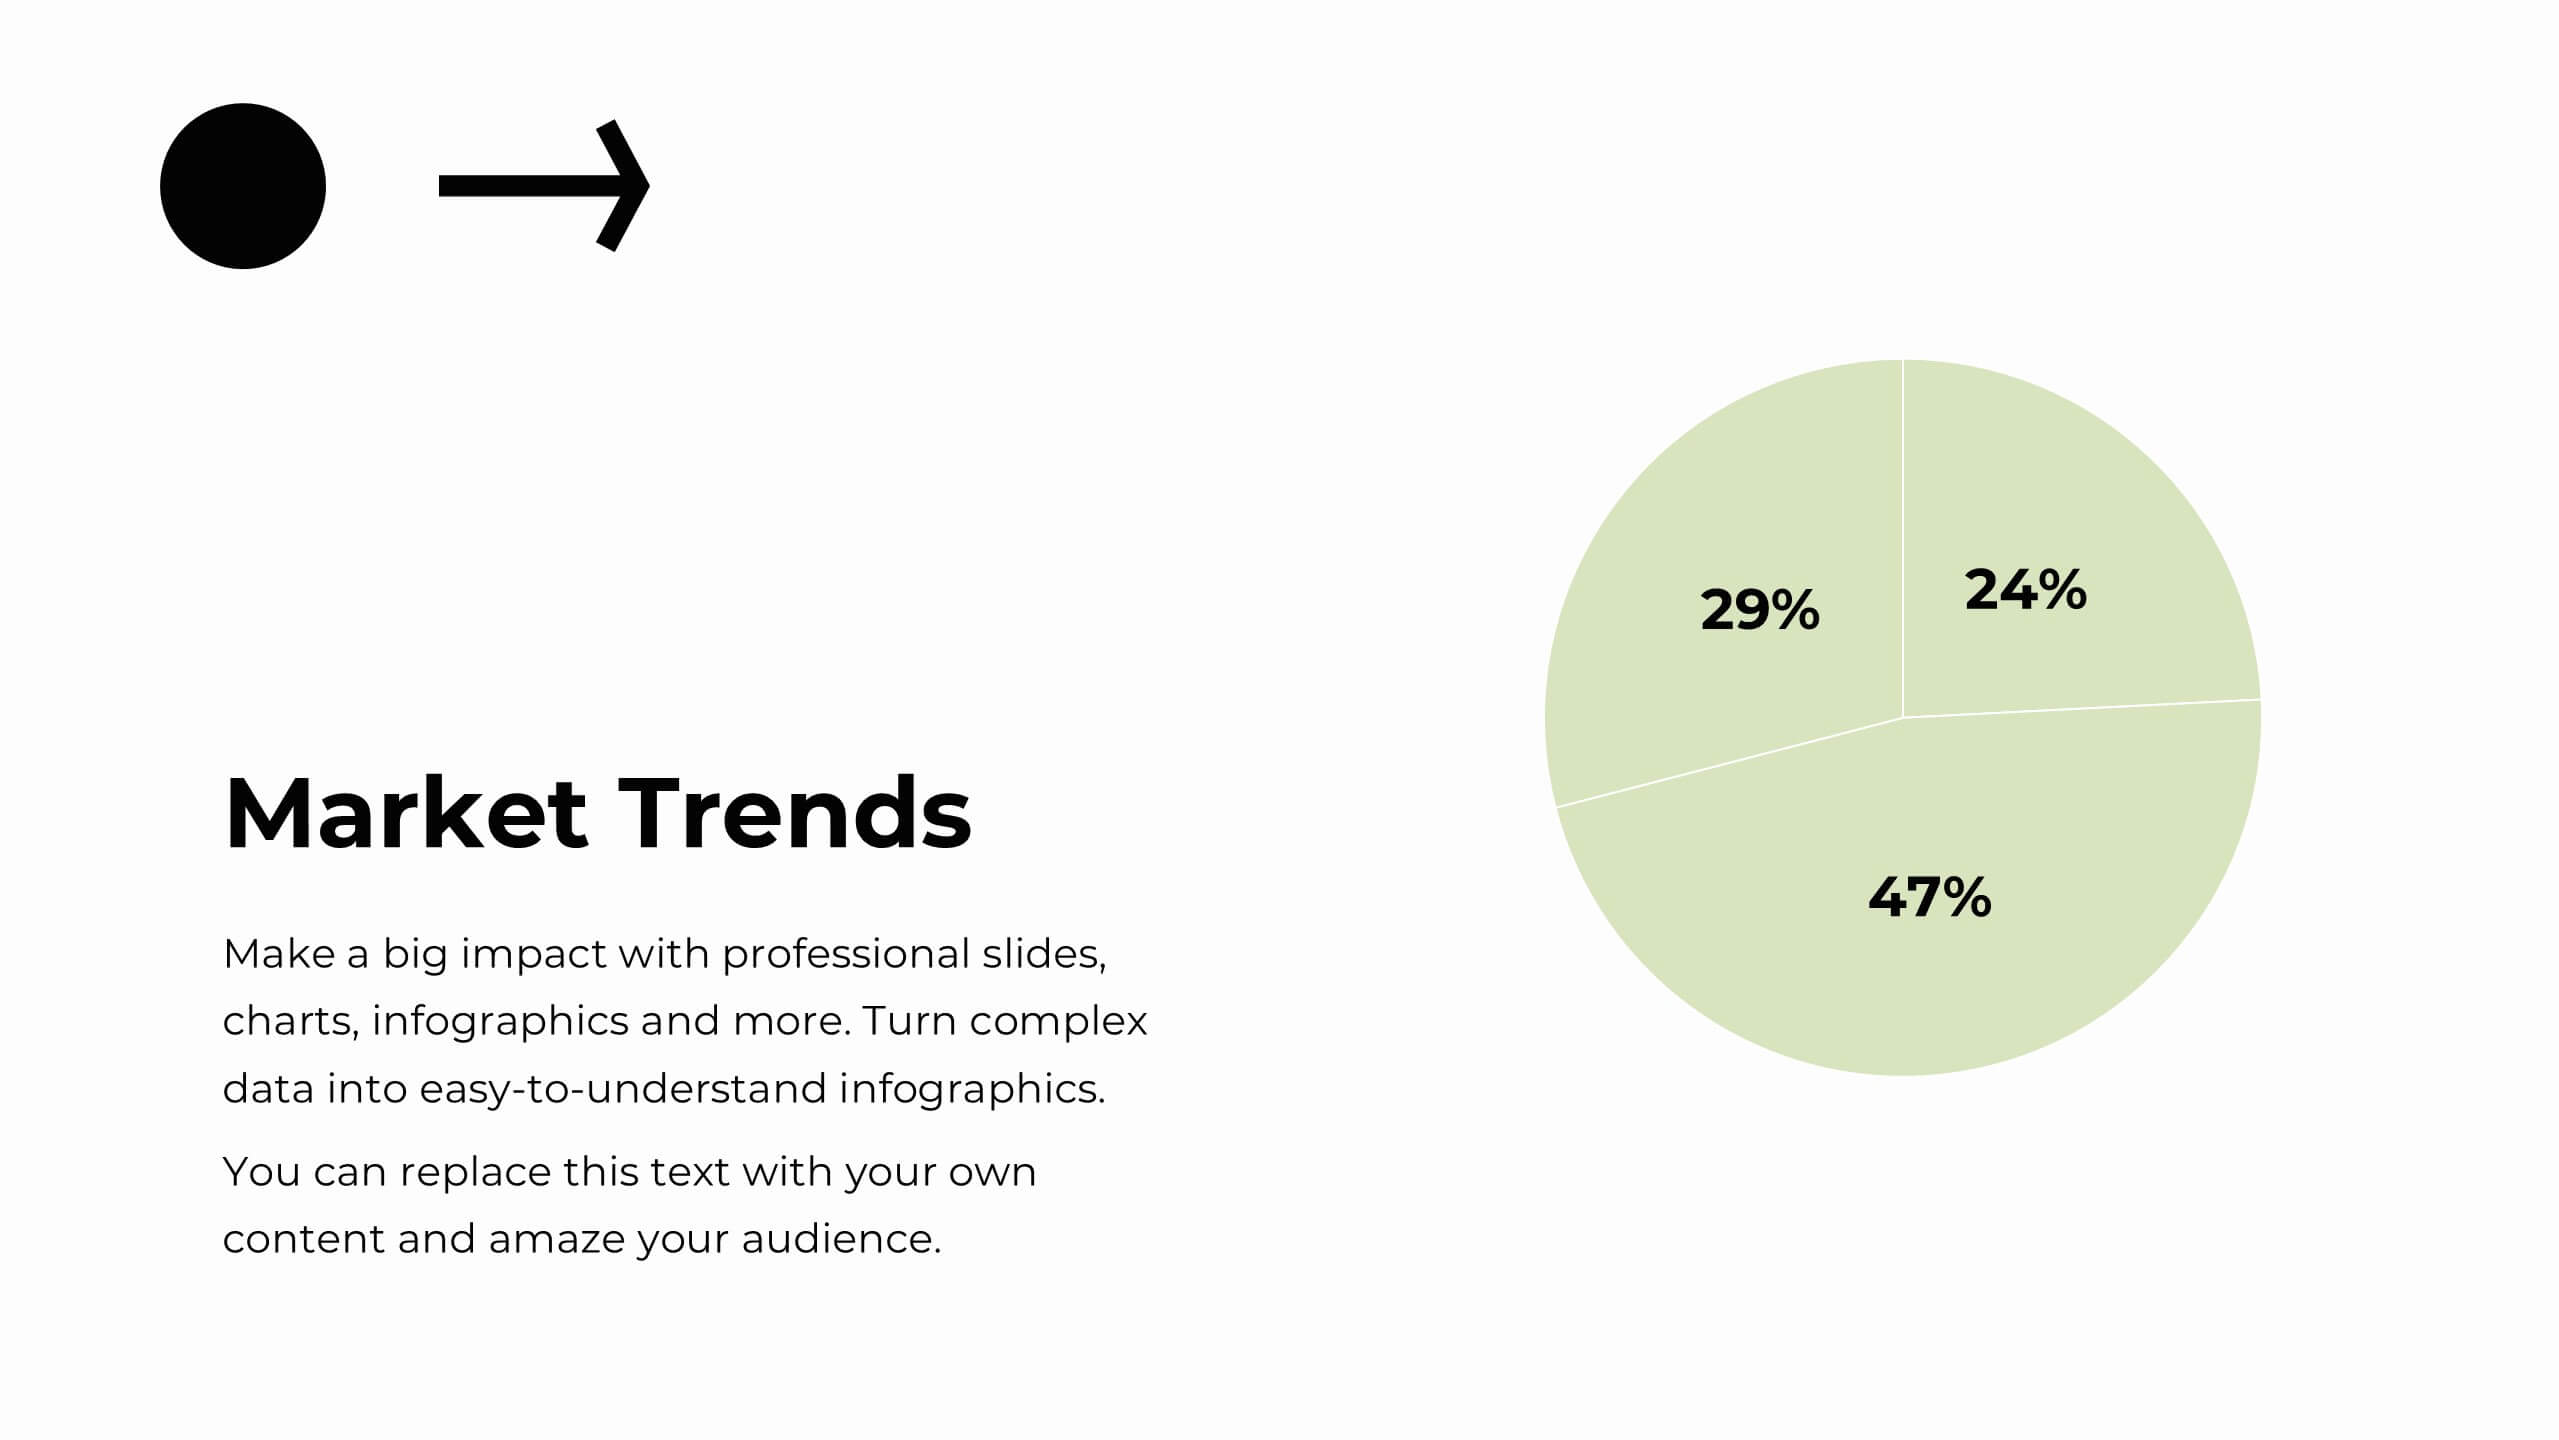
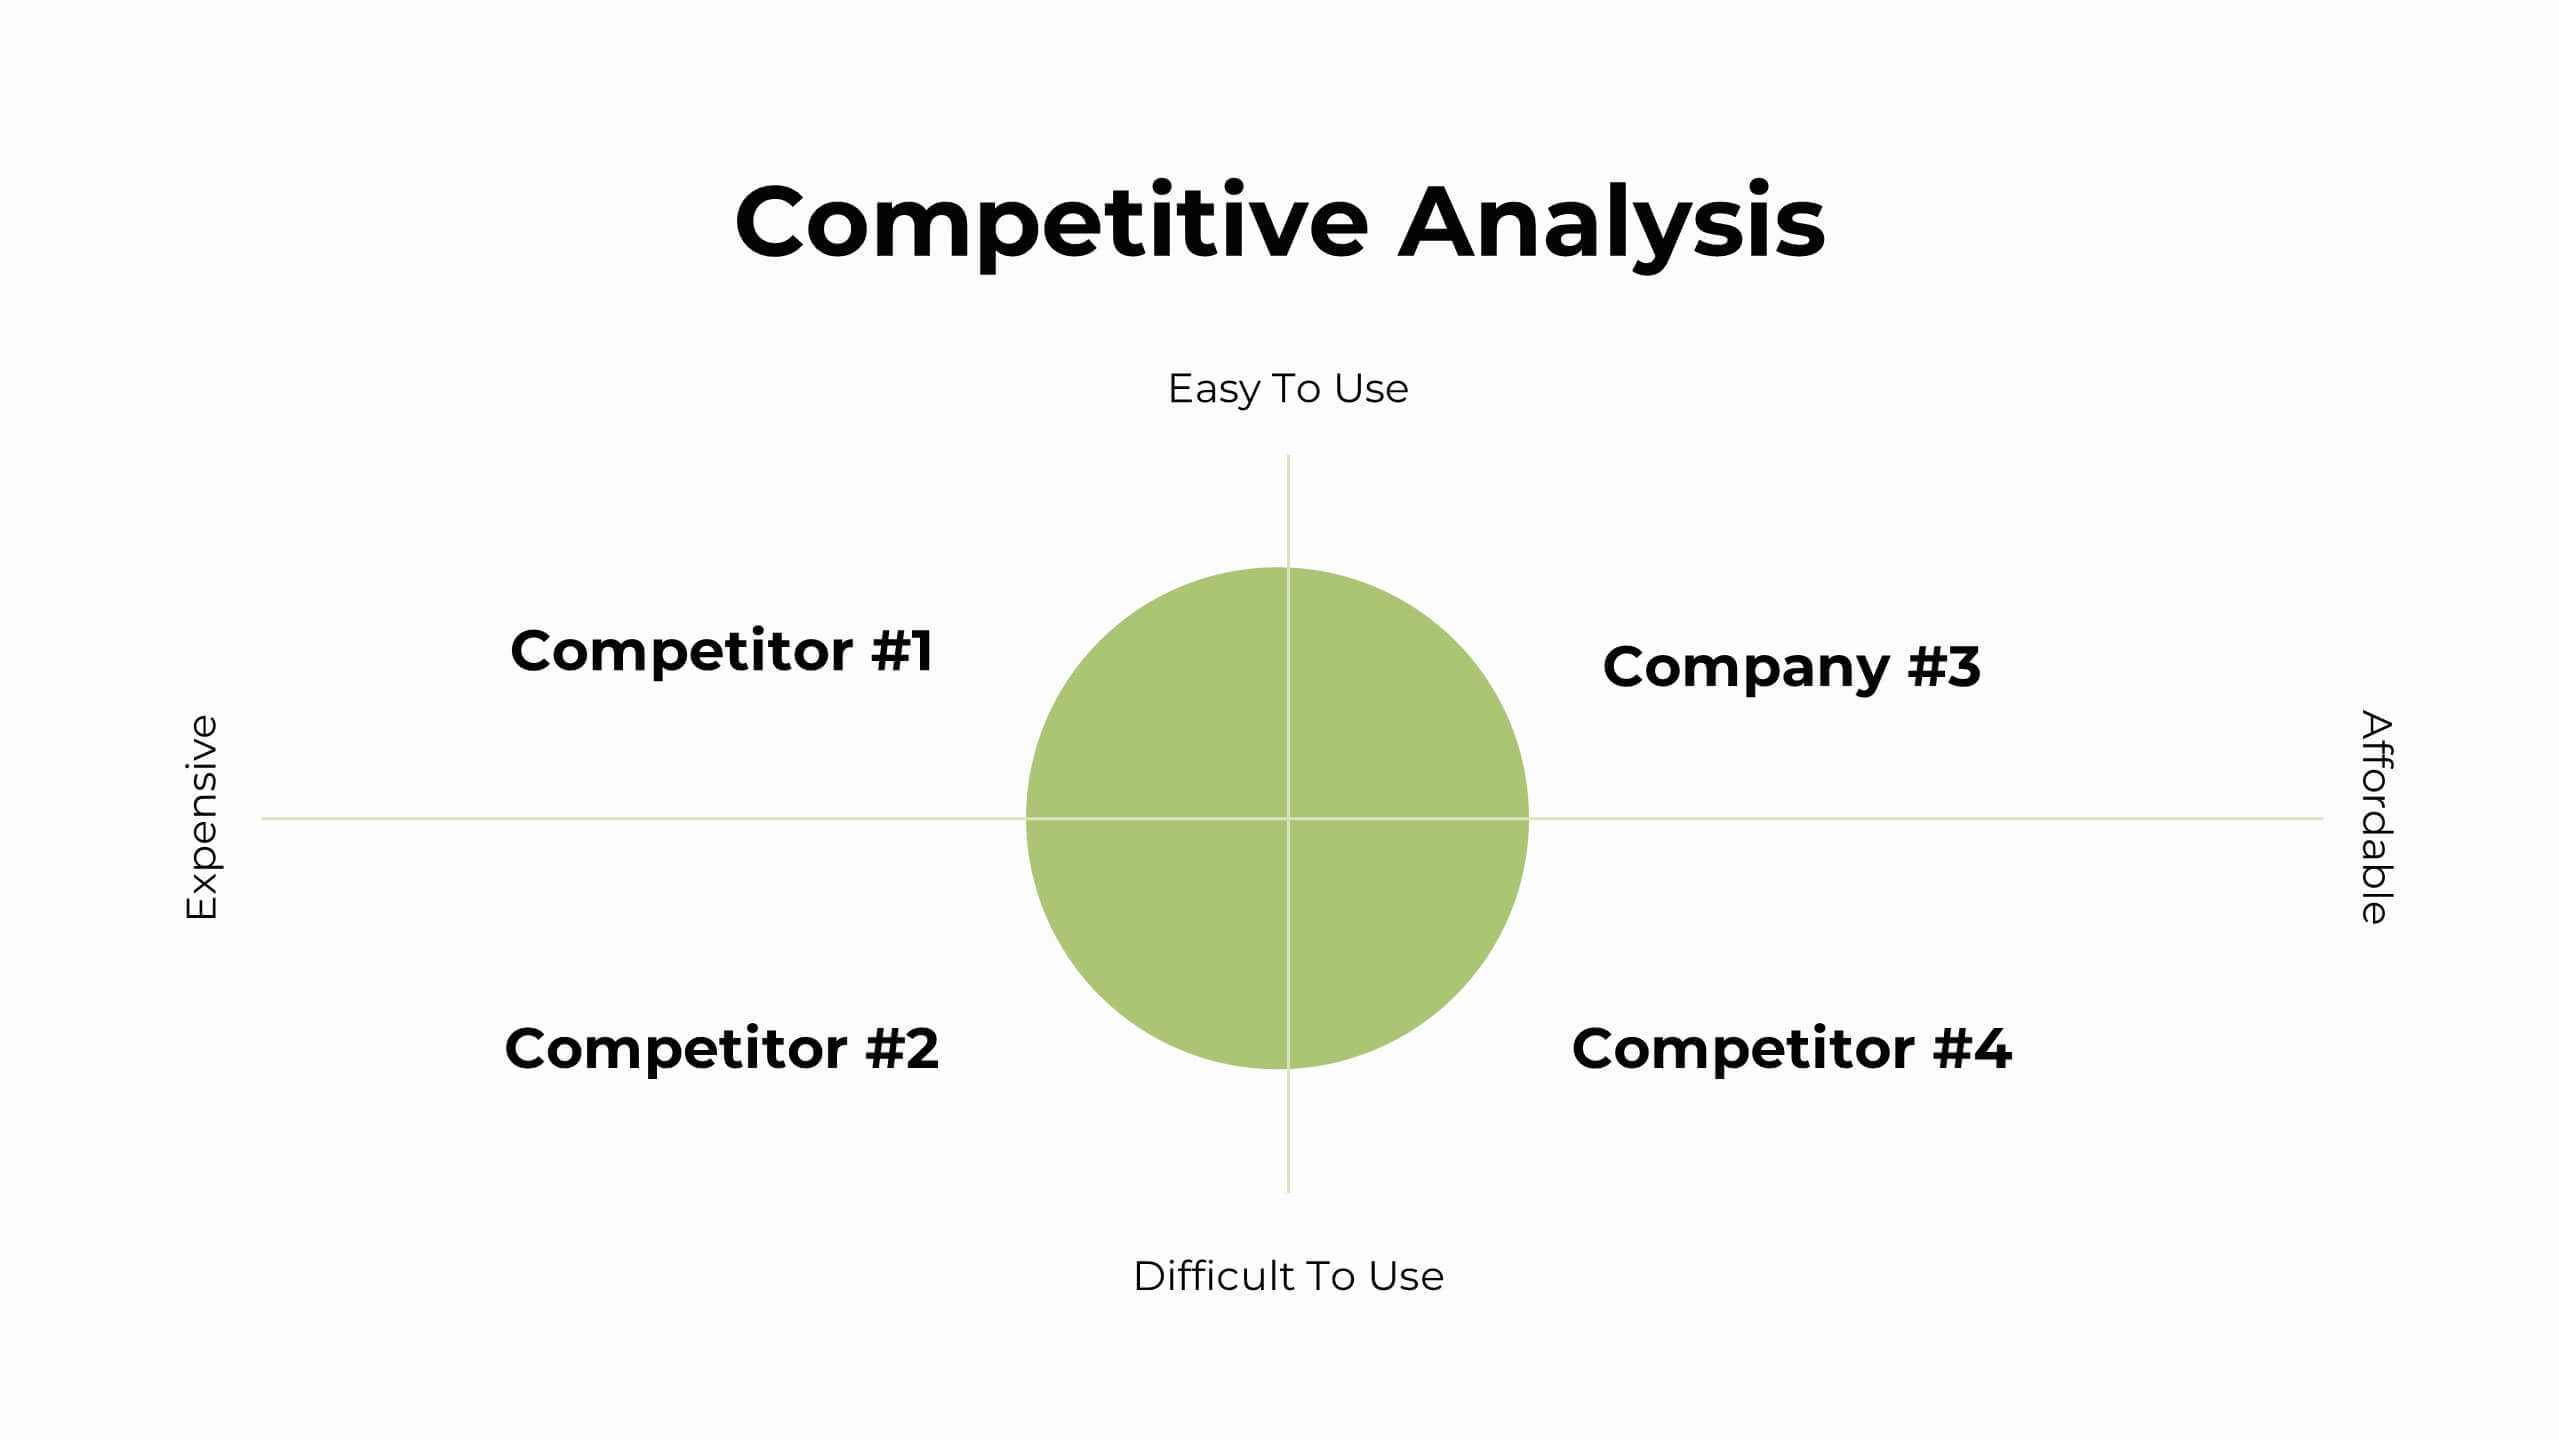
Zirconium Strategic Planning Report Presentation
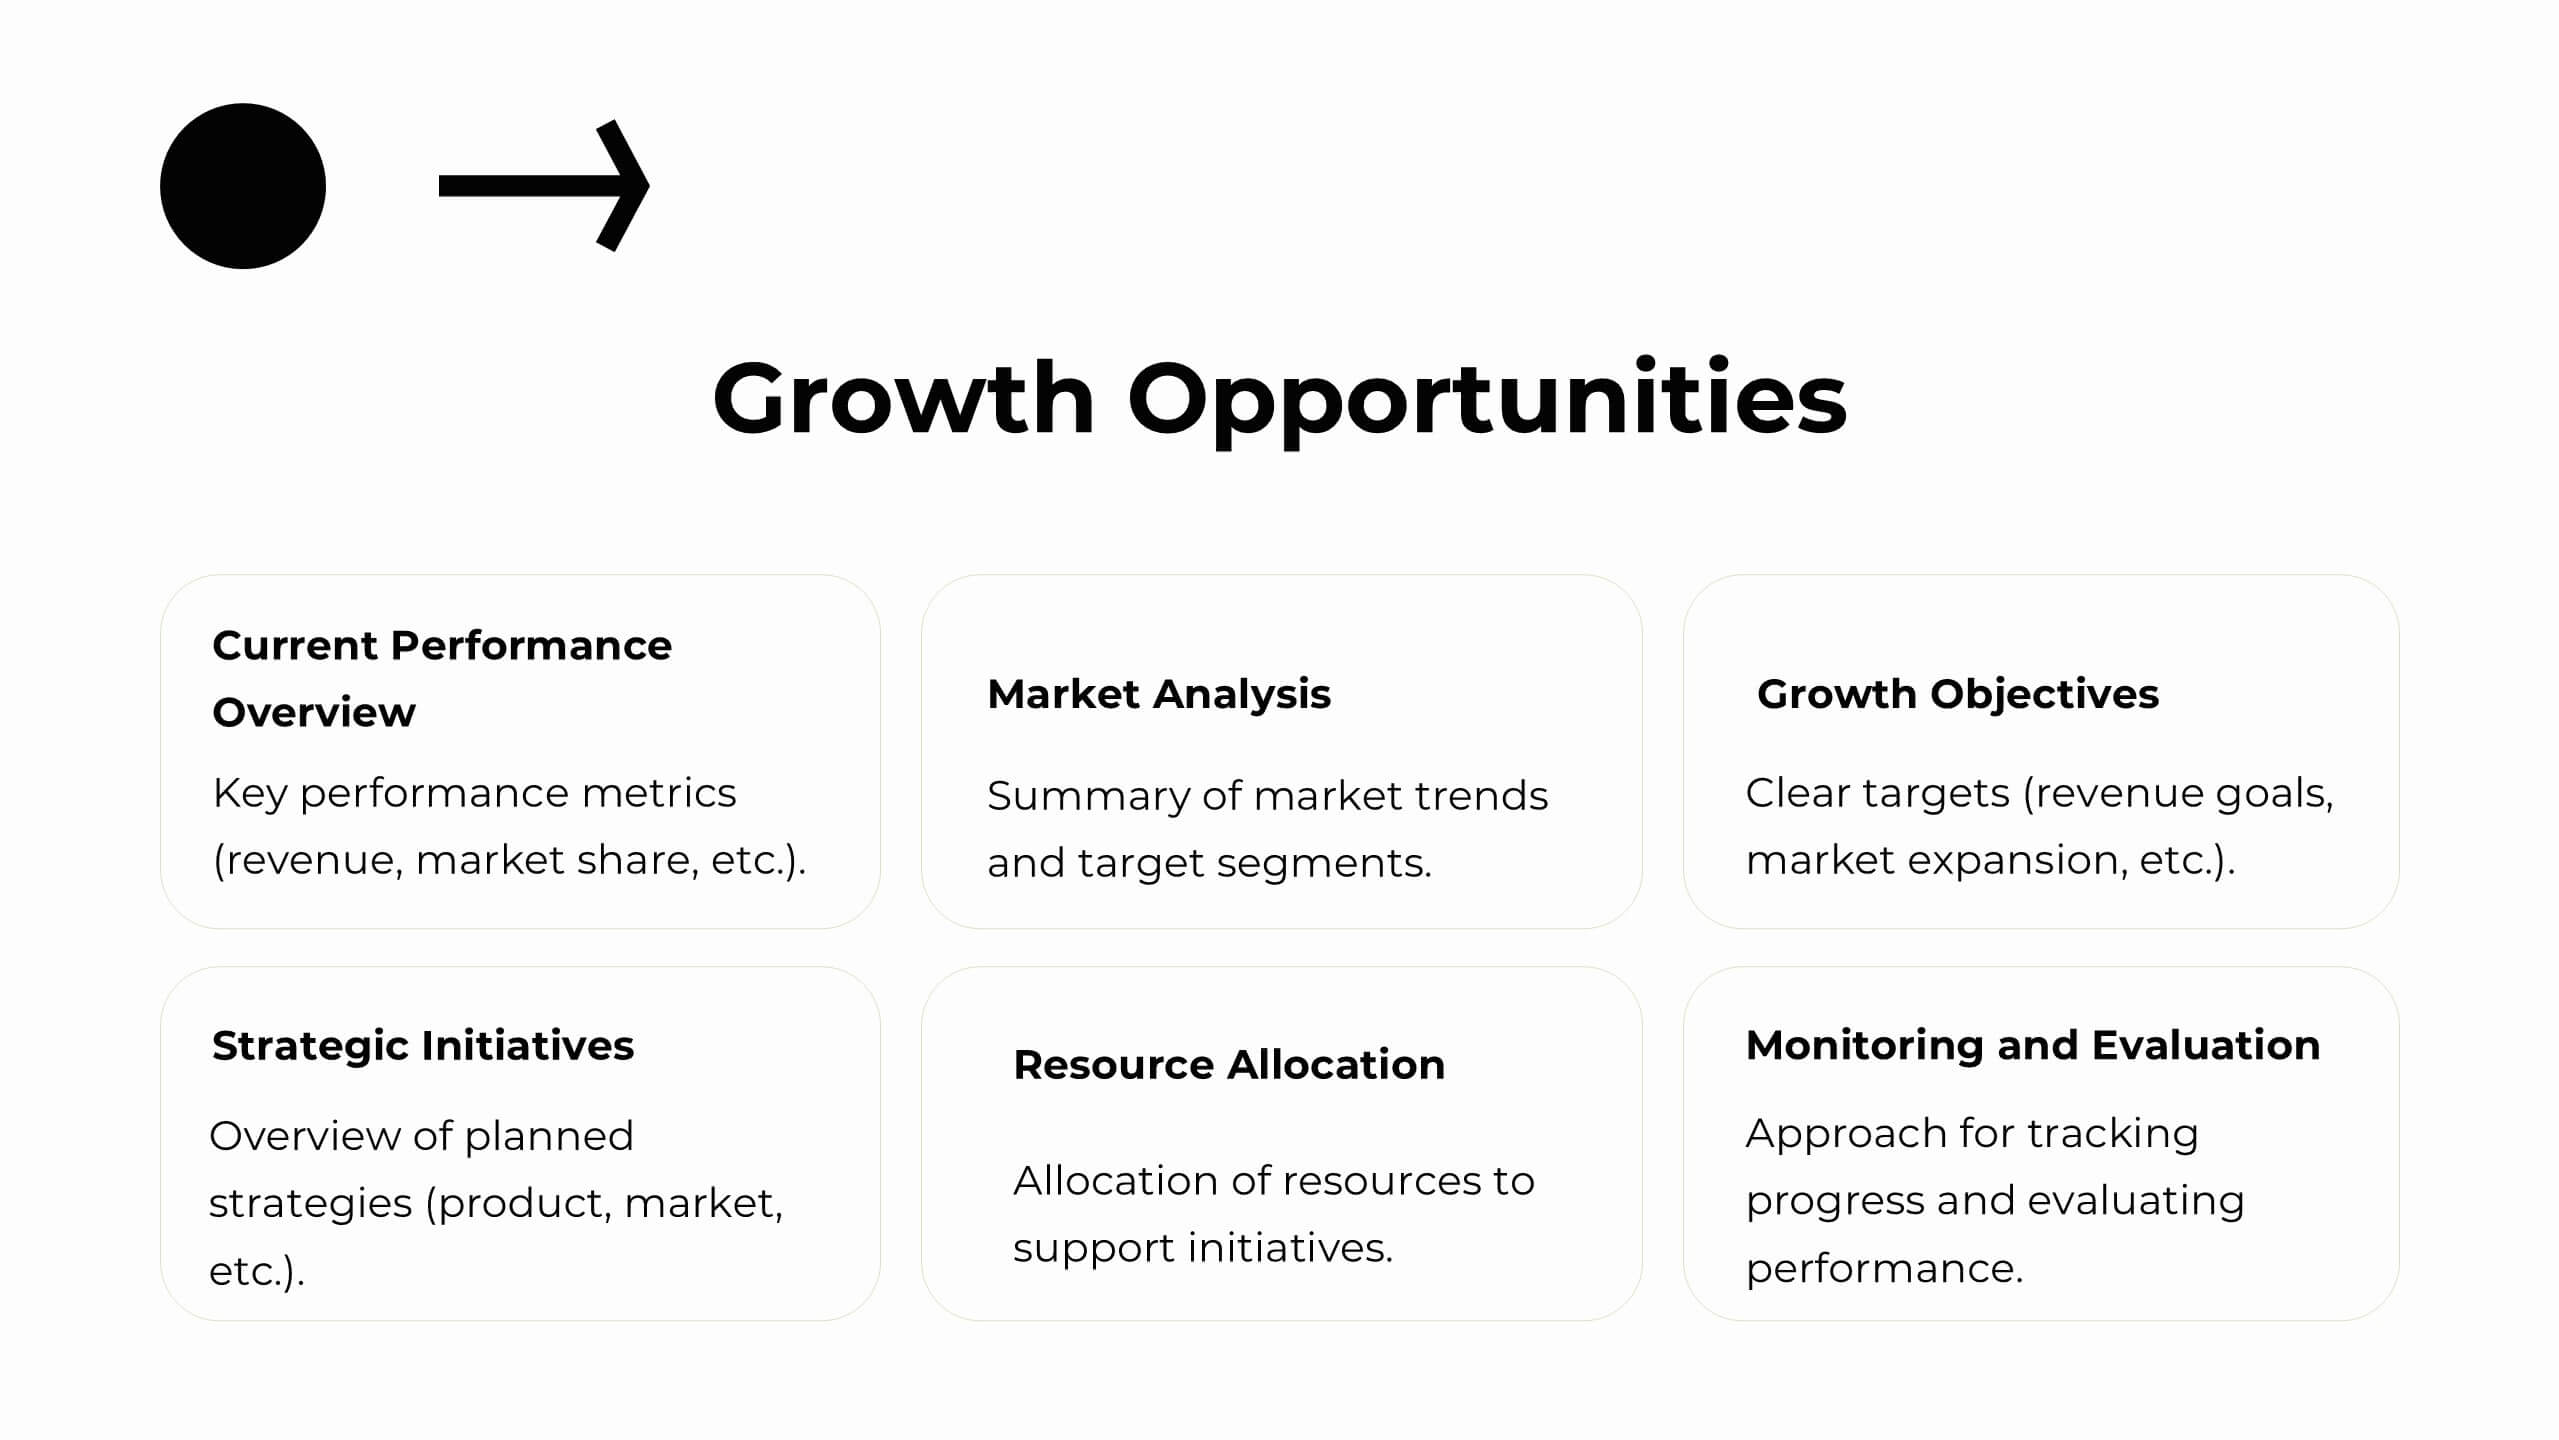
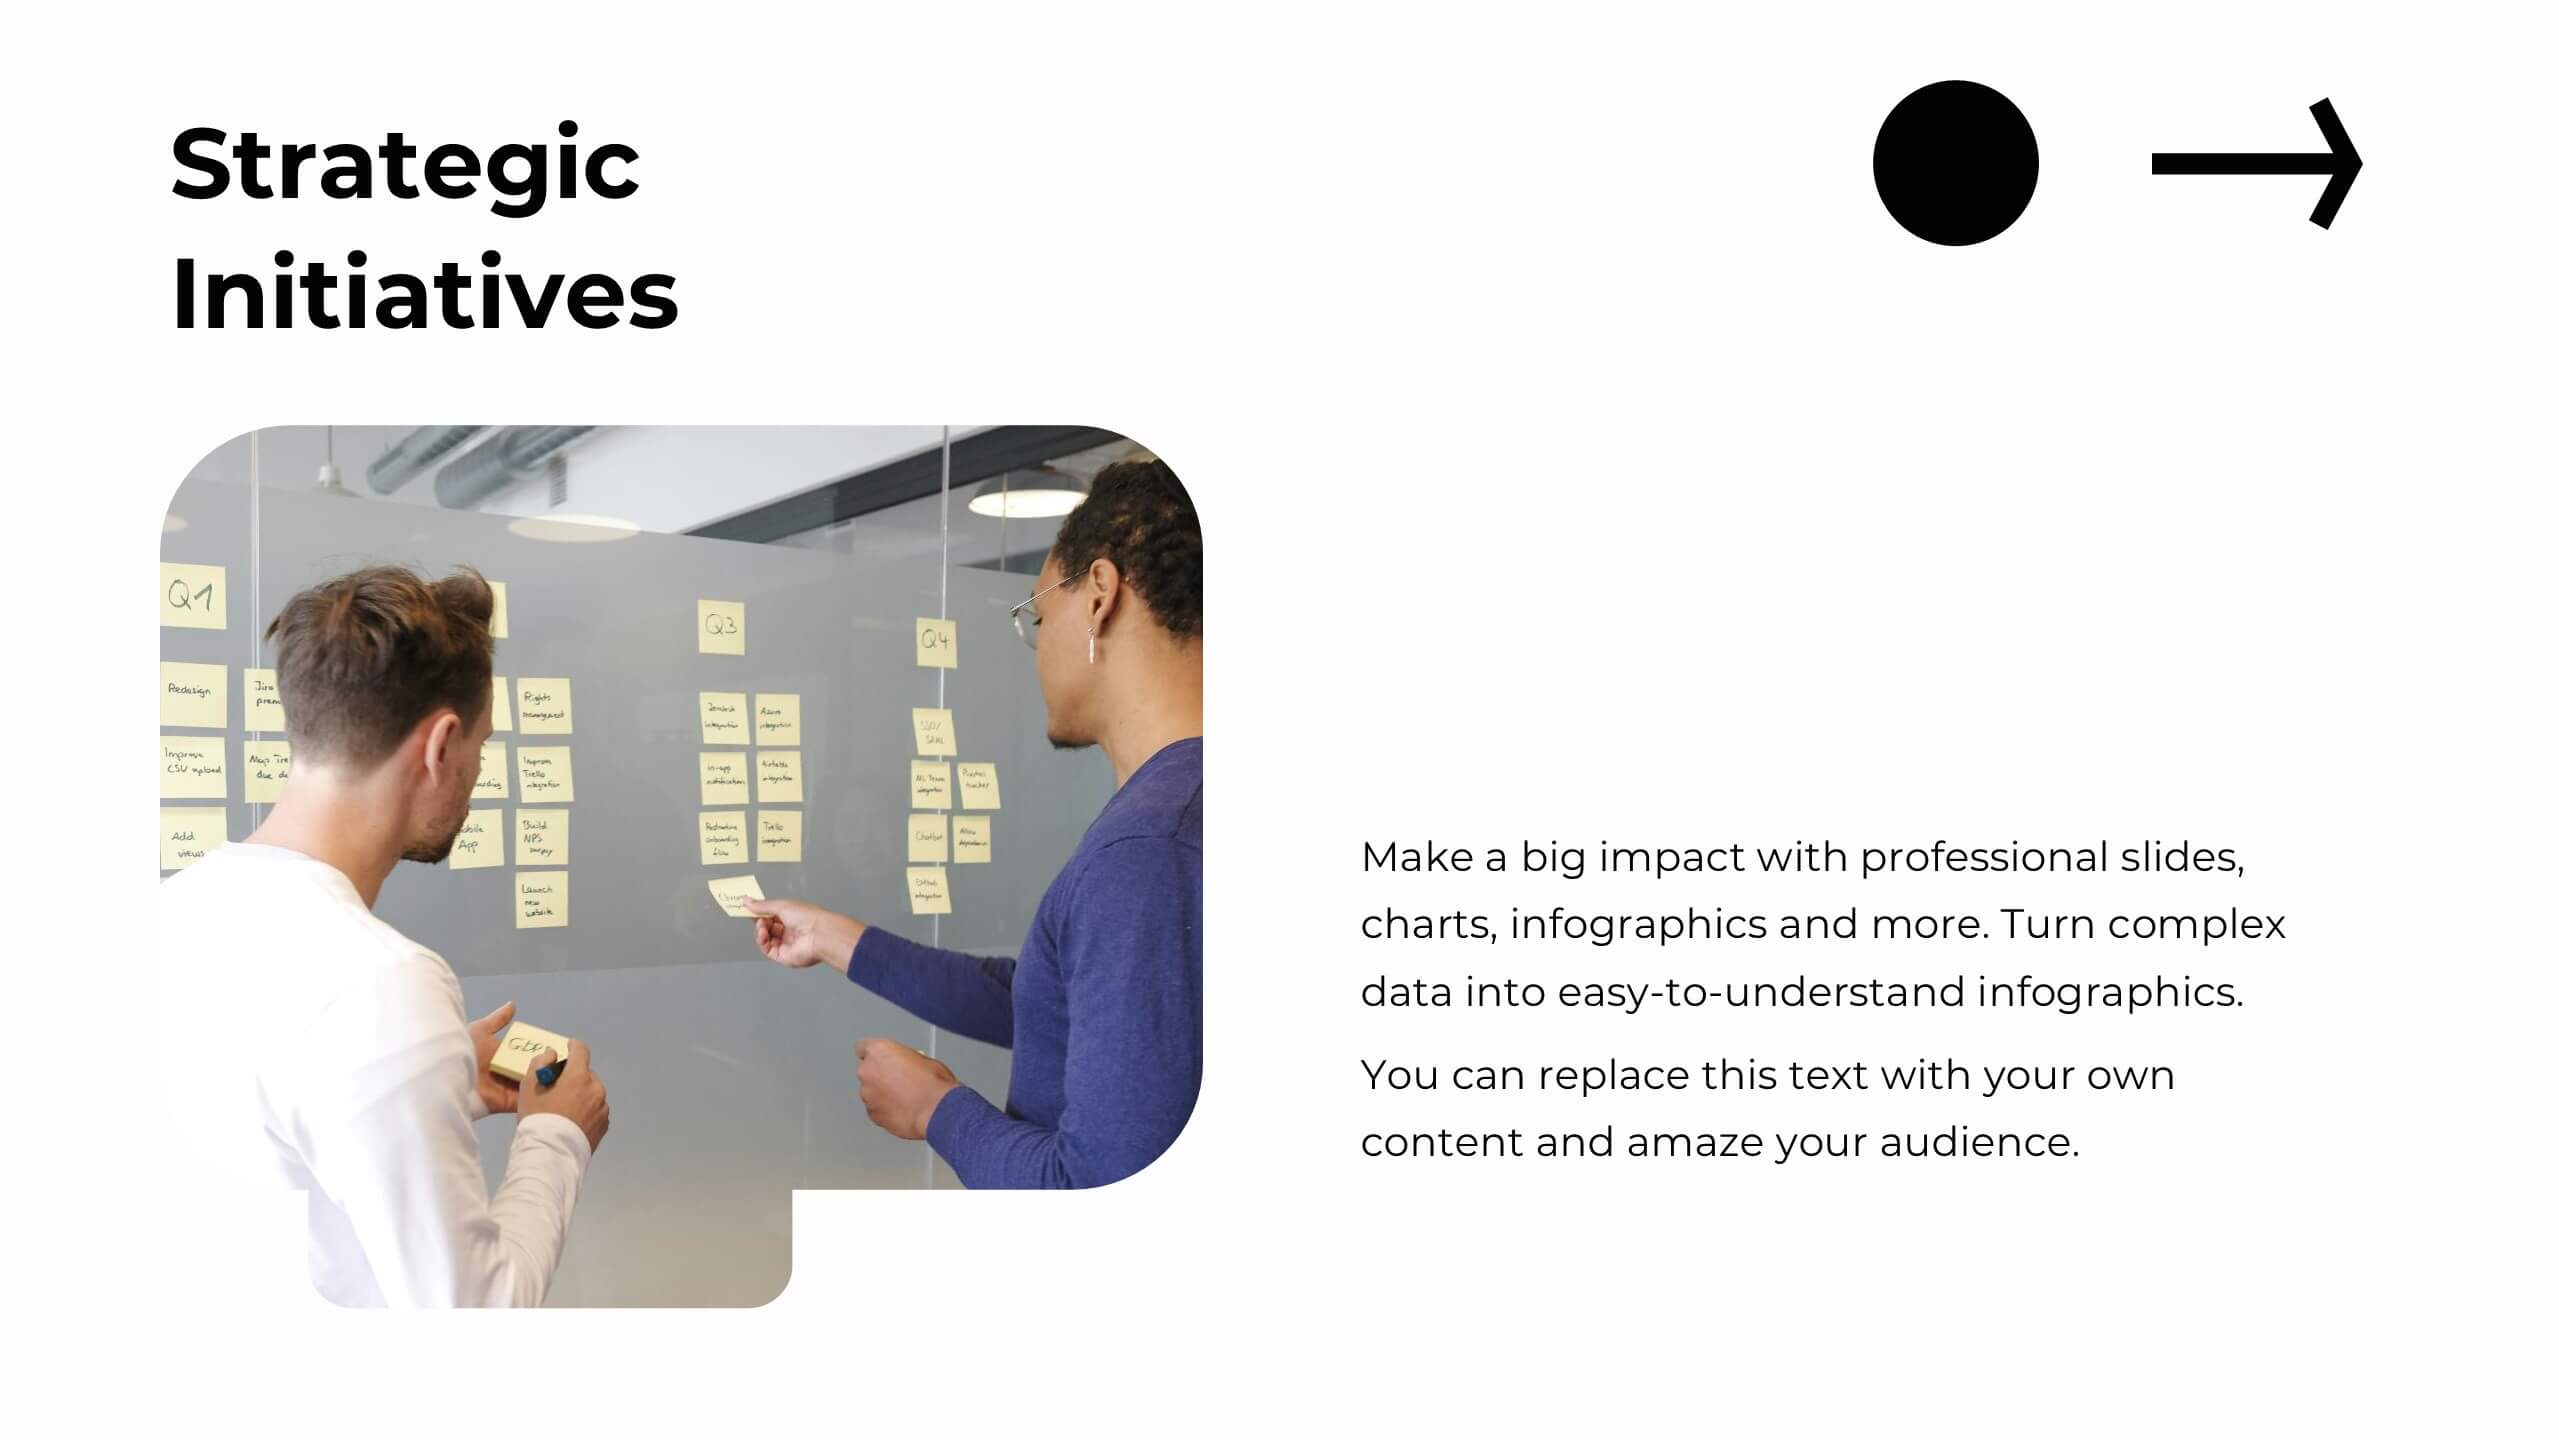
Plan and present your strategies with precision using this comprehensive strategic planning report template! Designed for clear communication of goals, market trends, SWOT analysis, and growth opportunities, it’s perfect for aligning team objectives and driving success. Fully customizable and compatible with PowerPoint, Keynote, and Google Slides, this template is ideal for strategic initiatives and performance reviews.


4 slides
Leadership and Team Challenges Presentation
Illustrate your team’s journey with this engaging visual that highlights progress, obstacles, and achievements. Featuring a dynamic leader figure ascending an arrow-shaped path, this template is ideal for showcasing leadership development, team-building stages, or challenge-resolution frameworks. Fully editable and compatible with PowerPoint, Keynote, and Google Slides.


5 slides
Global Nonprofit Help Infographics
A global nonprofit organization is a type of organization that operates on an international scale and focuses on making a positive impact on a global scale. These vertical infographics focuses on the impact and importance of nonprofit organizations worldwide. This is ideal for showcasing the achievements and goals of nonprofits in addressing various global issues, such as poverty, healthcare, and environmental conservation. The infographics include a collection of captivating icons and illustrations related to nonprofit work. These slides allow you to present compelling stories, case studies, and success stories that demonstrate the real-world impact of nonprofit work.


7 slides
Safety Training Infographic Presentation
Safety infographics present important safety information in a clear and concise way, making it easier for people to understand and follow the recommended safety practices. This safety template can be used to provided information and guidelines related to safety in different settings, such as workplaces, schools, public spaces, and homes. This infographic is designed to cover a wide range of topics and personal safety. It include various elements such as icons, illustrations, text, and color-coding. Designed in Powerpoint, Keynote and Google Slides this template is ready for you to edit.


6 slides
Project Proposal Slide Deck Presentation
Make your next pitch unforgettable with a clean, structured layout that turns complex project ideas into a clear visual story. Ideal for presenting timelines, goals, or performance metrics, it helps you communicate your proposal with confidence and precision. Fully compatible with PowerPoint, Keynote, and Google Slides for effortless editing.


5 slides
Strategic Business Case Presentation
Make every proposal stand out with a clear, goal-focused design that simplifies your strategic narrative. Ideal for presenting initiatives, project justifications, or decision-making insights, this layout balances visual clarity with professionalism. Fully compatible with PowerPoint, Keynote, and Google Slides for effortless editing and polished presentations.


6 slides
Project Timeline and Weekly Schedule Presentation
Plan smarter with the Project Timeline and Weekly Schedule Presentation—a clear, structured template for tracking tasks week by week across multiple projects. Ideal for managers, teams, or freelancers needing a bird’s-eye view of workload distribution. Fully editable for PowerPoint, Keynote, and Google Slides.


7 slides
Success Iceberg Infographic
Iceberg Infographic are visual guides to understanding the world of business. Ideal for anyone who wants to understand the basics of business, from what it is and how it works to why it matters. This template is easy to read, and can be used for everything from data visualization to teaching people how to use a new product. Give your audience a look at the most important parts of your business. The template is easy to use, and allows you to highlight your data. Fully customizable and compatible with Powerpoint, Keynote, and Google Slides. There are multiple color themes, fonts, and shapes to choose from, and endless combinations to make it truly yours.


5 slides
European Countries Editable Map Presentation
Bring your data to life with a detailed and modern map layout that showcases insights across Europe. Perfect for visualizing country comparisons, regional statistics, or business expansion plans, this clean design ensures clarity and impact. Fully compatible with PowerPoint, Keynote, and Google Slides for easy editing and presentation.


7 slides
Target Customer Profile Infographic
This Target Customer Profile infographic template is designed to help businesses clearly define and present their ideal customer segments. Available for PowerPoint, Google Slides, and Keynote, it includes various sections to detail demographics, customer needs, purchasing habits, and more. With a clean layout and a warm color scheme of oranges and blues, it facilitates the easy organization of customer information. Icons and comparison charts enable users to visualize customer motivations, goals, and product alignment efficiently. Ideal for marketers and business planners, this template simplifies the process of profiling target customers in a visually engaging and informative manner.


5 slides
Problem-Solving and Risk Navigation Presentation
Navigate uncertainty with clarity using the Problem-Solving and Risk Navigation presentation. This slide features a winding, color-coded path that visually represents each step in a complex decision-making process—from initial analysis to final action. Each of the five stages is marked with an arrow and an icon for intuitive storytelling. Ideal for strategy meetings, risk management workshops, or project reviews. Fully editable in PowerPoint, Keynote, and Google Slides.


21 slides
Turquoise Market Analysis Report Presentation
This sleek report presentation template covers essential sections like key performance metrics, market analysis, and strategic initiatives. It’s designed for a professional yet modern look, perfect for showcasing updates and insights. Compatible with PowerPoint, Keynote, and Google Slides, it’s ideal for delivering engaging and impactful business reports.


23 slides
Cycladic UX Design Presentation
The Cycladic UX Design Presentation Template is a bold and vibrant choice for showcasing your UX/UI design projects. With its striking pink and black color scheme, this template is designed to grab attention and keep your audience engaged. It covers all essential aspects of UX design, from project overviews and user research to wireframes, prototyping, and UI design principles. Each slide is thoughtfully designed to present your content clearly and effectively, making it ideal for designers who want to highlight their process, showcase their work, and communicate their design thinking.


5 slides
Creative Watercolor Style Presentation
Splash your ideas onto the page with a layout that blends artistic watercolor accents and clean, modern structure. This presentation helps you showcase insights, steps, or concepts in a visually soothing format that feels both creative and professional. Ideal for storytelling or branding discussions. Fully compatible with PowerPoint, Keynote, and Google Slides.


21 slides
Illusia Artist Portfolio Template Presentation
Make your creative work shine with this vibrant and versatile portfolio presentation template. Designed for artists, designers, and creative professionals, this template enables you to showcase your projects, philosophy, and achievements in a visually captivating way. Present your journey with slides that cover an introduction, portfolio overview, creative process, and collaborations. Highlight your unique style and philosophy while featuring key projects with dynamic layouts. Share your accolades, services offered, pricing details, and client testimonials to build trust and credibility. Fully customizable and compatible with PowerPoint, Google Slides, and Keynote, this template offers effortless editing to align with your branding and personal style. Perfect for portfolio reviews, client meetings, or showcasing your work online, this template is designed to make a bold, professional impression.


7 slides
Six Sigma Training Infographic
Six Sigma is a data-driven methodology and approach for eliminating defects and improving processes in any business. This is a bold, transformative tool designed to equip individuals and organizations with the prowess of Six Sigma methodology. This template is the roadmap to excellence, paving the way for achieving remarkable improvements and efficiency. Fully customizable and compatible with Powerpoint, Keynote, and Google Slides. Unleash the power of Six Sigma through our Six Sigma Training Infographic. Let this be your guide to mastering the art of perfection, driving transformative change, and marching boldly towards operational excellence.


20 slides
Pegasus Sales Forecast Presentation
This bold sales forecast template combines powerful visuals with a sleek design to highlight key performance metrics, competitive analysis, and pricing strategy. With sections for service overview, testimonials, promotions, and next steps, it’s ideal for impactful presentations. Compatible with PowerPoint, Keynote, and Google Slides, delivering your message has never been easier.