


Features
- 20 Unique Slides
- Fully editable and easy to edit in Microsoft Powerpoint, Keynote and Google Slides
- 16:9 widescreen layout
- Clean and professional designs
- Export to JPG, PDF or send by email


Do you have any questions?
Recommend


5 slides
Water Usage and Resource Efficiency Presentation
Convey environmental impact clearly with the Water Usage and Resource Efficiency Presentation. This clean, drop-shaped infographic design visualizes resource distribution in four balanced sections—ideal for sustainability, conservation, or utility reports. Fully editable in Canva, PowerPoint, Keynote, and Google Slides to customize data and align with your brand or project.
5 slides
Feedback Rating Smile Icons Presentation
Light up your presentation with a playful visual that turns audience feedback into clear, colorful insights. This slide helps you compare ratings, highlight sentiment patterns, and present review data in a friendly, memorable way. Perfect for surveys, reports, and performance reviews. Fully compatible with PowerPoint, Keynote, and Google Slides.


5 slides
Company Origin and Growth History Presentation
Showcase your company’s journey with the Company Origin and Growth History Presentation. This visual step diagram is ideal for illustrating key milestones, business expansion, or historical achievements. Perfect for pitch decks, annual reports, or investor updates. Fully editable in Canva, PowerPoint, Keynote, and Google Slides for seamless customization.

1 slide
Professional Presentation Cover Slide Presentation
Make a bold first impression with this sleek and modern cover slide designed to introduce your presentation with confidence. Its clean layout and striking geometric shapes create a polished look while giving viewers a clear sense of professionalism. Perfect for business, marketing, or project presentations, and fully compatible with PowerPoint, Keynote, and Google Slides.


4 slides
Customer Persona Slide Presentation
Bring your audience closer to your ideal customer with this clean, visual layout designed for clarity and storytelling. Perfect for marketing, branding, and strategy presentations, it helps you highlight key traits, motivations, and insights with ease. Fully compatible with PowerPoint, Keynote, and Google Slides for effortless customization.


4 slides
Business Information Security Compliance Presentation
Ensure your systems meet security standards with the Business Information Security Compliance presentation slide. Designed with a central cloud and laptop graphic surrounded by icons representing data, user access, encryption, and compliance checks, this layout is perfect for illustrating IT governance, risk management, and data protection protocols. Fully customizable in PowerPoint, Keynote, and Google Slides.


6 slides
End-to-End Value Chain Process Presentation
Visualize every link in your process with the End-to-End Value Chain Process Presentation. This modern chain diagram helps illustrate each stage of your business or production flow—from initial input to final output. It's ideal for strategy, supply chain, and operational planning. Fully editable in PowerPoint, Keynote, Canva, or Google Slides.


21 slides
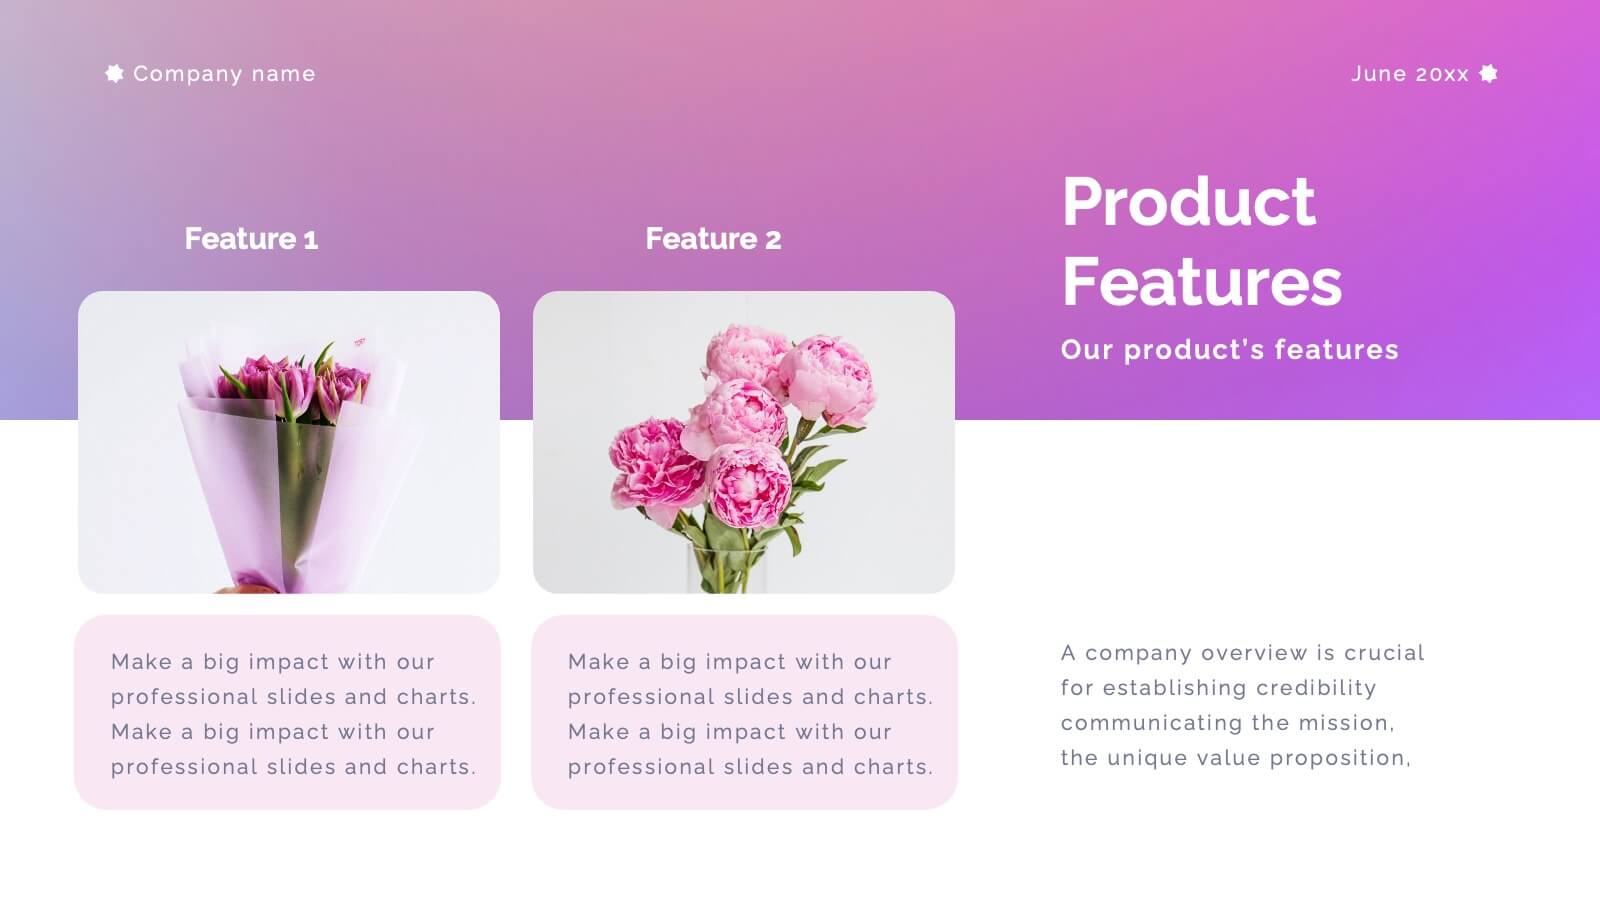
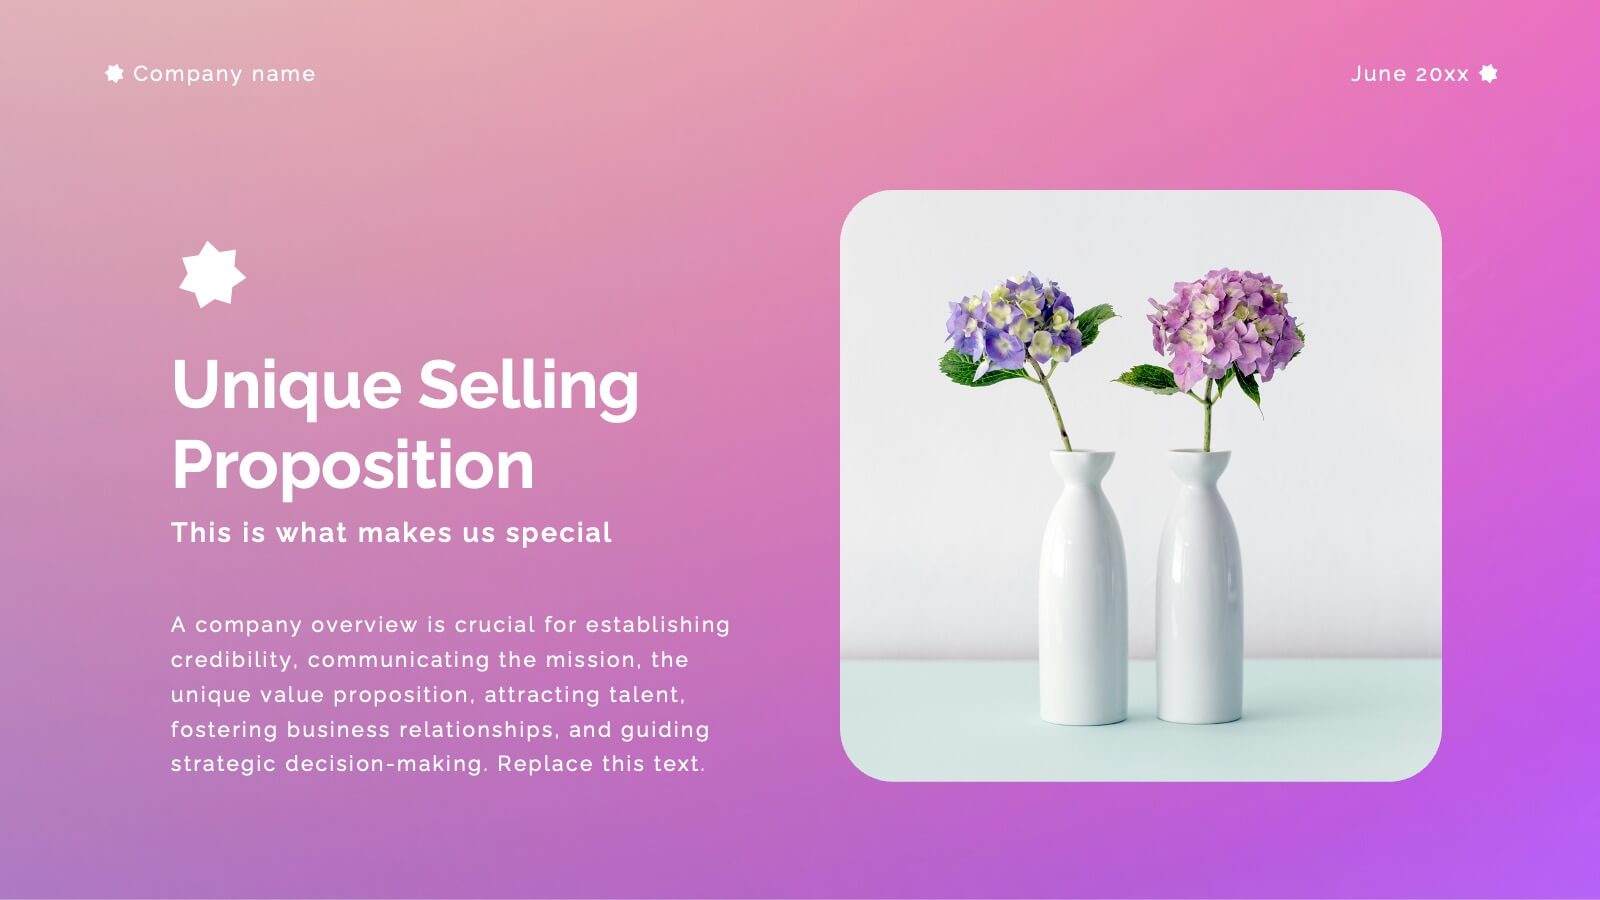
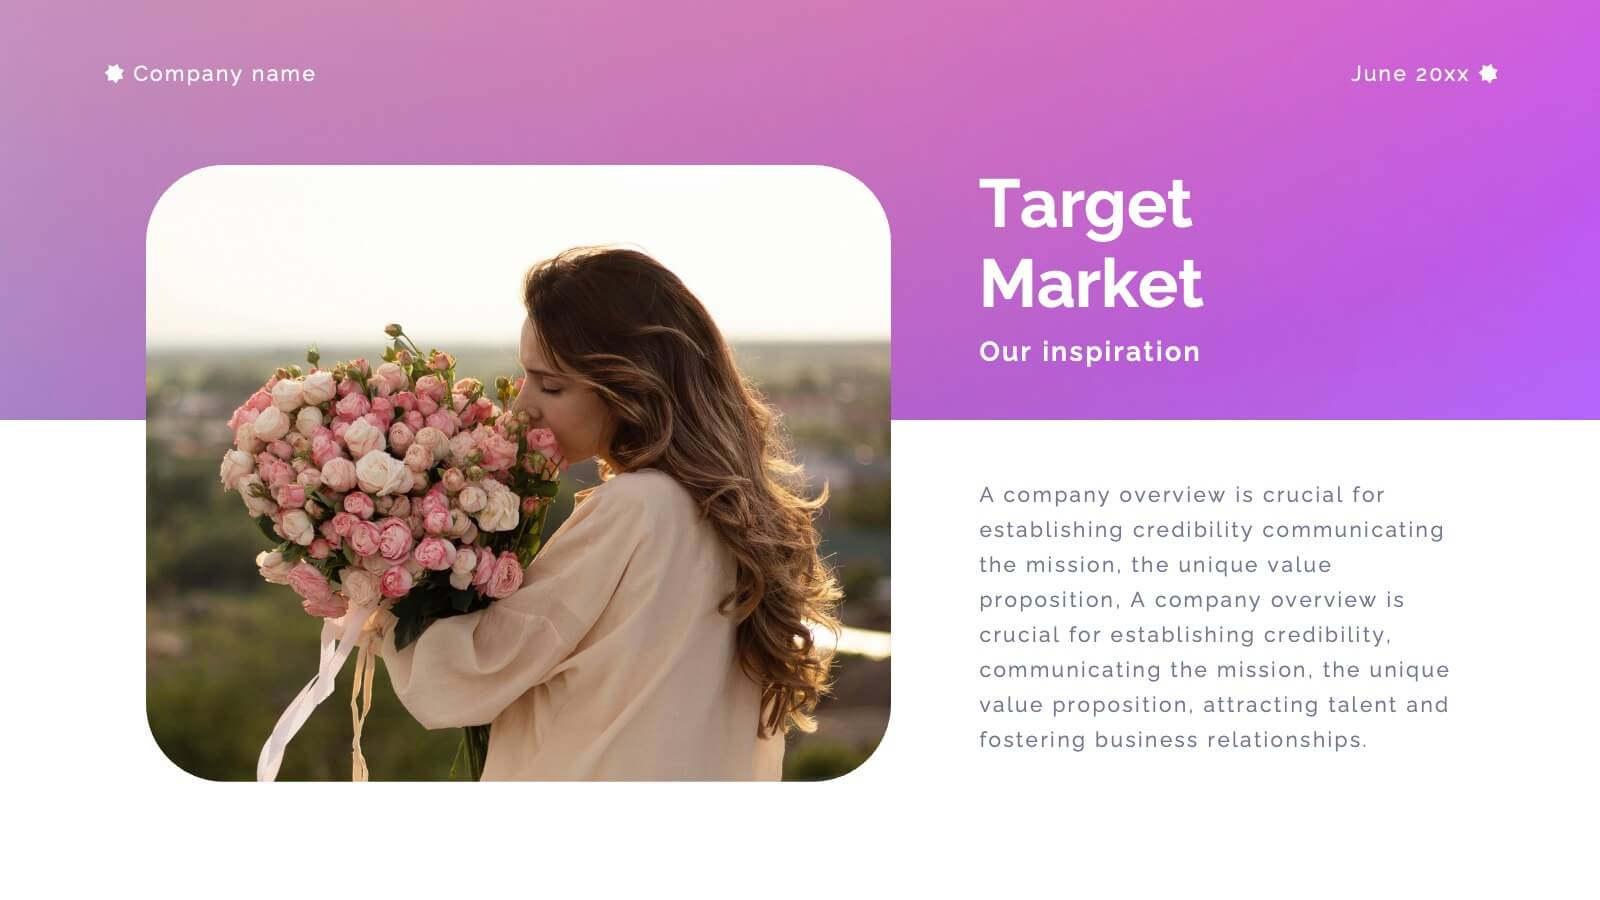
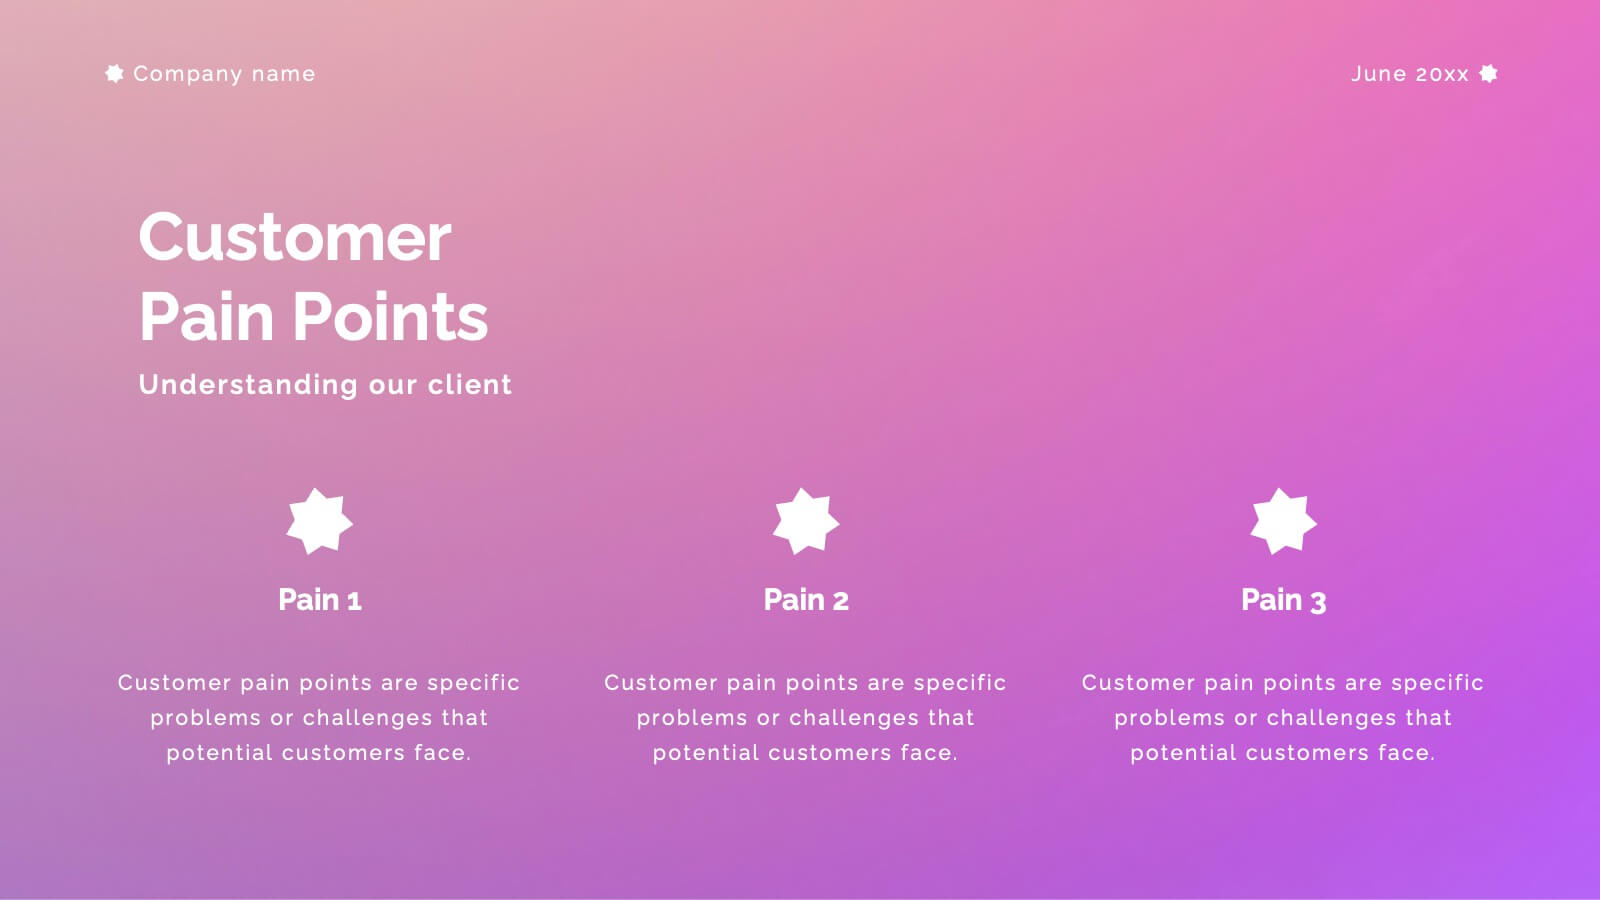
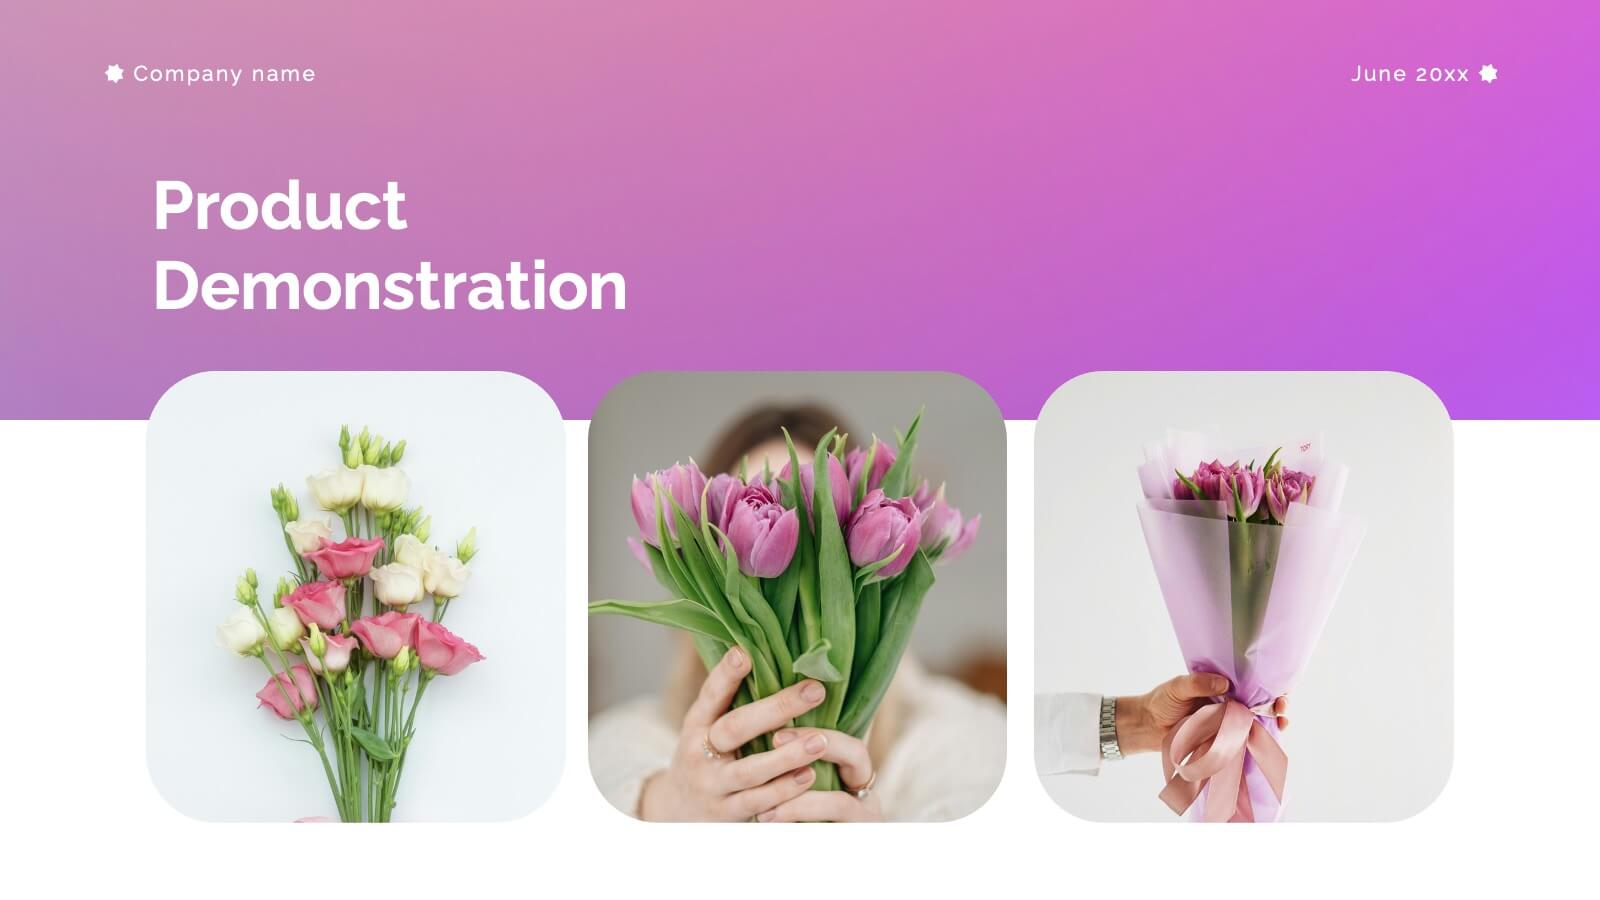
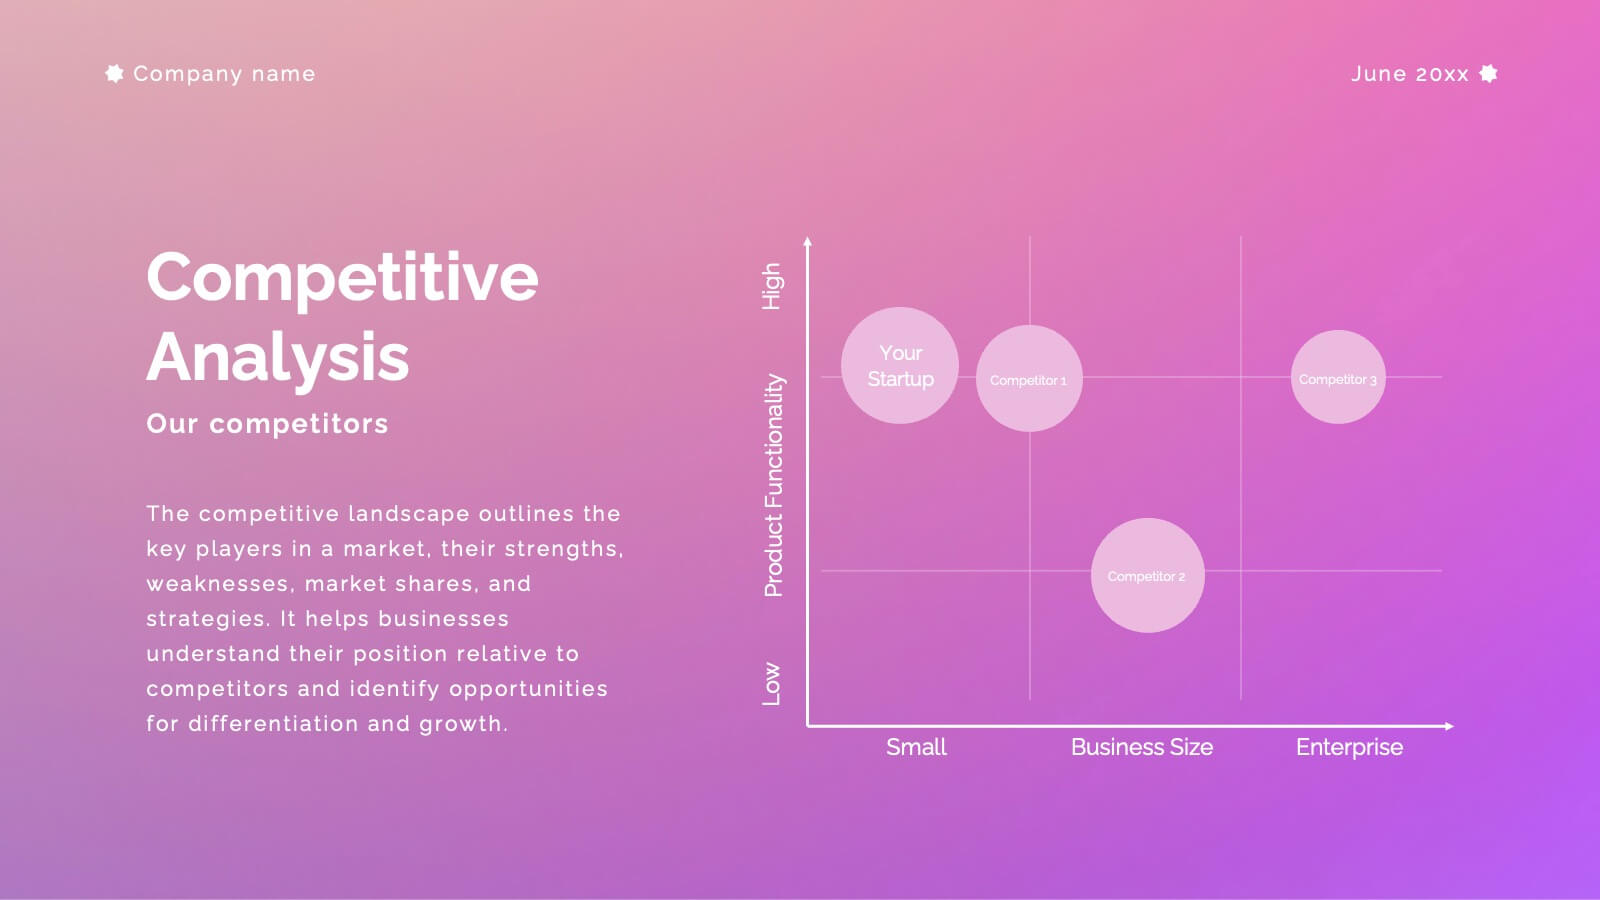
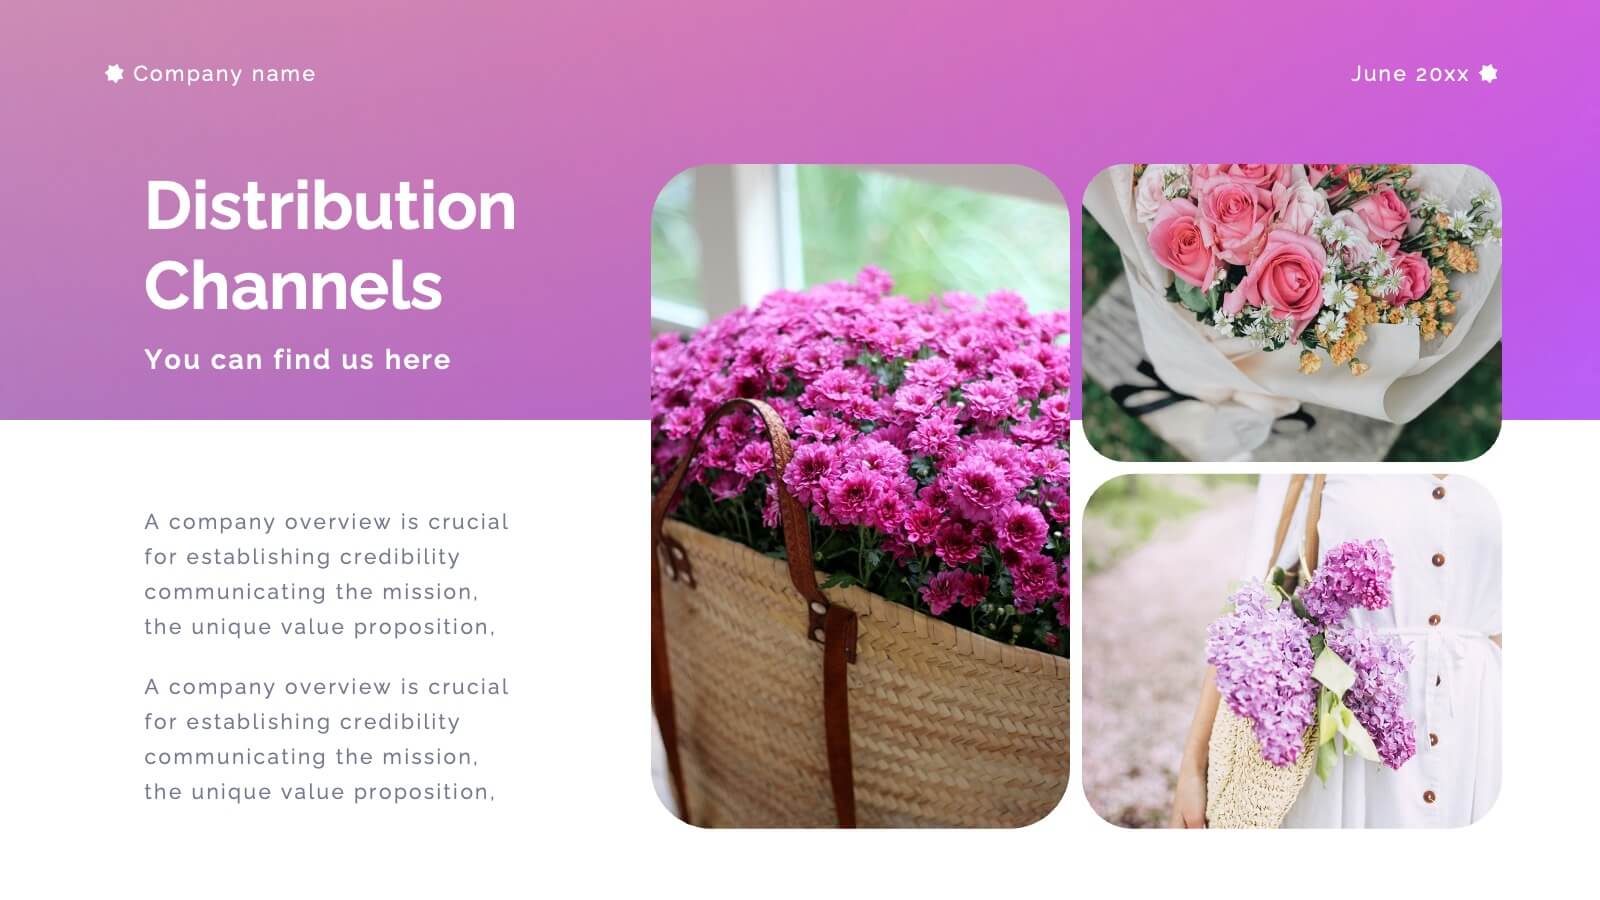
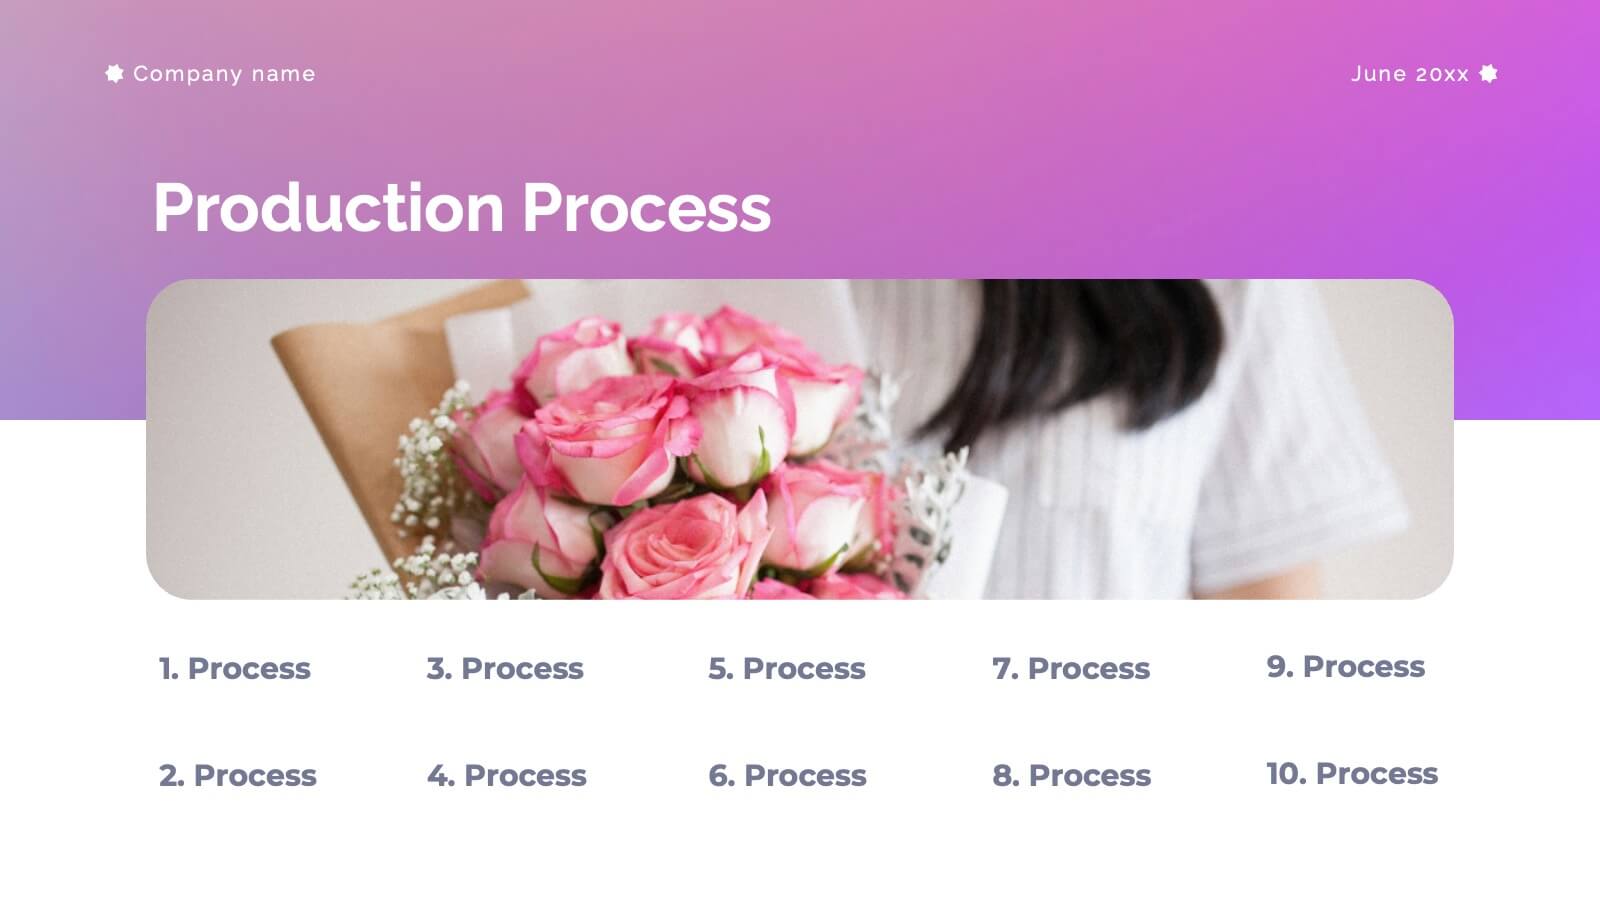
Aventurine New Product Proposal Presentation
Showcase your product in style with this vibrant and modern product proposal template! It covers everything from product features to target market, pricing strategy, and marketing plans. Designed for clarity and impact, it's perfect for pitching your product. Fully customizable, and compatible with PowerPoint, Keynote, and Google Slides for seamless presentations.


6 slides
Strategic PESTEL Presentation
Kickstart smarter strategy sessions with a clean, colorful layout that makes external factor analysis feel effortless. This presentation helps teams map trends, identify risks, and understand the broader environment shaping business decisions. Clear visuals keep insights organized and actionable. Fully compatible with PowerPoint, Keynote, and Google Slides.


23 slides
Echo Startup Pitch Deck Template Presentation
This sleek pitch deck template is perfect for showcasing your startup’s potential. Highlight your problem, solutions, revenue model, and unique value proposition in a professional format. It's fully customizable, easy to use, and compatible with PowerPoint, Keynote, and Google Slides, making it ideal for impressing investors.


2 slides
Minimalist Cover Page Design Presentation
A clean, modern visual instantly sets the tone, giving your audience a polished start before your message even begins. This presentation introduces your content with a bold, minimalist layout that feels intentional and professional. Perfect for business, creative, or academic use. Fully compatible with PowerPoint, Keynote, and Google Slides.


24 slides
Minerva UX Design Presentation
Elevate your UX design presentations with this comprehensive template, featuring sections for project overview, user research, wireframes, prototyping, and usability testing. Showcase design systems, branding guidelines, and accessibility considerations with ease. Perfect for demonstrating a user-centered approach. Compatible with PowerPoint, Keynote, and Google Slides for seamless customization.


26 slides
Economic Market Analysis Simple Presentation
Delve into the dynamics of the marketplace with this professionally crafted economic market analysis presentation template. Designed for clarity and impact, it features a compelling blend of bold color blocks and fluid shapes, encapsulating the movement and rhythm of economic trends. The slides are tailored for versatility, from in-depth data visualizations like charts and graphs to conceptual diagrams and strategic layouts. High-resolution imagery of financial symbols reinforces the analytical theme, while the structured design makes complex information accessible and engaging. Whether presenting to stakeholders or students, the template promises to convey the intricacies of market forces with precision and authority. Offering seamless functionality across PowerPoint, Keynote, and Google Slides, it’s the perfect tool for anyone looking to articulate economic concepts with both confidence and sophistication. It's not just a presentation; it's a conversation starter, setting the stage for informed decision-making and insightful discussions.


5 slides
AI Trends and Innovations Presentation
The "AI Trends and Innovations" presentation template is elegantly designed to help you convey the latest advancements and trends in artificial intelligence. Each slide focuses on different key points such as machine learning, neural networks, robotics, and data analytics, represented by interconnected icons that visually map the flow of information and ideas. This layout is perfect for professionals seeking to illustrate complex AI concepts in a digestible format, making it ideal for educational presentations, tech conferences, or internal company meetings focused on technological growth and innovation.


5 slides
Target Market and Audience Segmentation Presentation
Identify and engage your ideal audience with the Target Market and Audience Segmentation presentation. This clear, timeline-style infographic uses a bullseye layout to highlight key market segments and their progression. Ideal for marketing strategies, customer profiling, and campaign planning. Fully customizable in Canva, PowerPoint, and Google Slides.


14 slides
Business Innovation and Idea Development Presentation
Drive Business Innovation and Idea Development with this dynamic and structured template, perfect for illustrating creative processes, strategic growth, and idea execution. Designed with a lightbulb-themed layout, this presentation helps break down complex concepts into clear, engaging sections. Fully customizable and compatible with PowerPoint, Keynote, and Google Slides, making it an essential tool for entrepreneurs, teams, and business leaders looking to present ideas with impact.


29 slides
Shadowglow Brand Guidelines Proposal Presentation
Present a cohesive brand vision with this professional template, designed for crafting detailed and visually compelling brand guidelines. Highlight essential components like brand vision and mission, brand values, and identity elements, including color palettes, typography, and imagery. This template seamlessly incorporates customer personas, tone and voice guidelines, and brand touchpoints to define the essence of your brand's communication. Utilize slides for website, social media, and packaging strategies to establish consistency across all platforms. Customizable and compatible with PowerPoint, Google Slides, and Keynote, this design ensures clarity and professionalism, making it ideal for agencies or teams presenting comprehensive brand proposals.