


Features
- 4 Unique slides
- Fully editable and easy to edit in Microsoft Powerpoint, Keynote and Google Slides
- 16:9 widescreen layout
- Clean and professional designs
- Export to JPG, PDF or send by email


Do you have any questions?
Recommend


8 slides
Quarterly Sales Report Presentation
Streamline your quarterly sales review with our "Quarterly Sales Report Presentation" template. This infographic is expertly designed to display sales data across various categories, using a series of shopping cart icons that represent different products or services. Each cart is labeled with a title and associated with a percentage, clearly illustrating sales performance metrics. The color-coded elements help distinguish between different data points, making complex information easily digestible. Ideal for sales managers and teams, this template aids in analyzing trends, identifying growth opportunities, and planning future sales strategies. Compatible with PowerPoint, Keynote, and Google Slides, it's a vital tool for effective sales presentations.


12 slides
Investment and Financial Portfolio Analysis Presentation
Visualize your data with confidence using this Investment and Financial Portfolio Analysis Presentation. Designed to help finance professionals showcase quarterly performance, allocated budgets, total selling ratios, and project earnings in one powerful slide. With customizable charts including bar graphs, pyramids, and pie charts, you can present complex numbers in a clean and compelling way. Fully editable in PowerPoint, Keynote, and Google Slides.


20 slides
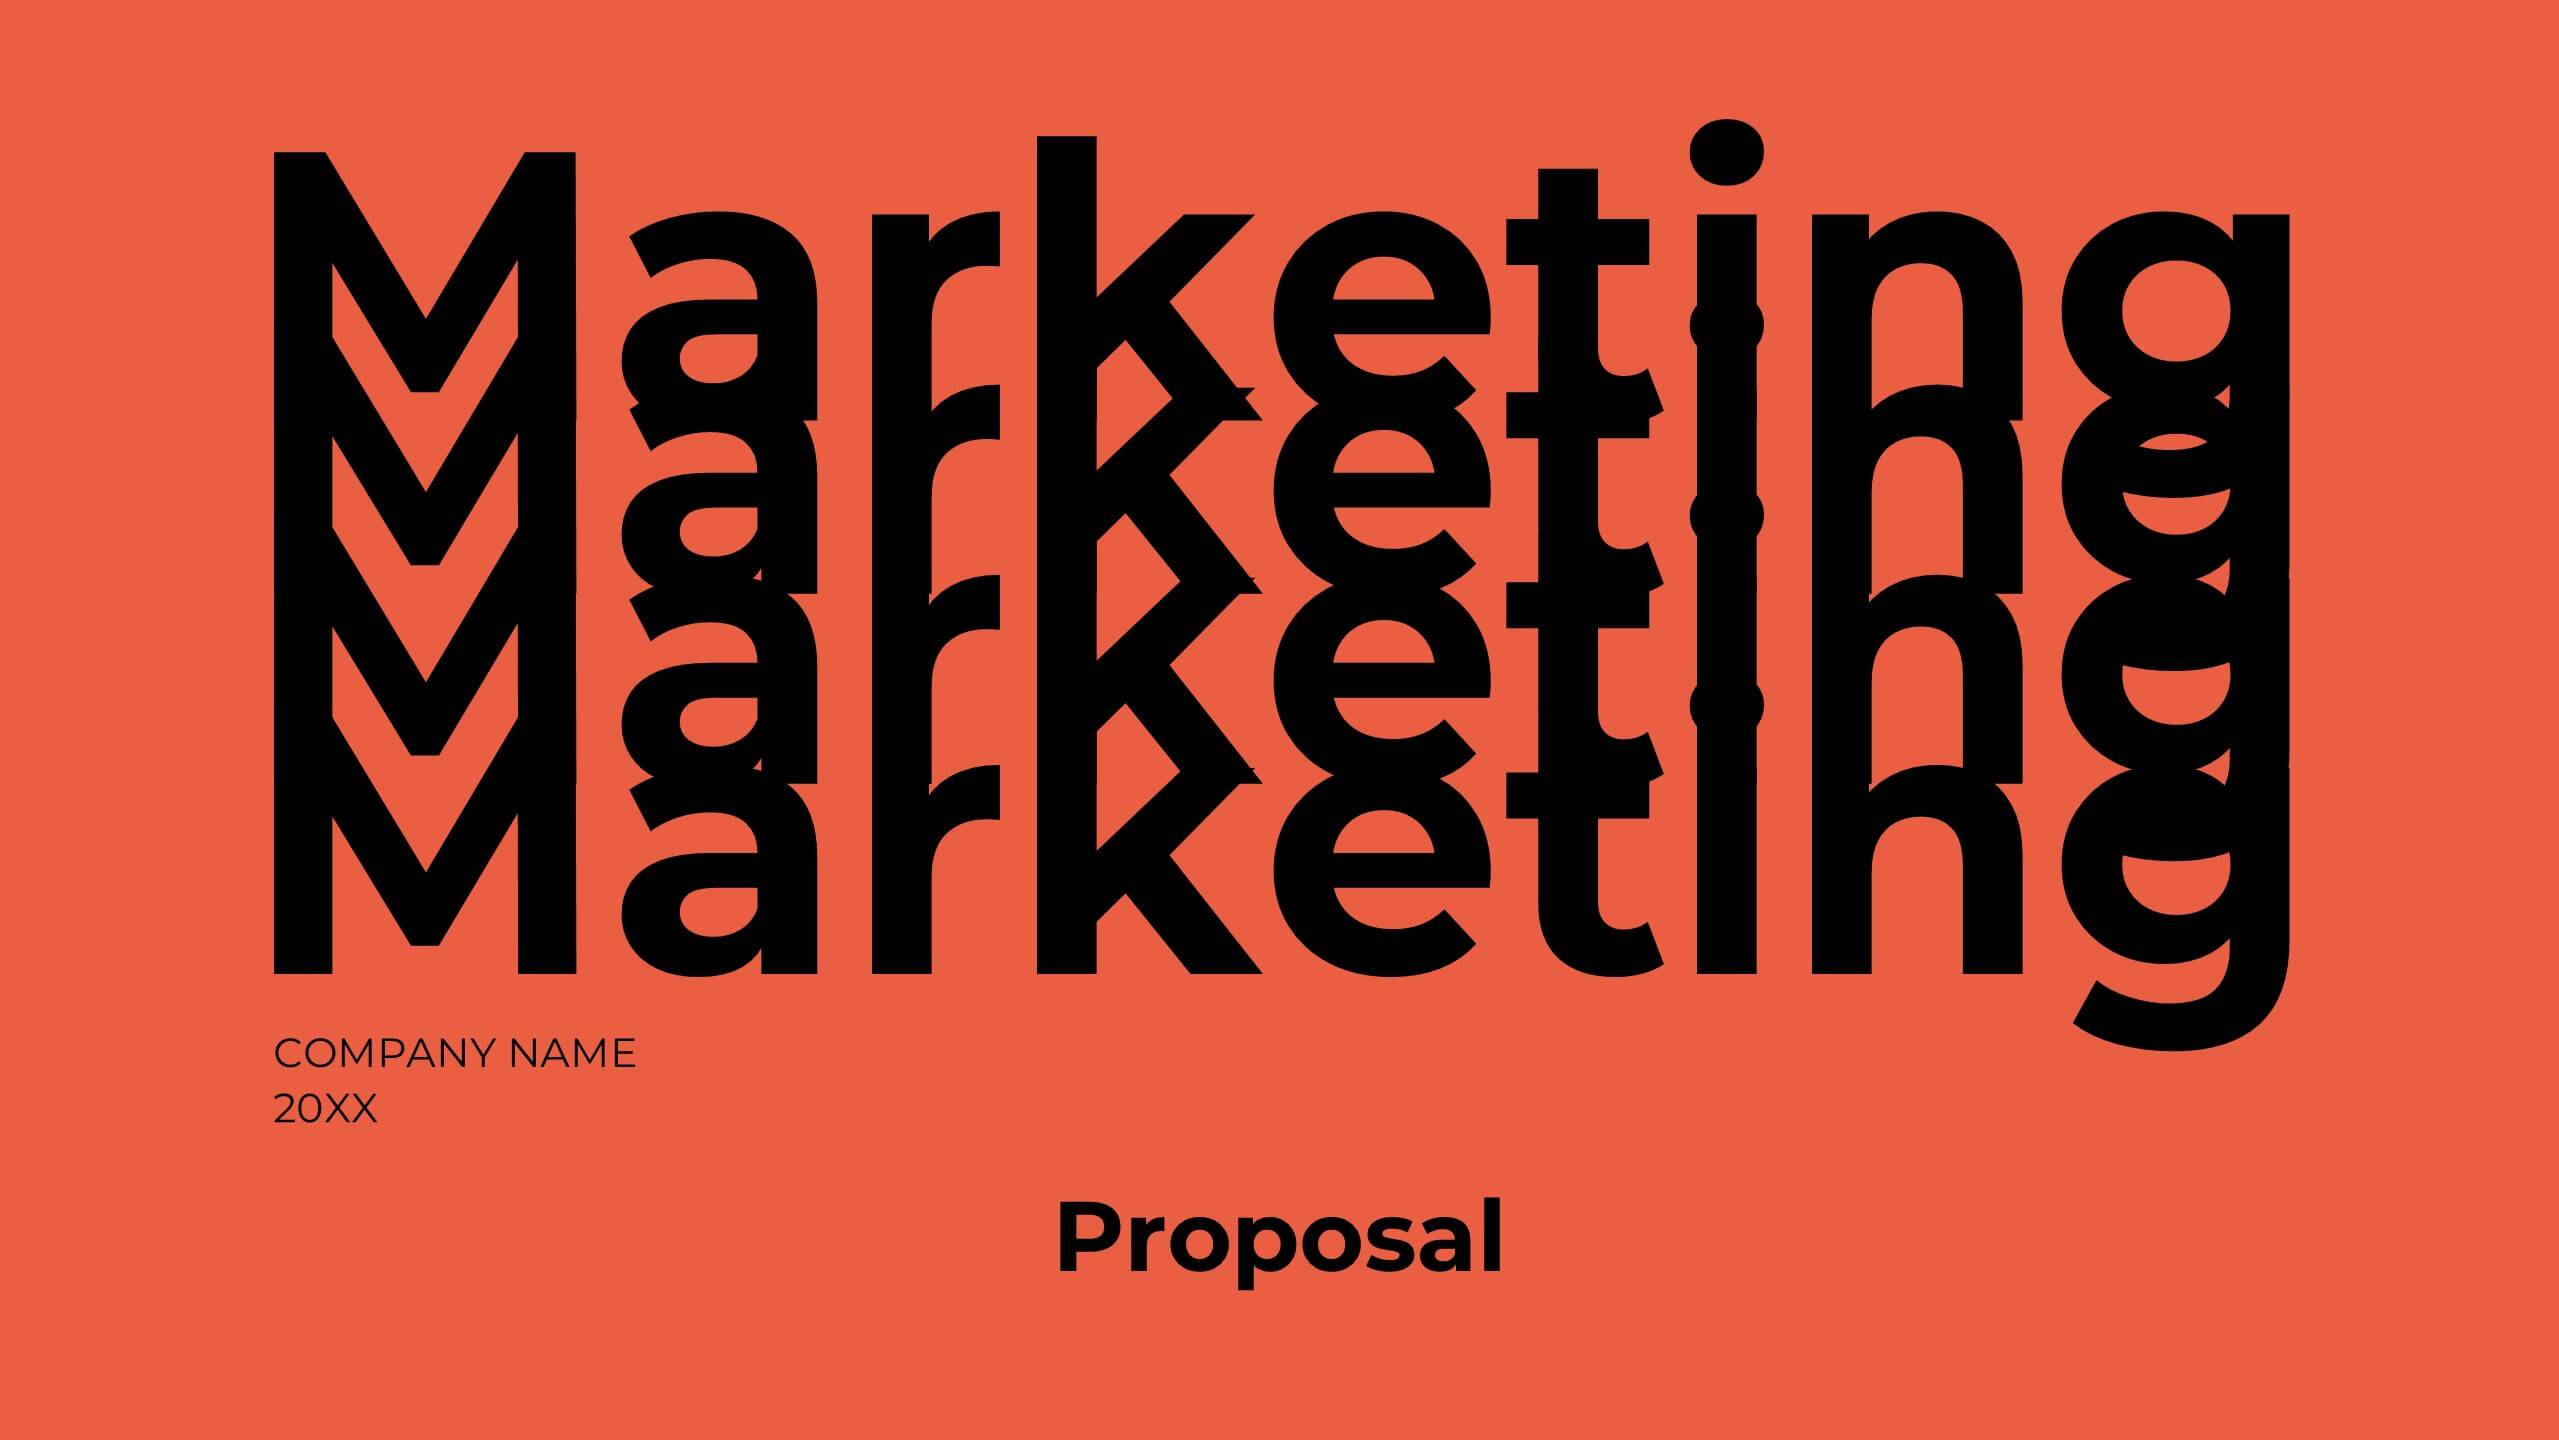
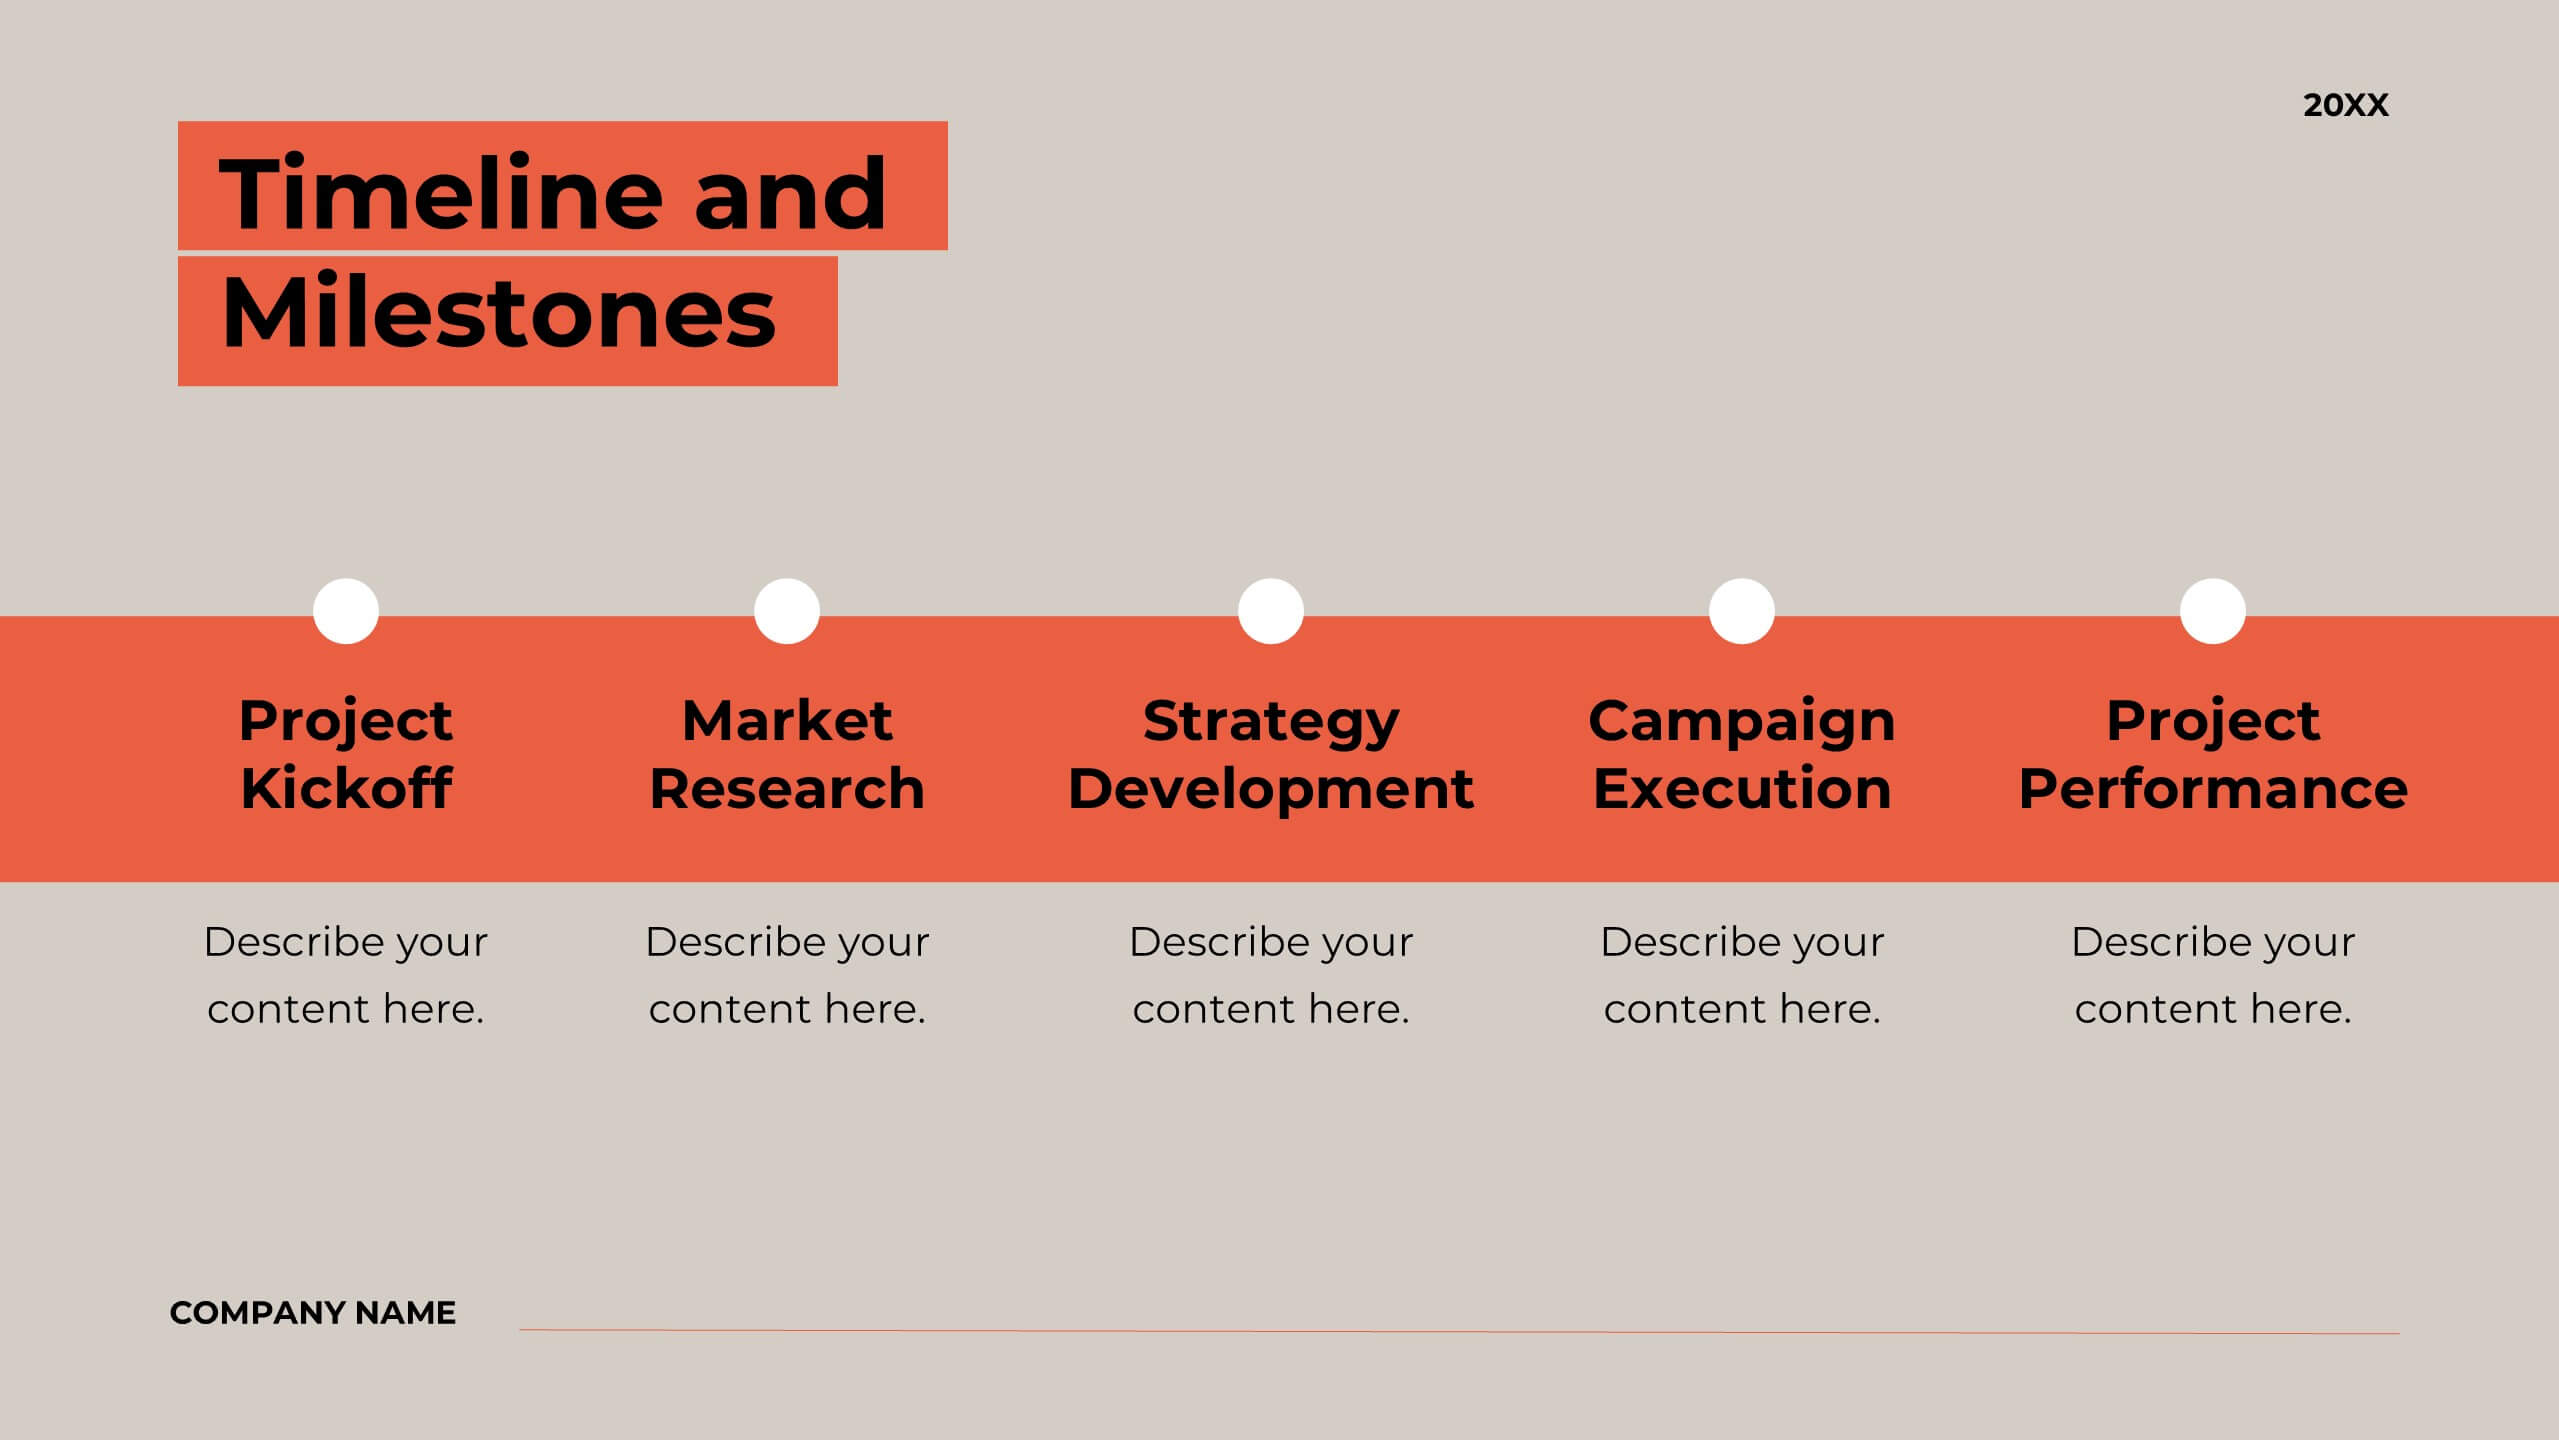
Feronia Marketing Proposal Presentation
Present your marketing strategy with this visually engaging proposal deck, featuring sections on objectives, methodology, budget breakdown, and client testimonials. Ideal for structured presentations, it’s compatible with PowerPoint, Keynote, and Google Slides, offering a flexible format to captivate and convince clients or stakeholders.


3 slides
First 90 Days Action Strategy Plan Presentation
Get ready to crush your first 90 days with a strategy layout that actually makes sense. This template helps you outline clear goals, actions, and milestones to hit during your critical first quarter—perfect for managers or new hires. Fully customizable and compatible with PowerPoint, Keynote, and Google Slides for easy editing.


6 slides
Professional Business Plan Presentation
Make every idea count with a clean, professional presentation that helps you communicate your business strategy clearly and confidently. Ideal for showcasing goals, market insights, and performance plans, it delivers structure with style. Fully compatible with PowerPoint, Keynote, and Google Slides for easy customization and seamless presentation design.


6 slides
5-Step Investment Planning Presentation
Guide your audience through a clear, structured journey with a modern layout that turns each financial step into a simple, visual milestone. This presentation helps you explain goals, outline processes, and communicate actionable insights with ease and clarity. Fully editable and compatible with PowerPoint, Keynote, and Google Slides.


10 slides
Home Office Scenes and Teamwork Presentation
Capture the modern remote work environment with this clean and visual layout. Featuring an illustrated home office scene on one side and four color-coded percentage blocks with text on the other, this template is ideal for presenting team productivity metrics, remote collaboration stats, or flexible work insights. Fully customizable in PowerPoint, Keynote, and Google Slides to match your brand.


4 slides
Break-Even Point Financial Analysis Presentation
Clearly define profitability with this break-even point financial analysis template. It visually maps costs, revenue, and profitability, helping businesses assess when they'll cover expenses and start making a profit. Perfect for financial forecasting and business planning. Fully customizable and compatible with PowerPoint, Keynote, and Google Slides for seamless editing and presentation.


20 slides
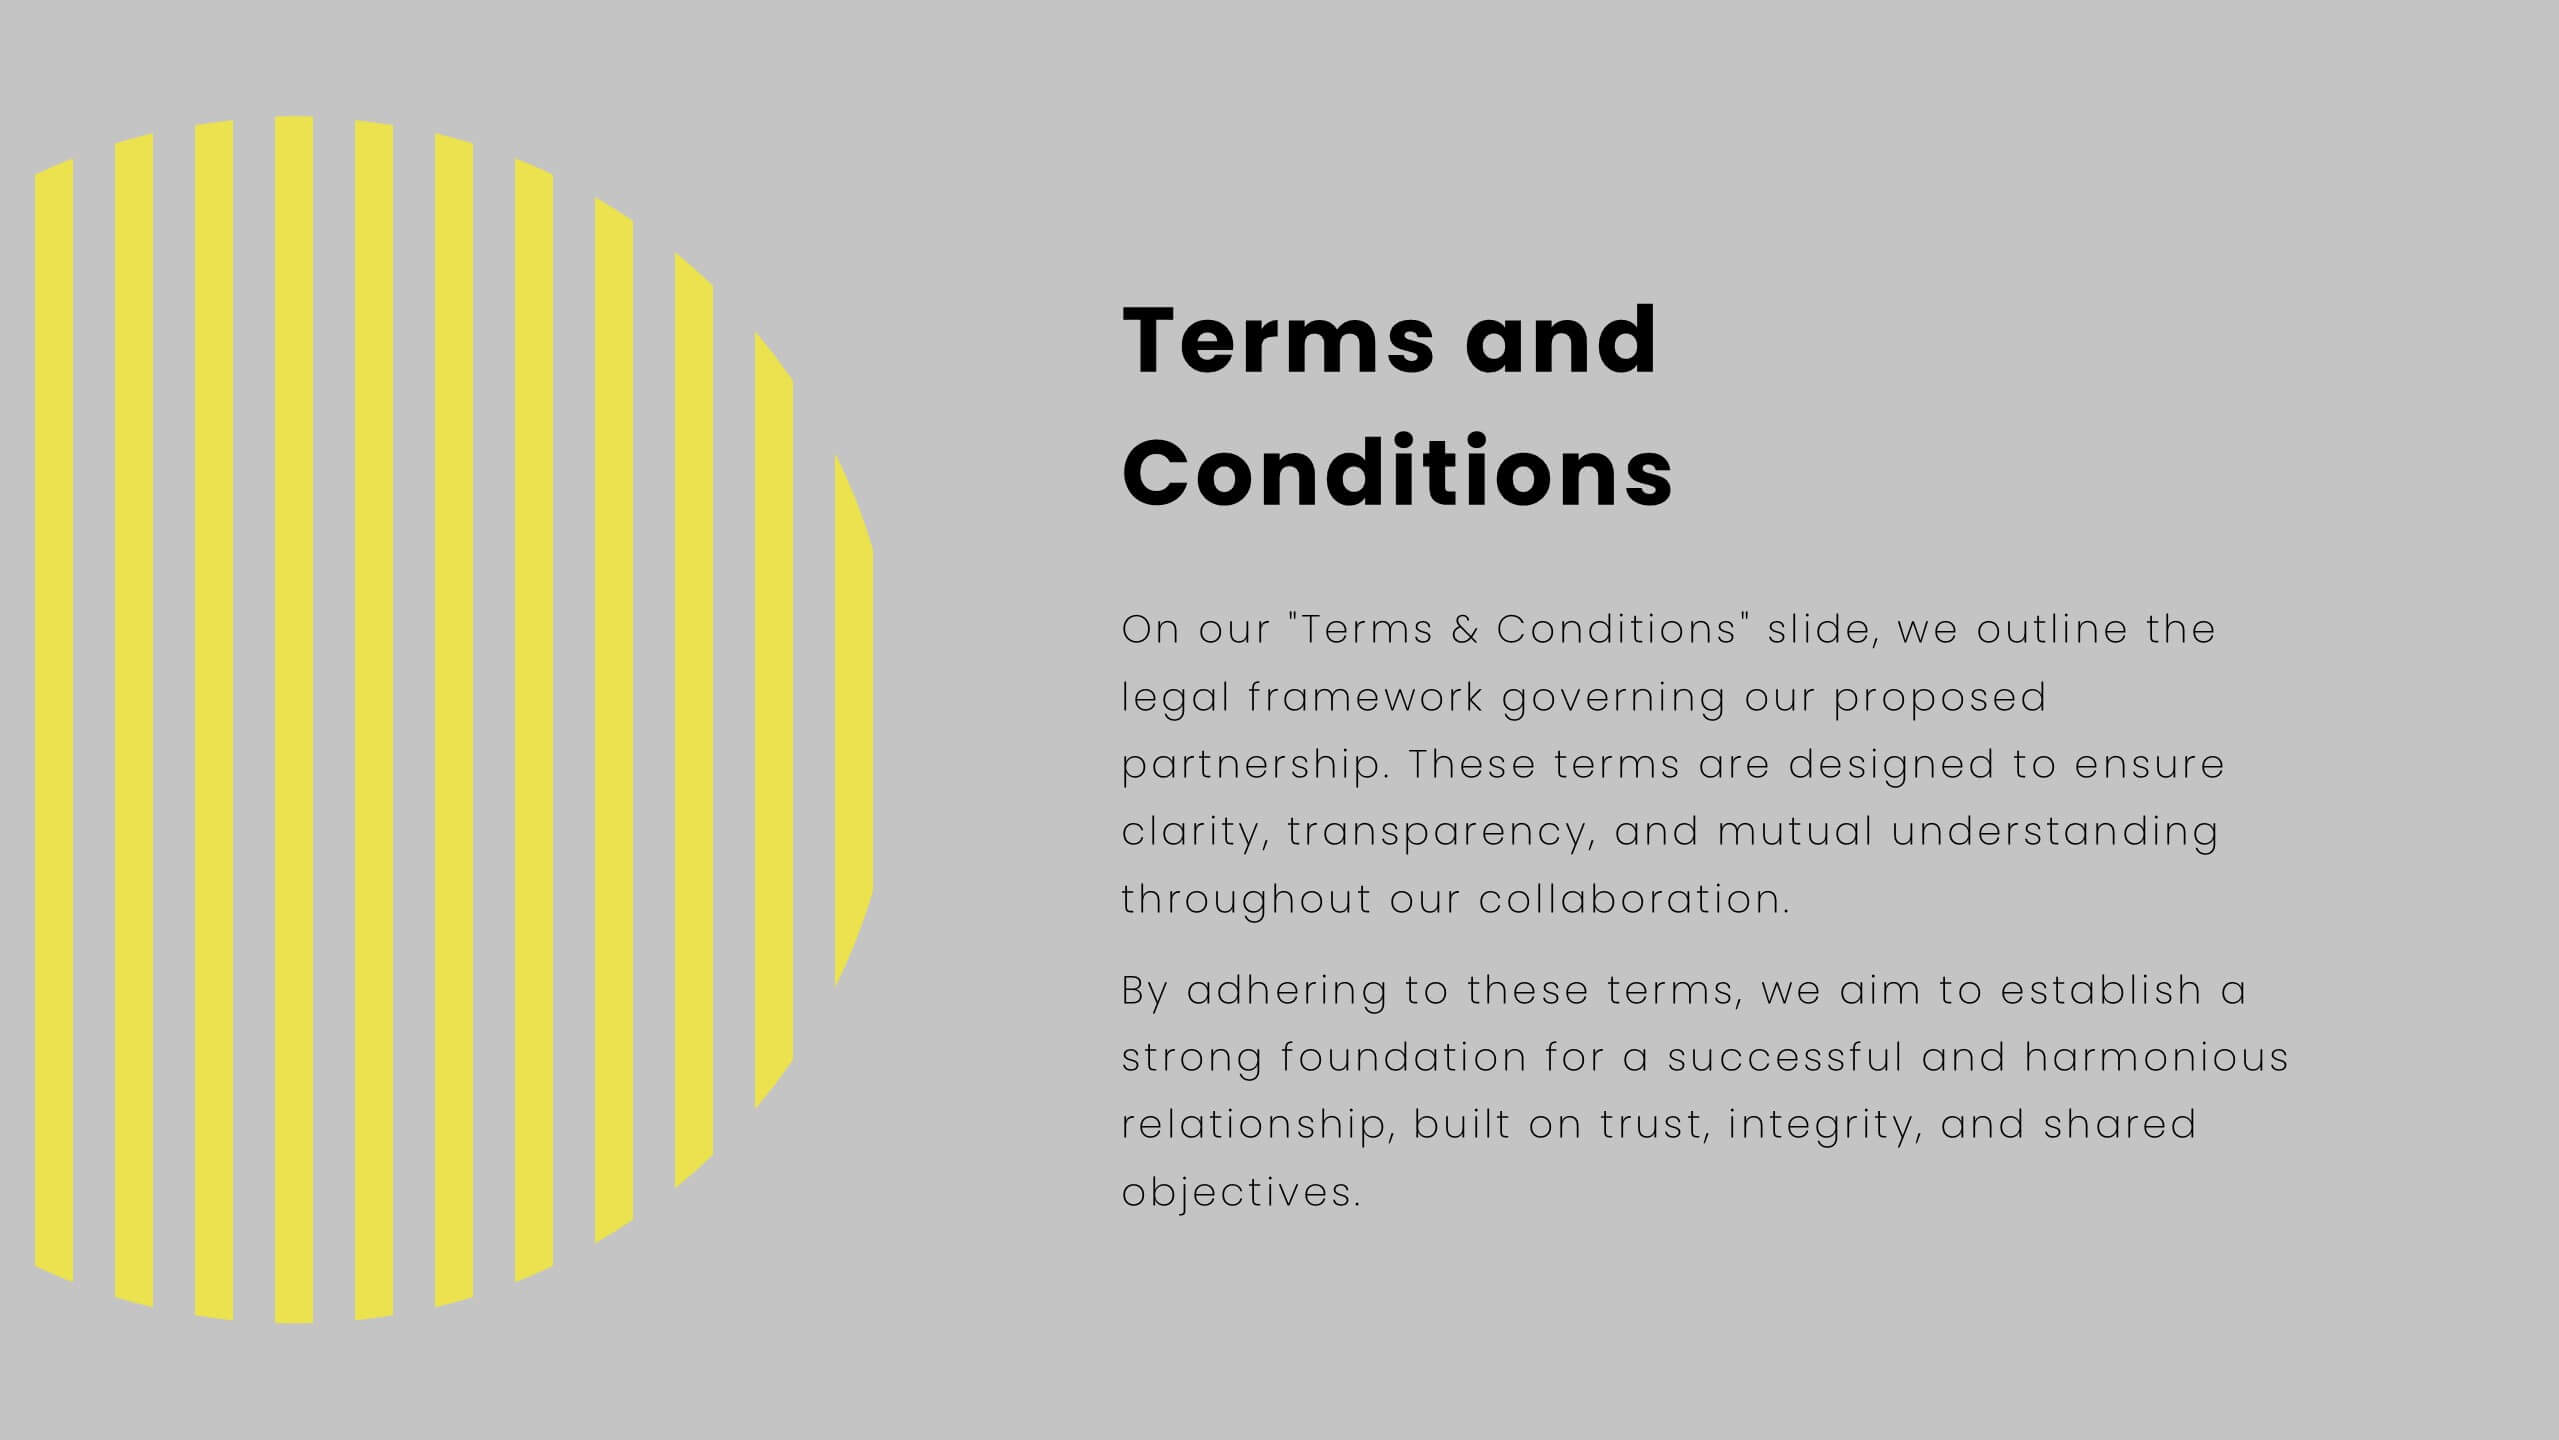
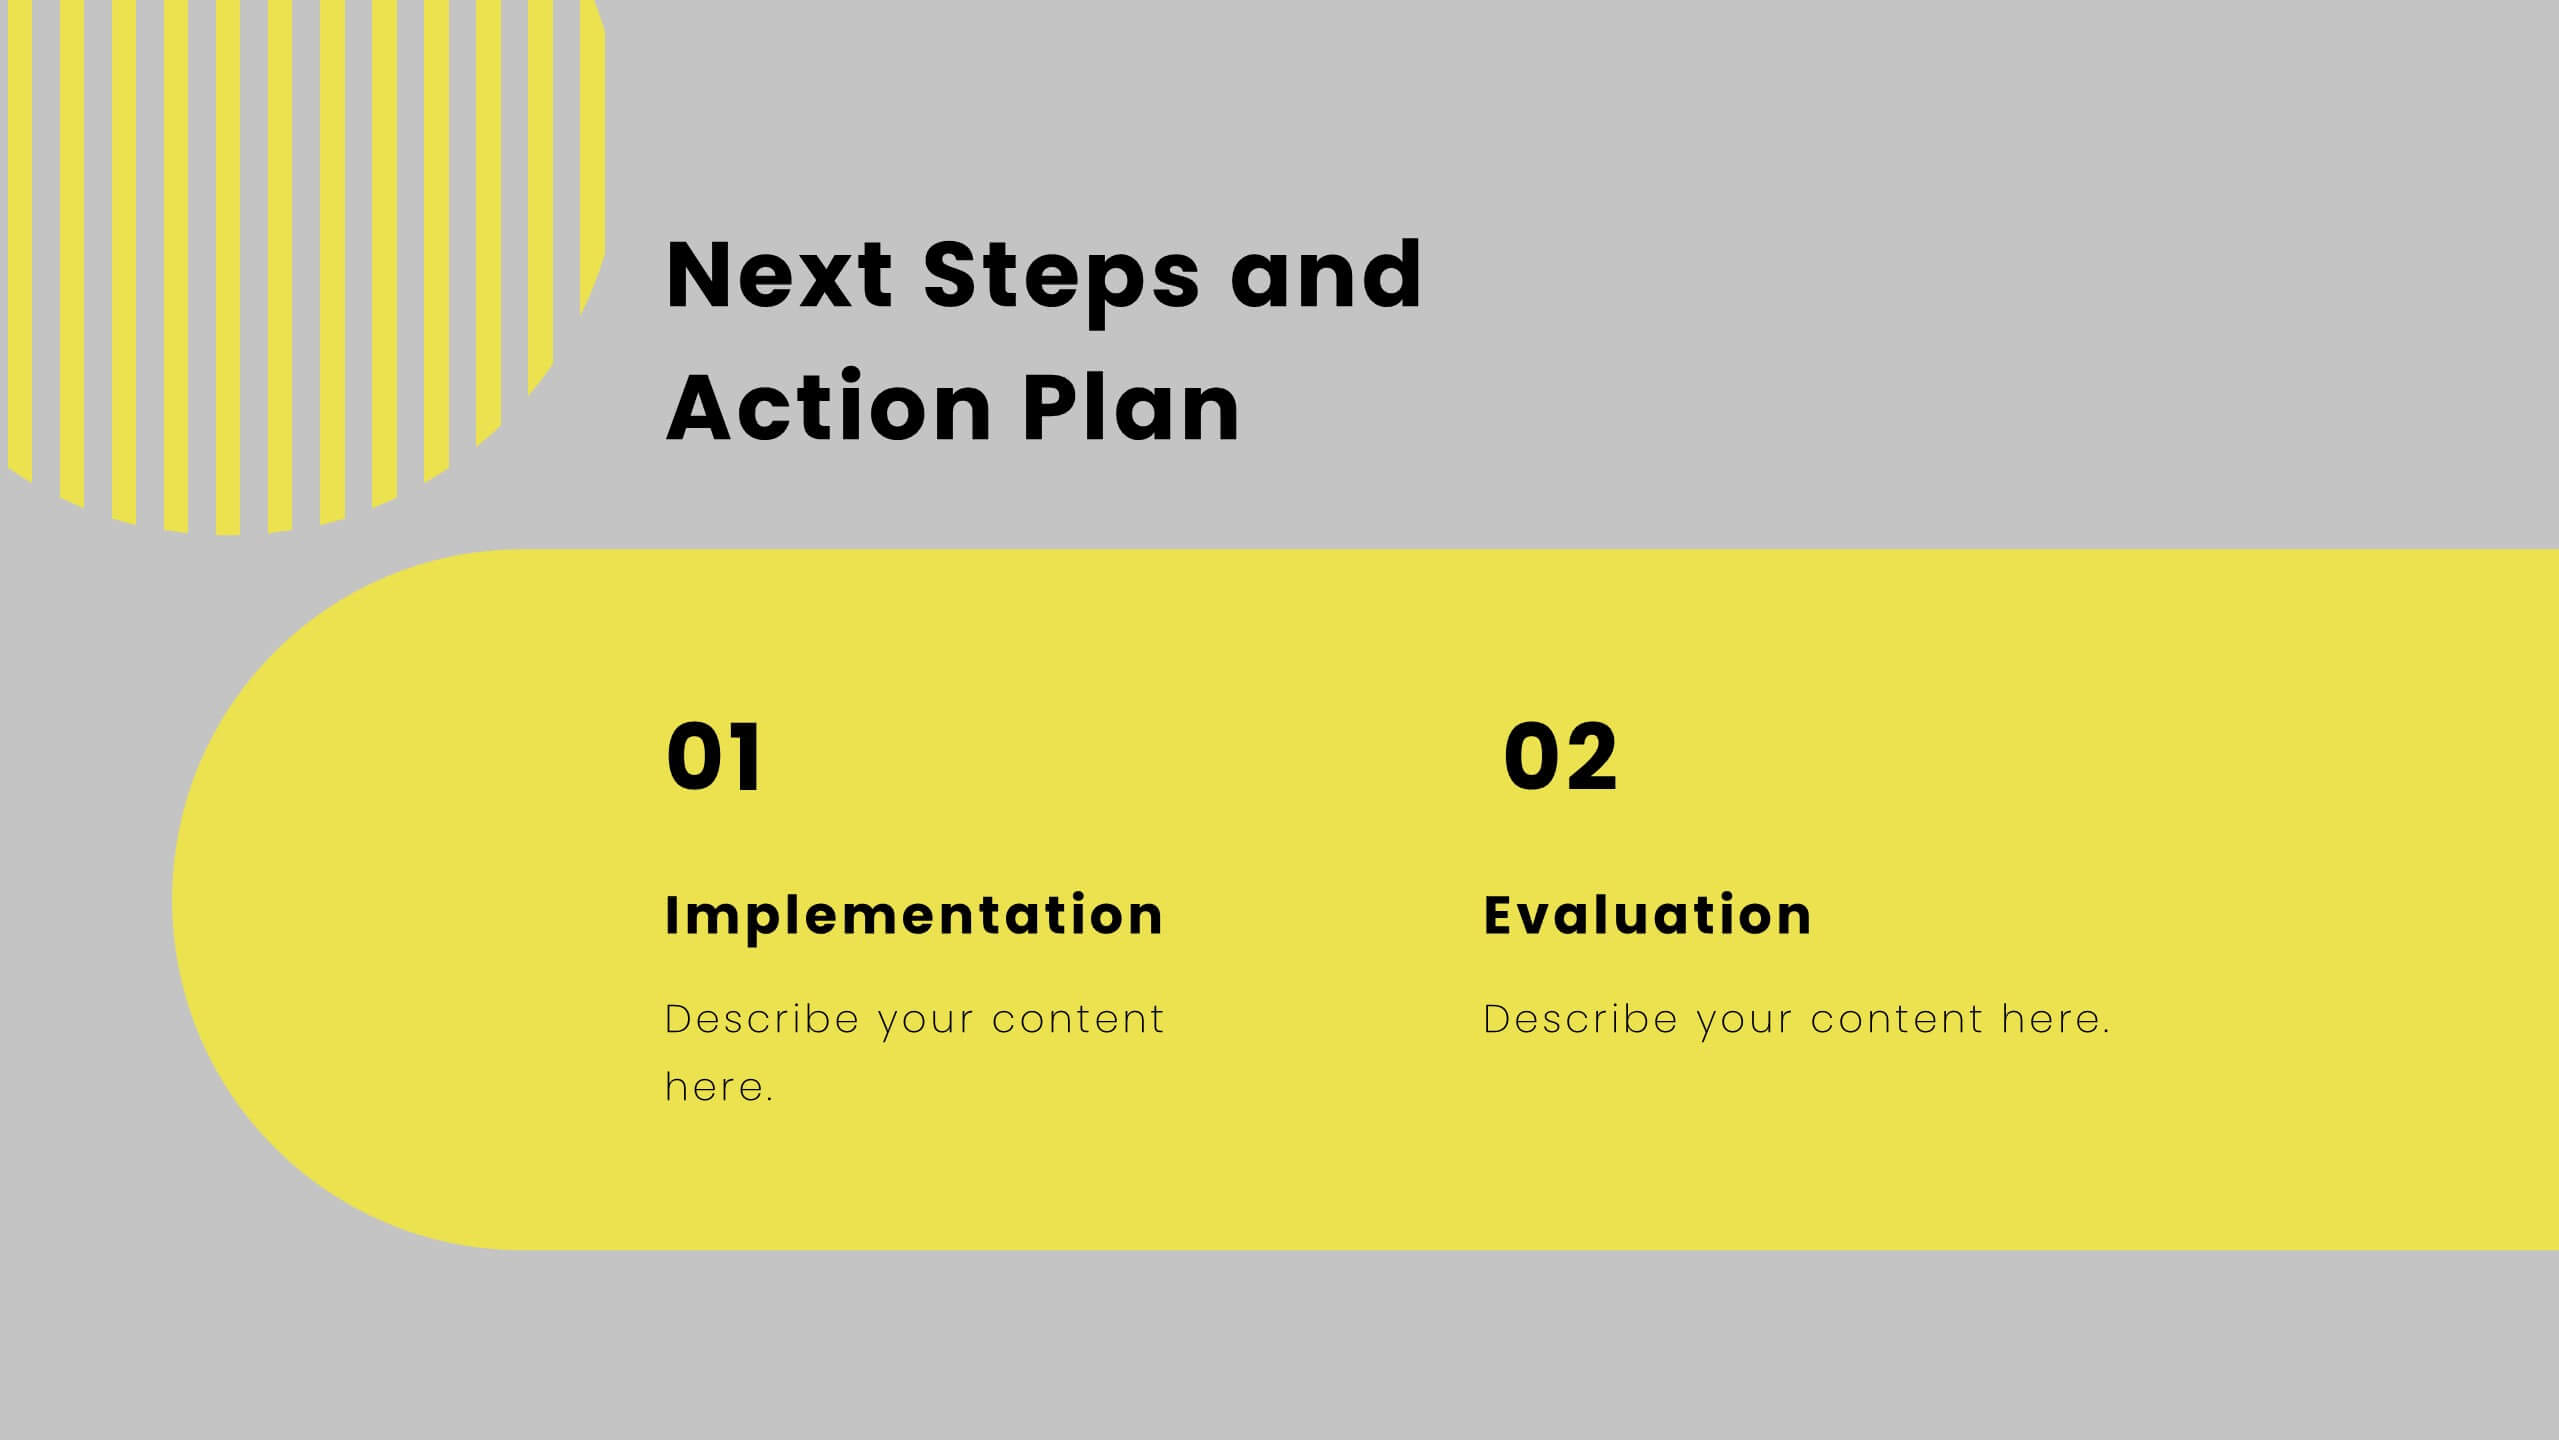
Bentom Marketing Proposal Presentation
This marketing proposal template is crafted to communicate your strategy with impact. With sections covering company overview, project summary, objectives, methodology, budget breakdown, and deliverables, it provides a professional layout for presenting key details to clients. Tailor it to fit your needs, and present confidently using PowerPoint, Keynote, or Google Slides.


20 slides
Onyx Project Proposal Presentation
This sleek, modern project proposal template is designed for clarity and impact. Featuring sections like objectives, scope of work, pricing structure, and client testimonials, it’s ideal for presenting detailed proposals to stakeholders. Perfectly compatible with PowerPoint, Keynote, and Google Slides, it ensures a professional presentation that impresses every time!


5 slides
Comprehensive Sex Education Infographics
Navigate the sensitive landscape of human sexuality education with our comprehensive sex education infographics. Cast on a canvas of bold colors like black, yellow, and red, these infographics delicately handle the topics inherent to sex education. This tool is invaluable for educators, health professionals, advocacy groups, and policymakers who champion for informed, safe, and healthy choices. Compatible with Powerpoint, Keynote, and Google Slides. Ensuring the content resonates with audiences of diverse ages and backgrounds. The inclusion of compelling graphics and intuitive icons, fosters an environment of learning and openness, essential for impactful discussions.


12 slides
Understanding Digital Currencies Presentation
Simplify the complexity of crypto ecosystems with the Understanding Digital Currencies presentation template. Designed around a wallet-style visual, this layout highlights key features of various cryptocurrencies using six labeled touchpoints. Perfect for introducing Bitcoin, Ethereum, altcoins, and digital wallets in educational, financial, or blockchain-related presentations. Ideal for crypto educators, fintech startups, and investment analysts. Compatible with PowerPoint, Keynote, and Google Slides.


3 slides
Business Revenue Break-Even Strategy Presentation
Understand profitability with the Business Revenue Break-Even Strategy template. This visual tool illustrates the break-even point, helping businesses analyze costs, revenue, and profitability. Ideal for financial planning, it simplifies complex data into an easy-to-read format. Fully customizable and compatible with PowerPoint, Keynote, and Google Slides for seamless presentations.


6 slides
Sales Strategy 30-60-90 Day Plan Presentation
Drive sales success with this structured 30-60-90 day strategy template! Designed to help sales teams and professionals set clear objectives, track progress, and optimize performance, this layout ensures a smooth transition from planning to execution. Fully customizable and compatible with PowerPoint, Keynote, and Google Slides for seamless presentations.


10 slides
Depth-Based Visual Charts in 3D Presentation
Elevate your data storytelling with the Depth-Based Visual Charts in 3D Presentation. This slide set transforms layered information into eye-catching 3D stack visuals—perfect for showcasing rankings, workflows, or strategic hierarchies. Fully editable in PowerPoint, Keynote, and Google Slides for seamless customization.


6 slides
Vision-to-Execution Roadmap
Turn bold ideas into actionable plans with the Vision-to-Execution Roadmap Presentation. This circular, multi-phase layout helps you illustrate how strategic goals evolve into tangible results across five connected stages. Ideal for pitching initiatives, mapping transformation phases, or guiding teams from concept to completion. Fully customizable in PowerPoint, Keynote, and Google Slides.


7 slides
Big Data Management Infographic
Step into the dynamic realm of big data with our big data management infographic. Set against a palette of green, blue, and white, this template illuminates the intricacies of managing vast amounts of information in today's digital age. Tailored for data scientists, IT professionals, business analysts, and educators, this infographic offers a clear visual breakdown of complex data processes. Its informative style ensures comprehension and engagement, making it a must-have for those aiming to demystify big data. Compatible with PowerPoint, Keynote, or Google Slides, it promises versatility in presentations.