


Features
- 4 Unique slides
- Fully editable and easy to edit in Microsoft Powerpoint, Keynote and Google Slides
- 16:9 widescreen layout
- Clean and professional designs
- Export to JPG, PDF or send by email


Do you have any questions?
Recommend


20 slides
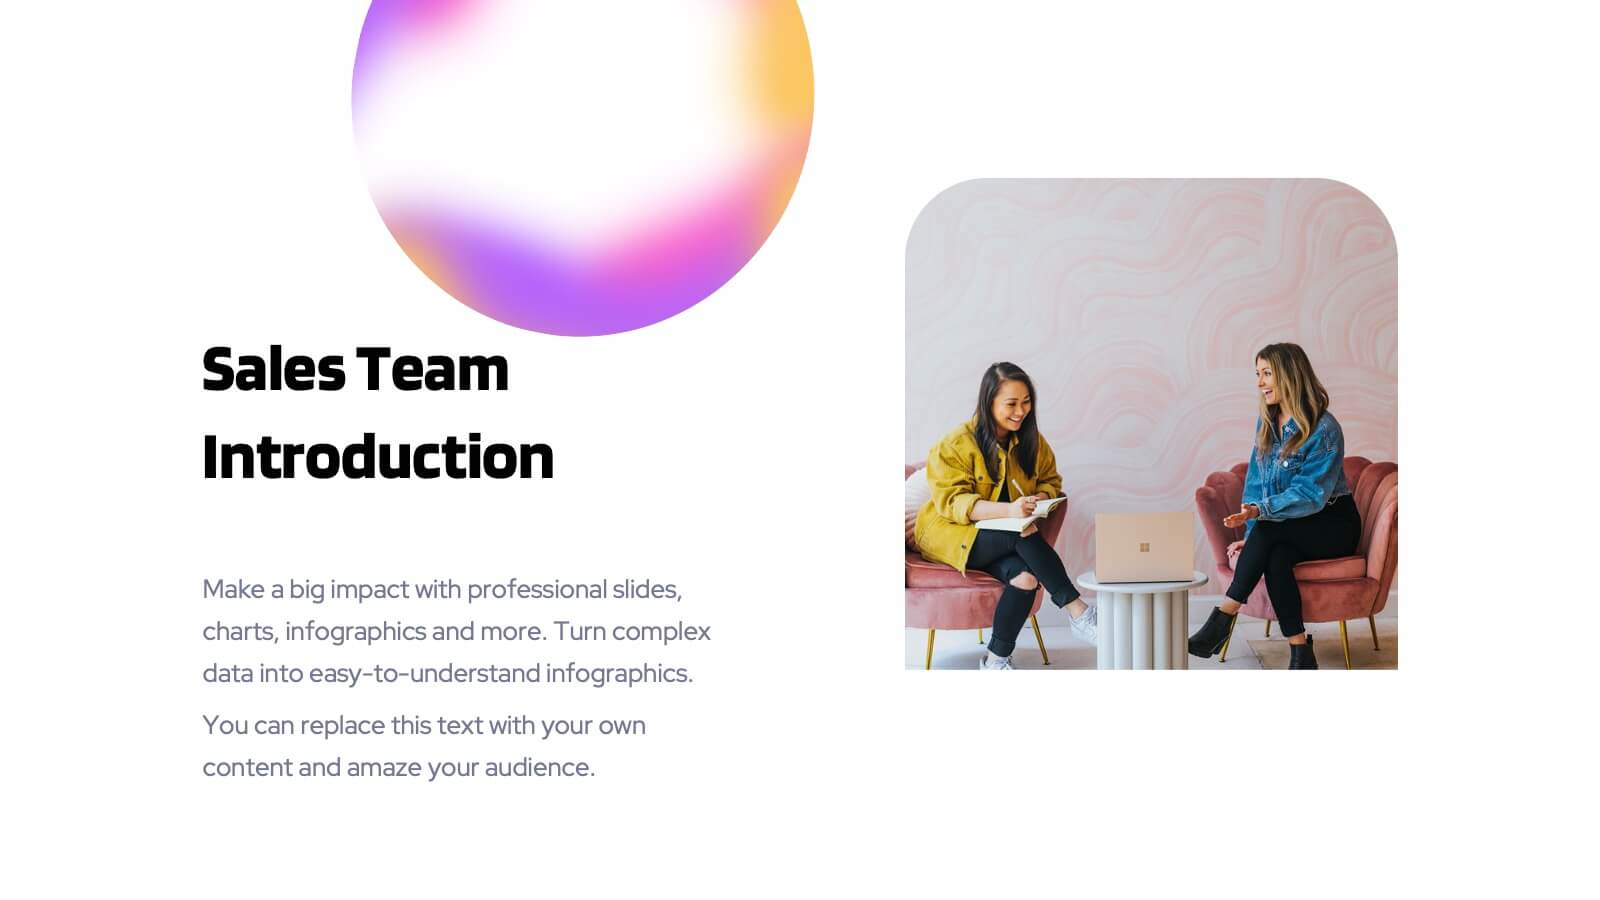
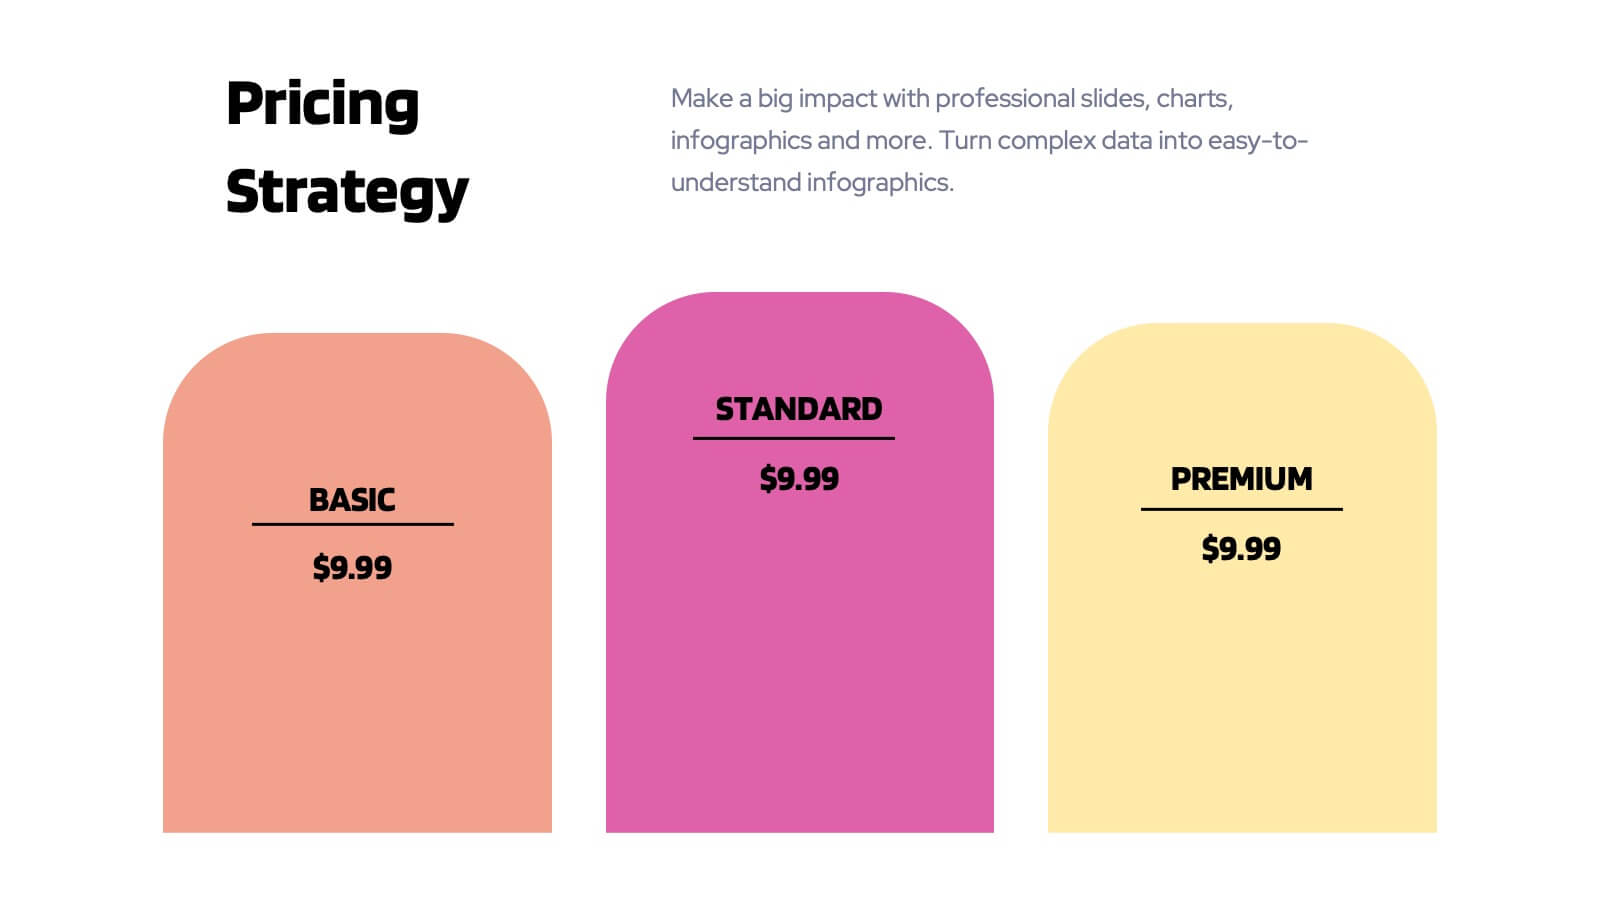
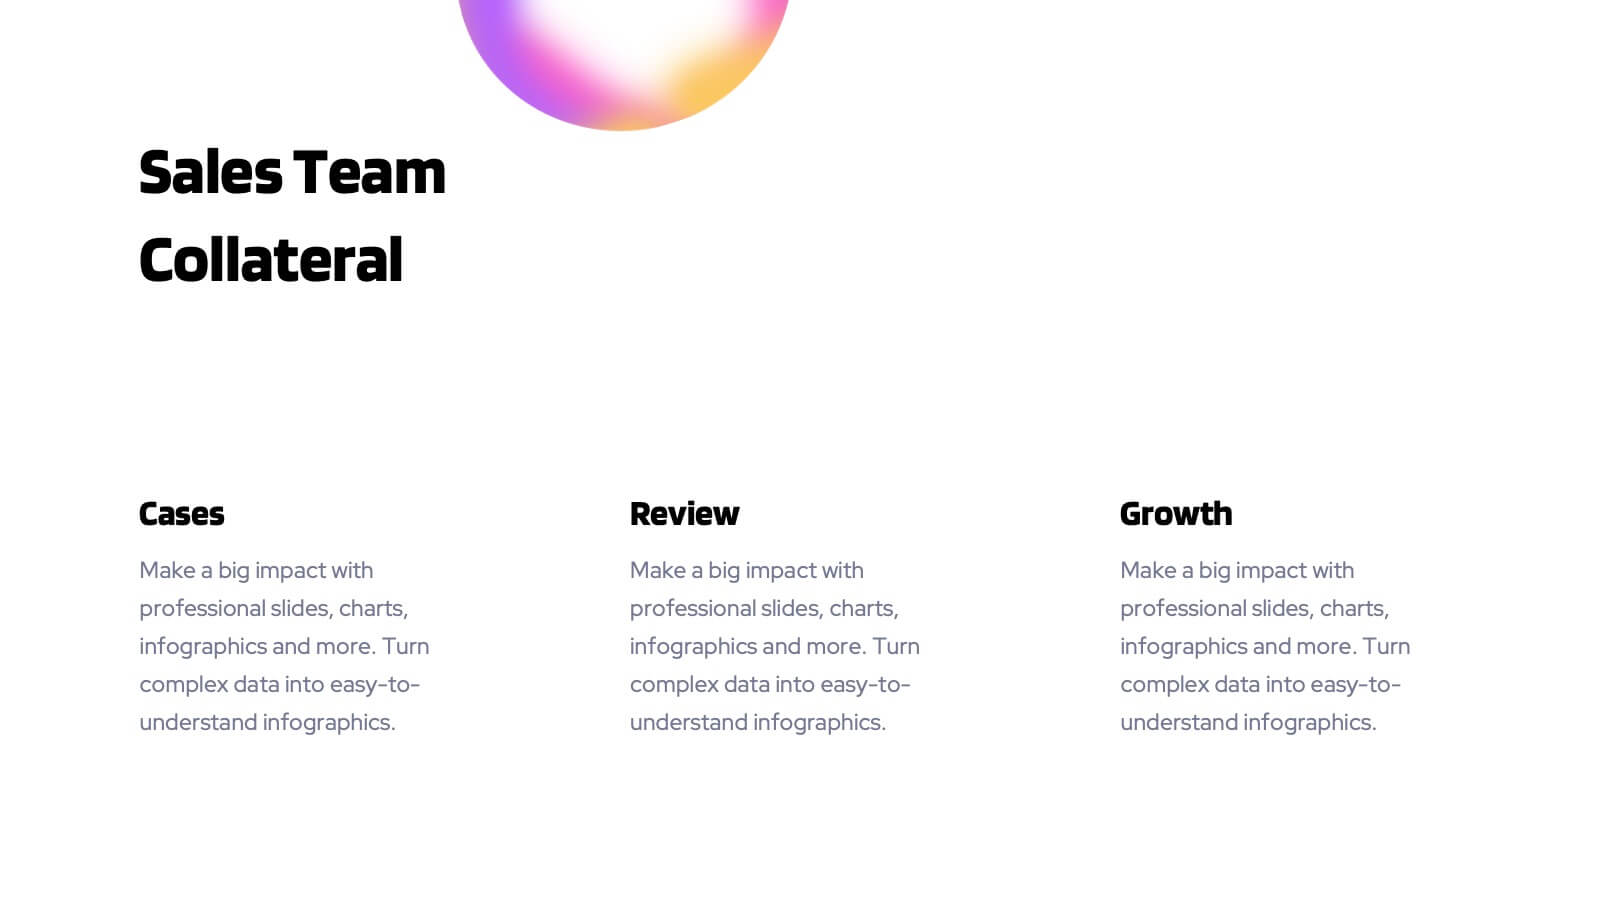
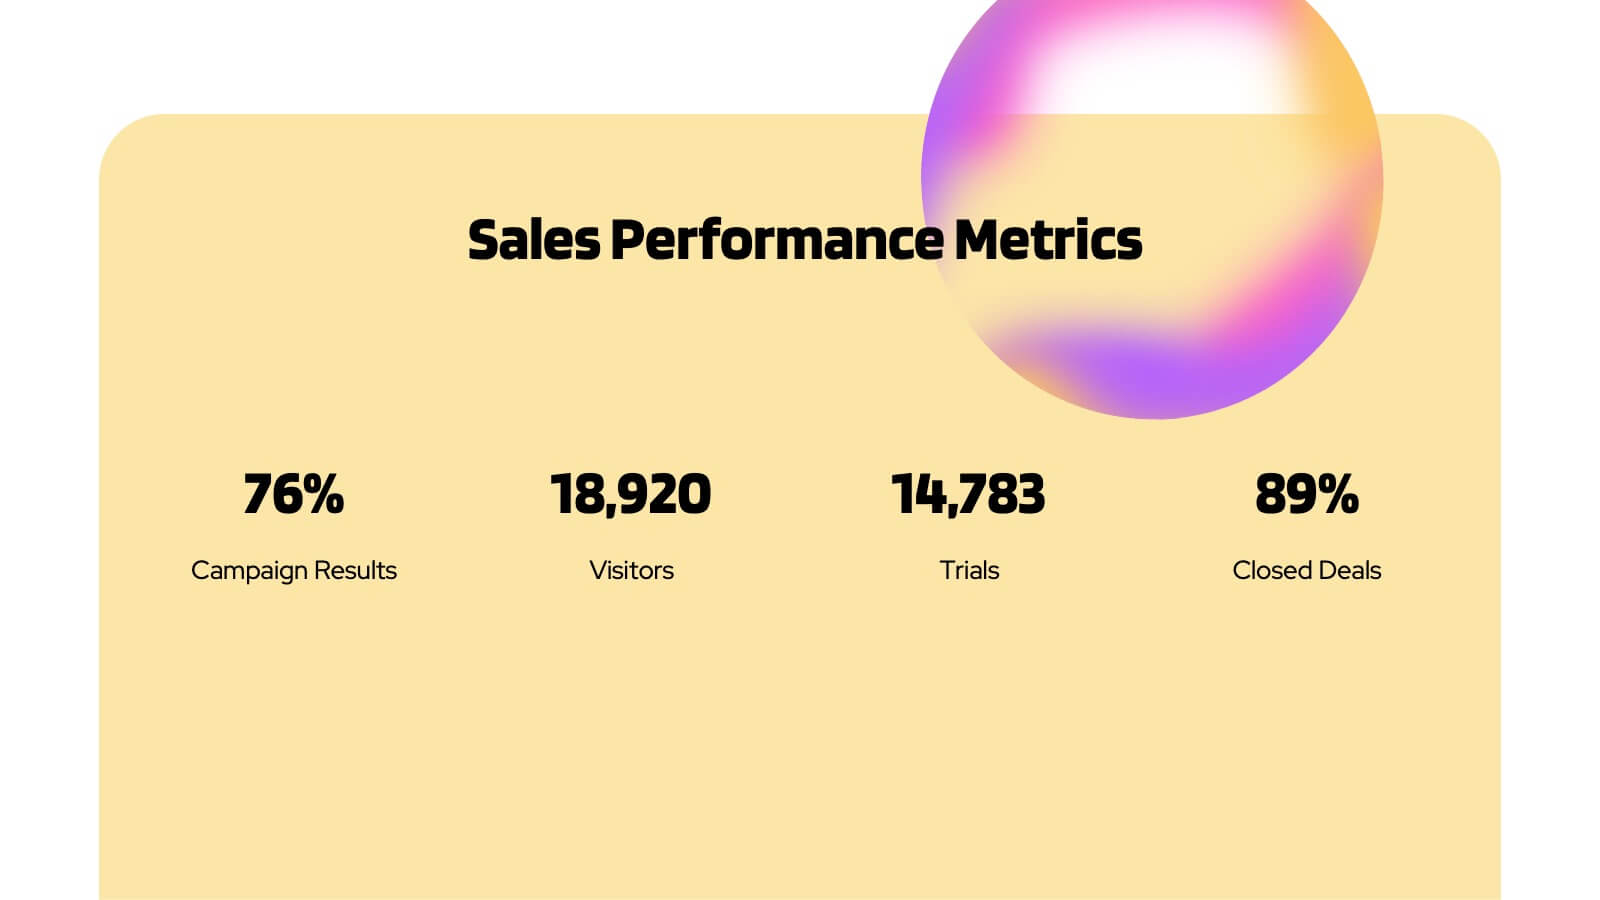
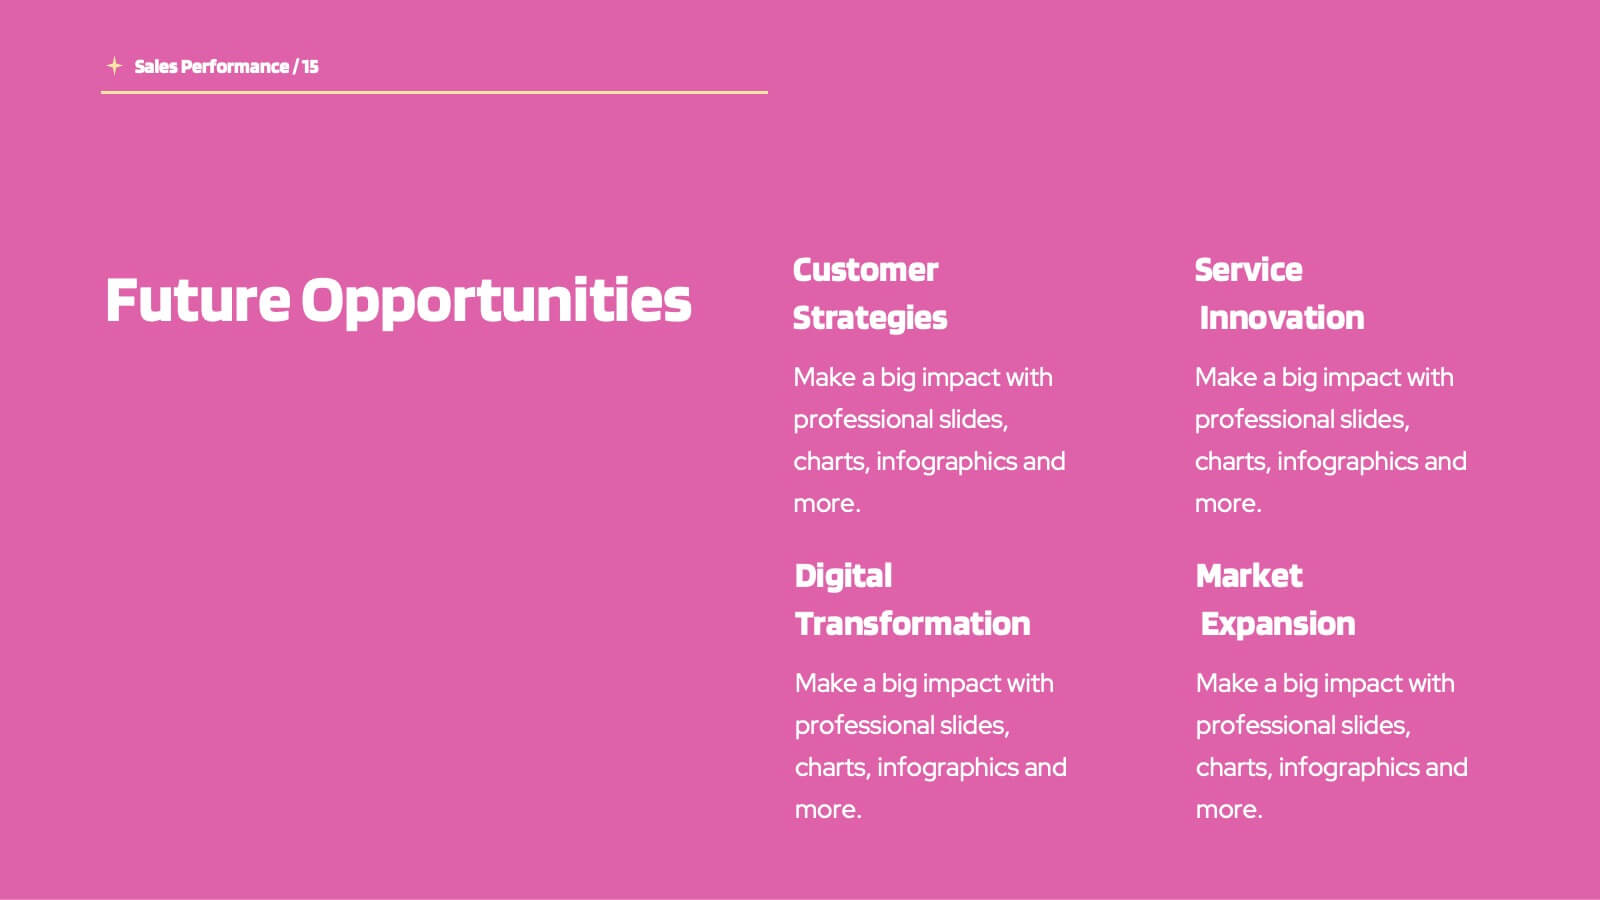
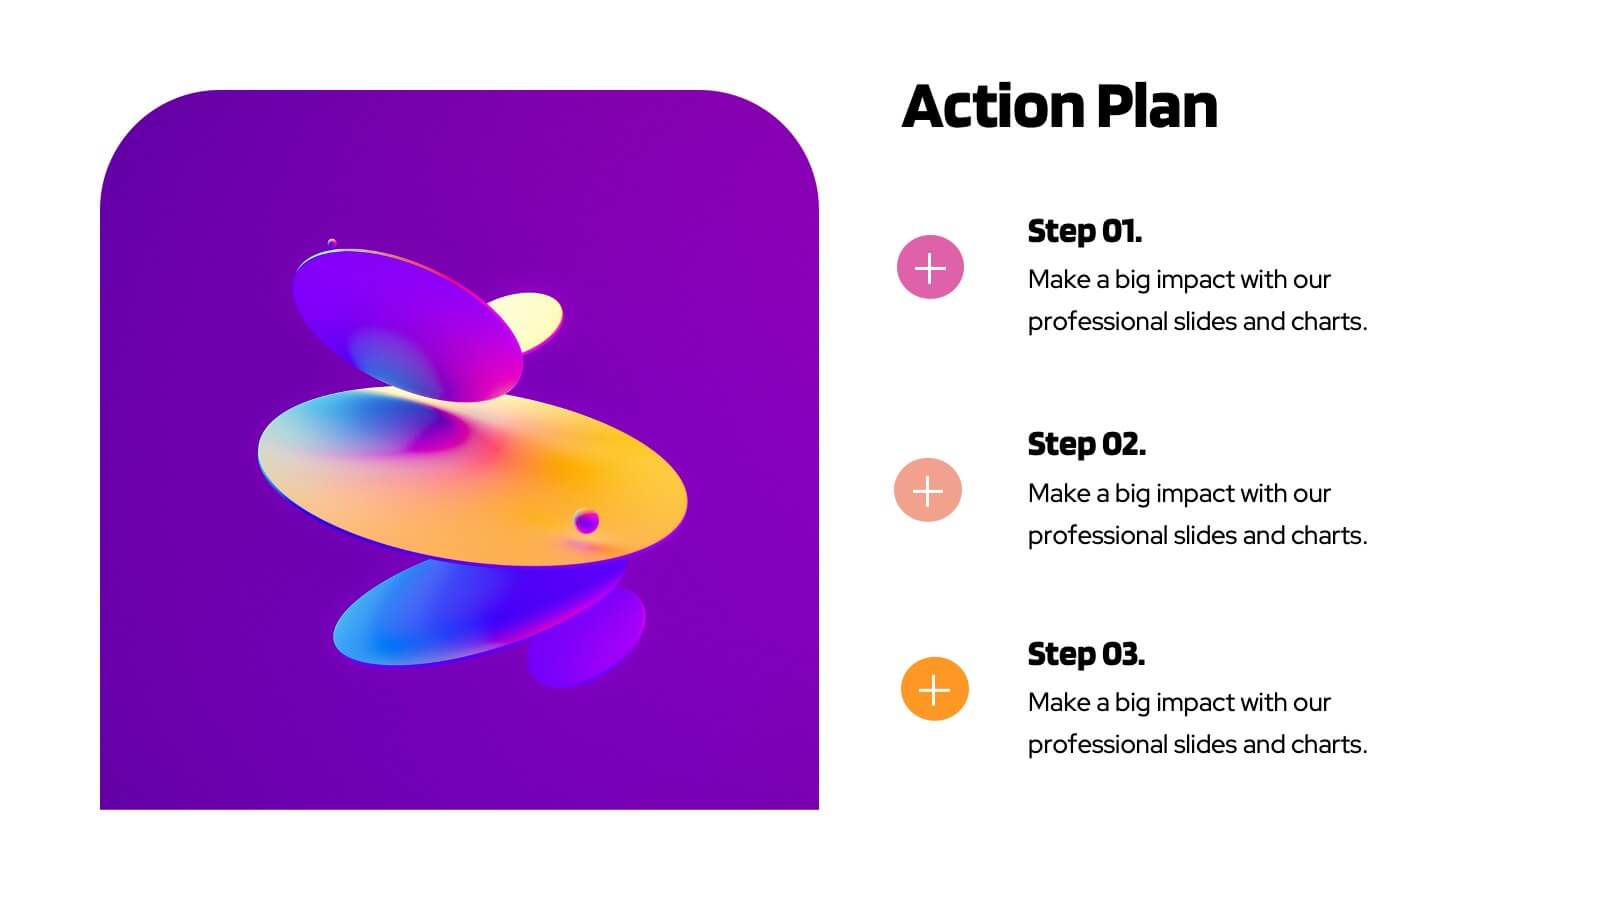
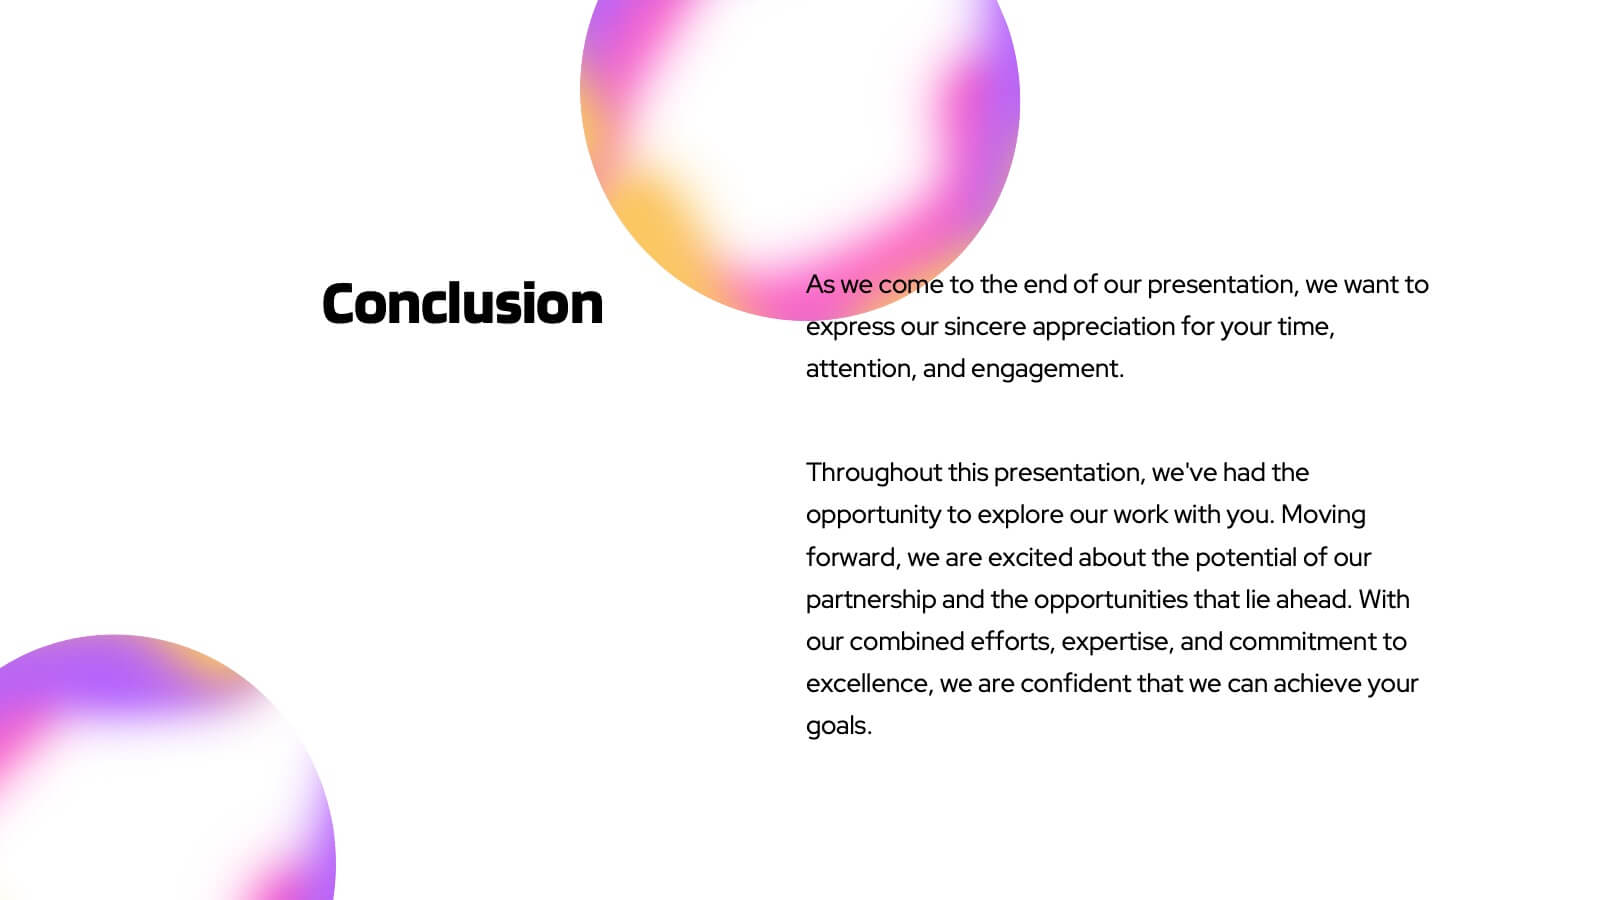
Planetary Sales Performance Report Presentation
Energize your sales efforts with this vivid sales performance presentation template. It includes sections for company overview, detailed sales metrics, and future goals, perfect for showcasing achievements. Compatible with PowerPoint, Google Slides, and Keynote, it’s designed to inform and motivate sales teams effectively.


7 slides
Exponential Growth Infographic
Exponential growth refers to a process where a quantity grows at a consistent percentage rate per unit of time. This infographic template takes your audience on a visual expedition through the marvels of exponential expansion, turning complex data into a clear and engaging narrative. Compatible with Powerpoint, Keynote, and Google Slides. This features dynamic visuals like ascending graphs and vibrant charts, this infographic embodies the essence of exponential growth, making this come alive. Showcase the growth trajectory using ascending line graphs or bar charts, visually representing the skyrocketing growth in a way that's easy to comprehend.


10 slides
Market Positioning Competitive Analysis
Visually assess your brand’s position in the market with this quadrant-based layout designed for strategic clarity. This slide helps showcase key comparisons across marketing analysis, target audience alignment, unique value proposition, and messaging consistency. Fully editable in PowerPoint, Keynote, and Google Slides.


22 slides
Vivid Market Research Presentation
Unveil the insights that drive decisions with the Vivid Market Research Presentation template! This sleek and professional template is crafted to help you present complex data in an engaging and easy-to-understand format. Whether you're analyzing market trends, exploring customer behavior, or evaluating competitive landscapes, this template provides a clear structure to convey your findings. It includes sections for research objectives, methodologies, key findings, and recommendations, ensuring you cover every aspect of your market research comprehensively. With a clean design that emphasizes clarity and visual appeal, your audience will stay focused and intrigued throughout the presentation. Perfect for business analysts, marketers, and researchers, the Vivid template is fully customizable and works seamlessly with PowerPoint, Keynote, and Google Slides. Elevate your market research presentations and make your data come to life with Vivid!

22 slides
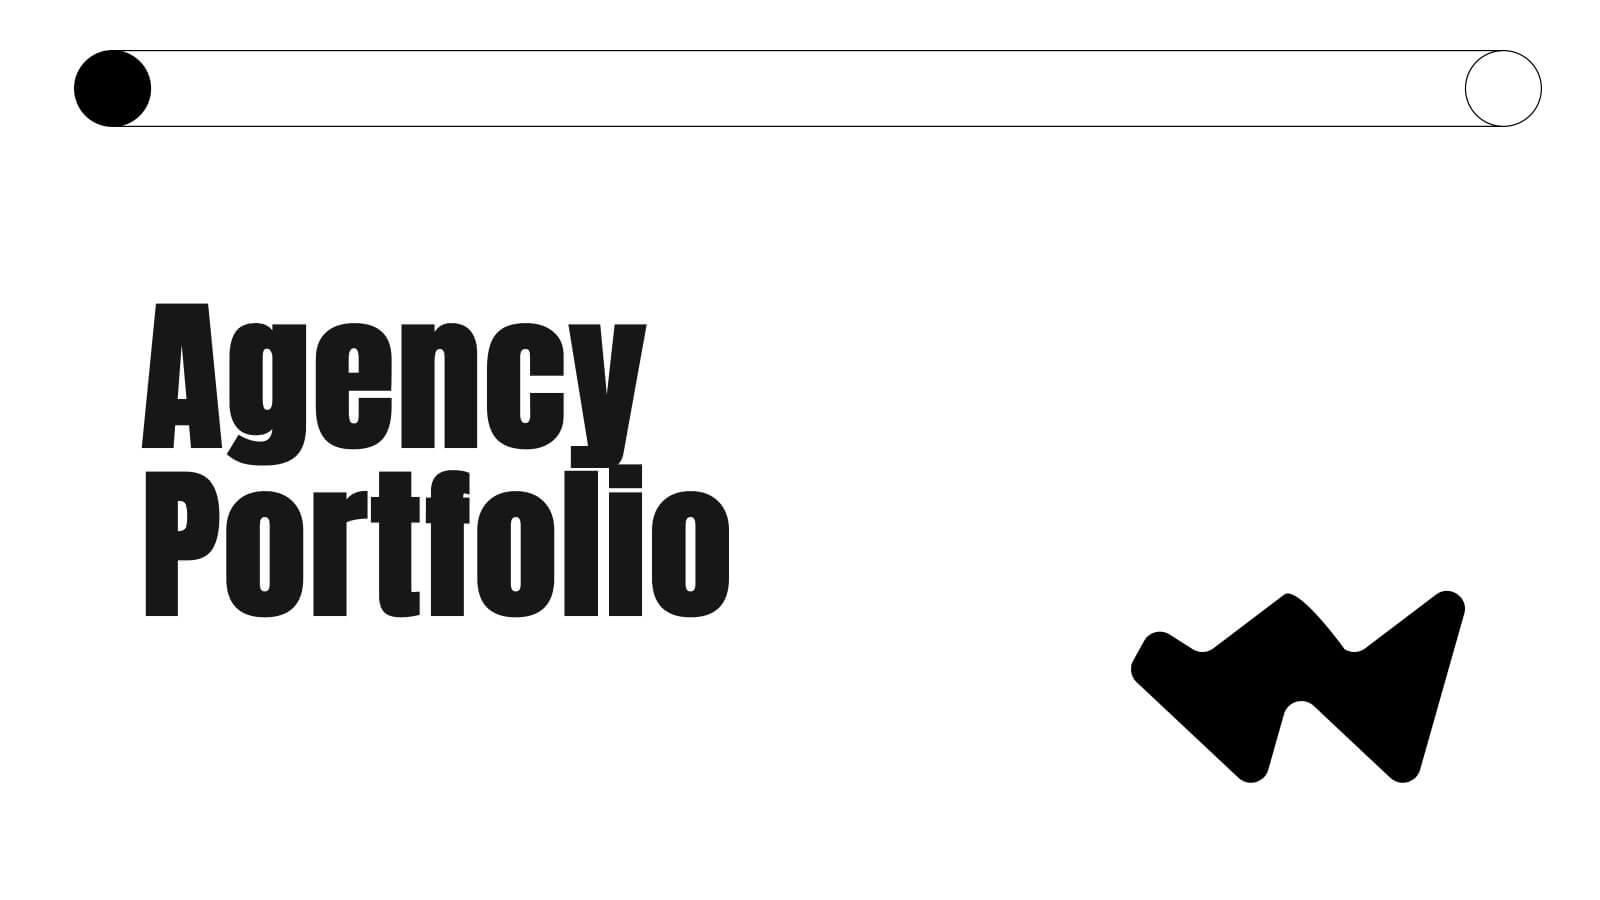
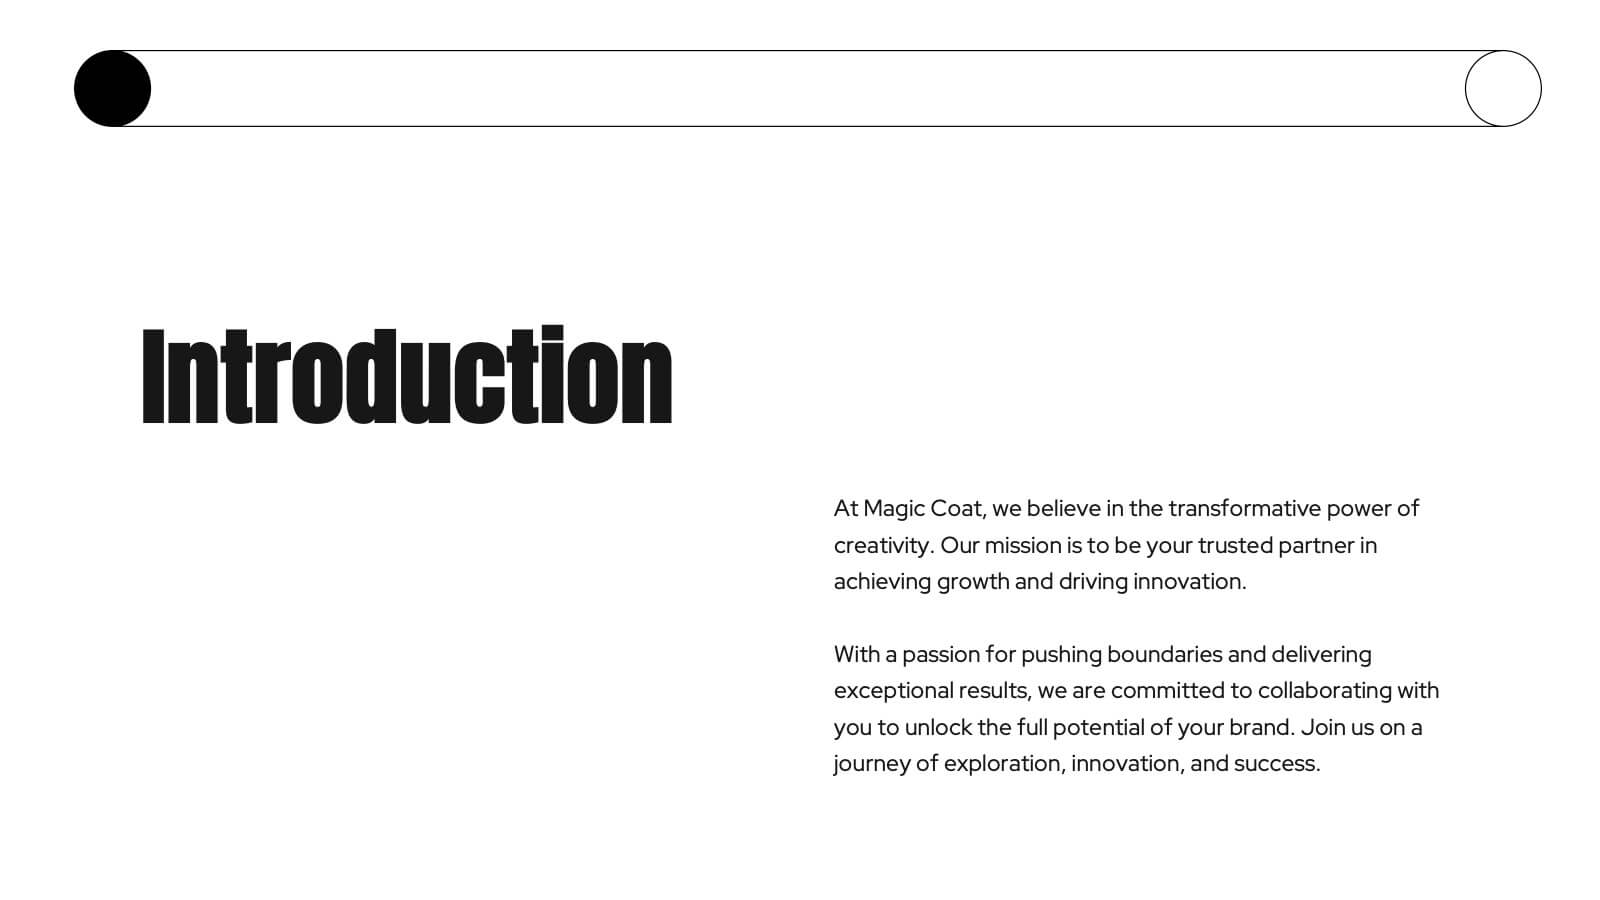
Kraken Agency Portfolio Presentation
This agency portfolio template showcases your agency's work and expertise with a sleek, modern design. It features slides for client success stories, case studies, services, market analysis, and creative process. Perfect for demonstrating your team’s skills and approach. Compatible with PowerPoint, Keynote, and Google Slides for easy customization and presentation.


3 slides
Governance and Compliance Framework Presentation
Strengthen your organization's structure with our Governance and Compliance Framework template. This visually compelling template is crafted to effectively communicate the integration of governance, compliance, and risk management. It is ideal for demonstrating how these elements collaborate to uphold regulatory standards and manage business risks. Fully compatible with PowerPoint, Keynote, and Google Slides, it's an essential tool for any corporate governance presentation aimed at promoting effective, compliant business practices.


26 slides
Creative Cryptocurrency Investment Presentation
The growth of Cryptocurrency has been significant over the past few years. It is very important to do your own research, understand the risks involved, and only invest what you can afford to lose. This template is designed with a focus on cryptocurrencies and includes customizable photo layouts, charts, a gold coin pattern and unique cryptocurrency-themed icons and illustrations. You can use this template for any topic related to Cryptocurrency or Blockchain. Create your own presentation within minutes using Powerpoint, Keynote, or Google slides, it is fully editable to suit your needs.


7 slides
Short Term Goals Infographic Presentation
Short-term Goals are important because they provide a clear focus and direction for individuals or organizations to achieve their long-term objectives. Get started on your goals in no time with this template. It is professional, clean and has everything you need to create a presentation. It's a good choice for career advancement and pitches. This template is designed to help your audience visualize the impact of your goals. Use this template as a base to brainstorm your vision and objectives with your team. The goal-oriented design will bring awareness and create excitement about your goals.


5 slides
AIDA Steps Infographics
AIDA is a marketing model that is widely used in advertising and promotion. It stands for Awareness, Interest, Desire, and Action. It is a four-stage model that describes the process that a potential customer goes through before making a purchase. This Infographic can help you better understand how you can move your customers through these four stages. This consists of four sections that correspond to each stage of the model. Each section allows you to include a brief explanation of what the stage is, and how it relates to the overall purchase process. With these unique infographics, create an effective marketing strategy that successfully moves your customers through each stage of the AIDA model.


5 slides
Process Improvement Using Five Steps Framework Presentation
Visualize progress with clarity using the Process Improvement Using Five Steps Framework Presentation. This stepped layout helps you illustrate sequential actions, milestones, or improvements across five stages. Ideal for strategy, operations, or performance initiatives. Easy to customize in PowerPoint, Keynote, Google Slides, and Canva to fit your workflow needs.


7 slides
Cloud Architecture Infographic
Cloud technology is reshaping the digital landscape, and understanding its architecture is paramount. Dive into the intricacies of cloud systems with our cloud architecture infographic, crafted in a crisp white and serene blue palette. This visual tool demystifies the layers and components that constitute cloud frameworks. IT professionals, enterprise architects, and business decision-makers will greatly benefit from this structured depiction. Fully tailored for a smooth experience on PowerPoint, Keynote, and Google Slides, this infographic serves as a cornerstone for all looking to harness the potentials of cloud infrastructure.


5 slides
Step-by-Step Strategy Guide Presentation
Present your ideas with clarity and impact using this clean, structured layout made for professionals who value organization and design. Perfect for outlining strategies, steps, or lists, it keeps your message focused and engaging. Easily customizable and fully compatible with PowerPoint, Keynote, and Google Slides for polished results.


10 slides
Innovation in Science Presentation
Showcase cutting-edge ideas with this Innovation in Science Presentation Template. Featuring a sleek lightbulb graphic with colorful horizontal bars, it's ideal for outlining research stages, technological breakthroughs, or futuristic concepts. Great for scientists, educators, and innovation teams. Easily customizable in PowerPoint, Keynote, and Google Slides.


5 slides
Suicide Prevention & Awareness Infographics
Suicide Awareness plays a vital role in addressing the global public health issue of suicide. These vertical infographics are powerful and informative designs that aim to raise awareness about suicide prevention, promote mental health, and provide essential information to help individuals recognize the signs and support those in need. With its thoughtful and sensitive design, the template communicates important statistics, facts, and resources. The template is fully customizable, allowing you to personalize the infographics with your own content, including local helpline numbers, support services, or specific awareness campaigns.


7 slides
Milestones Credit Card Infographic Presentation
A Milestones Infographic is a visual representation of significant events, accomplishments, or achievements in a project, business, or individual's life. This template include timelines, graphs, diagrams, and other visual elements to help convey important information. You can use this infographic to cover many different topics, including project management, business growth, personal achievements, or company history. This template is useful for businesses or individuals who want to showcase their accomplishments, highlight important dates or events, or just share progress updates.


7 slides
Budget Forecasting Spreadsheet Infographic
Step into the strategic realm of budget forecasting with our detailed infographic. Cast in the reliability of blue, the vibrancy of orange, and the optimism of yellow, our template is a beacon of financial foresight. Equipped with precise infographics, intuitive icons, and adaptable image placeholders, it transforms financial data into a predictive narrative. Flawlessly tailored for Powerpoint, Keynote, or Google Slides. An essential tool for financial analysts, business strategists, accountants, or any professional navigating the future financial terrains of their organization. Forecast with confidence; let every slide be a roadmap to financial prudence.


5 slides
Future of 5G and Wireless Innovation Presentation
Step into the next era of connectivity with a clean, visual story that highlights how emerging wireless technologies continue to evolve. This presentation helps you explain trends, breakthroughs, and network innovations in a clear, modern layout. Fully compatible with PowerPoint, Keynote, and Google Slides.