


Features
- 10 Unique slides
- Fully editable and easy to edit in Microsoft Powerpoint, Keynote and Google Slides
- 16:9 widescreen layout
- Clean and professional designs
- Export to JPG, PDF or send by email


Do you have any questions?
Recommend


2 slides
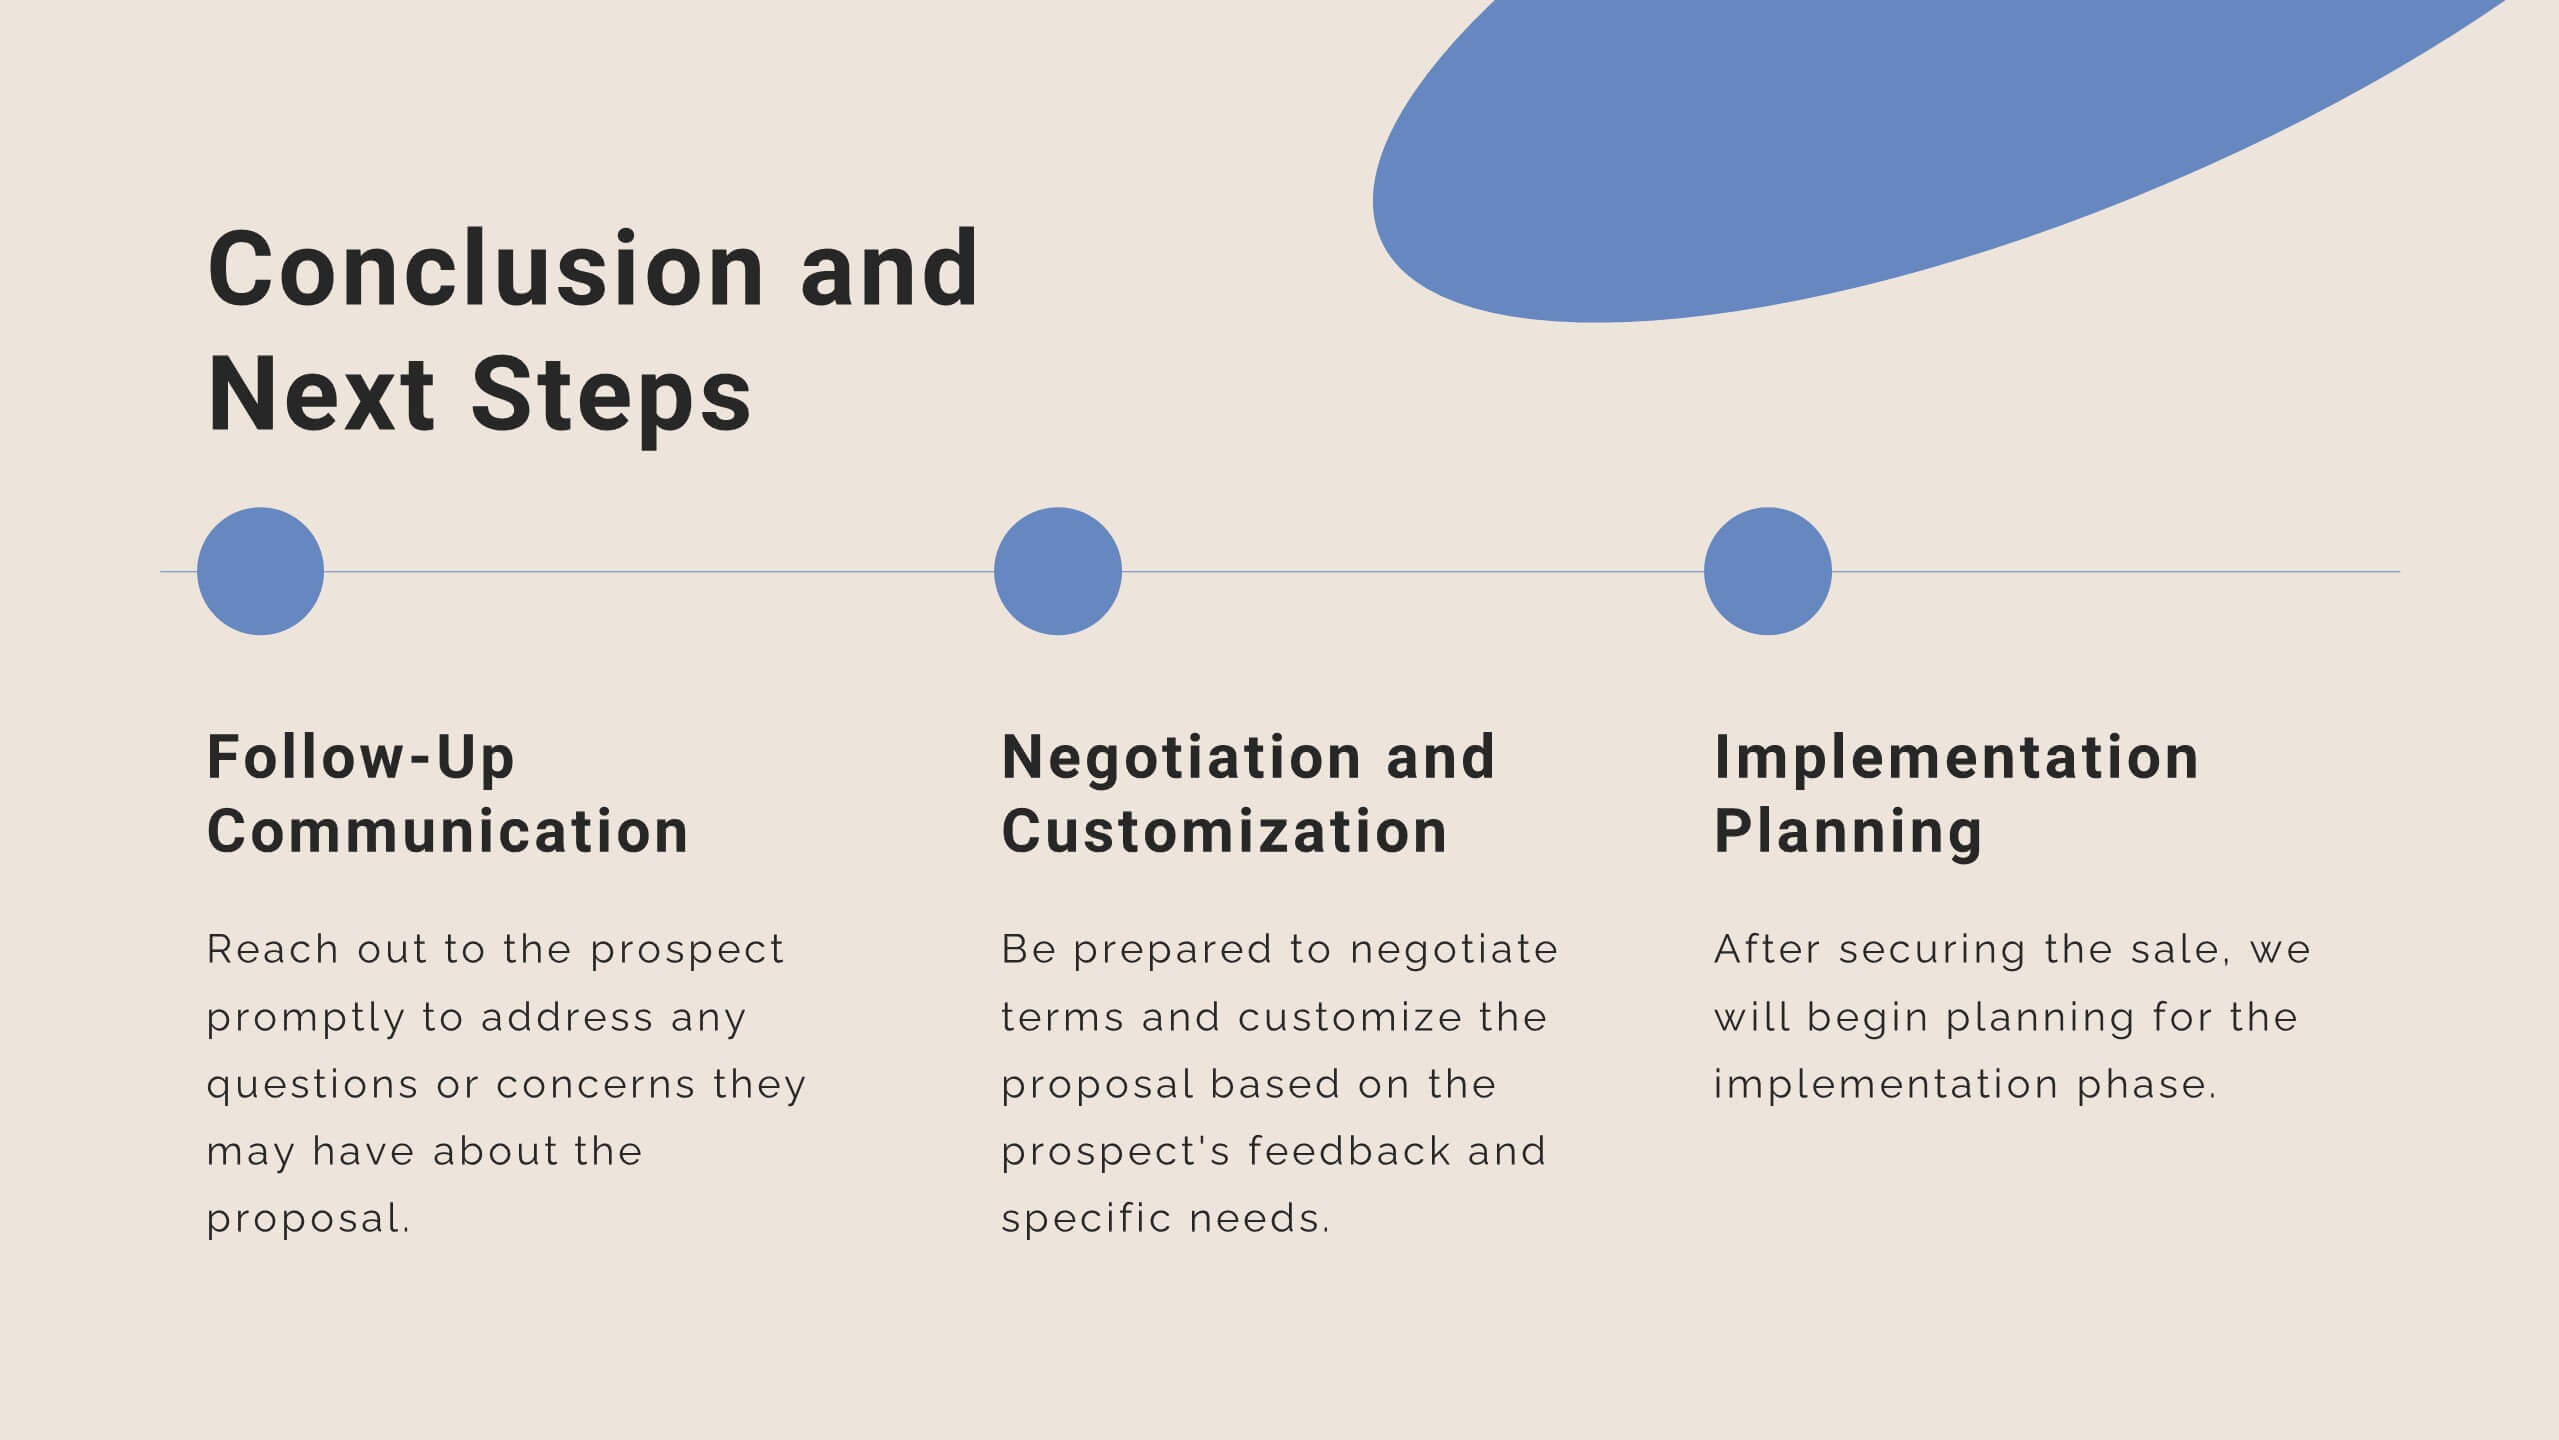
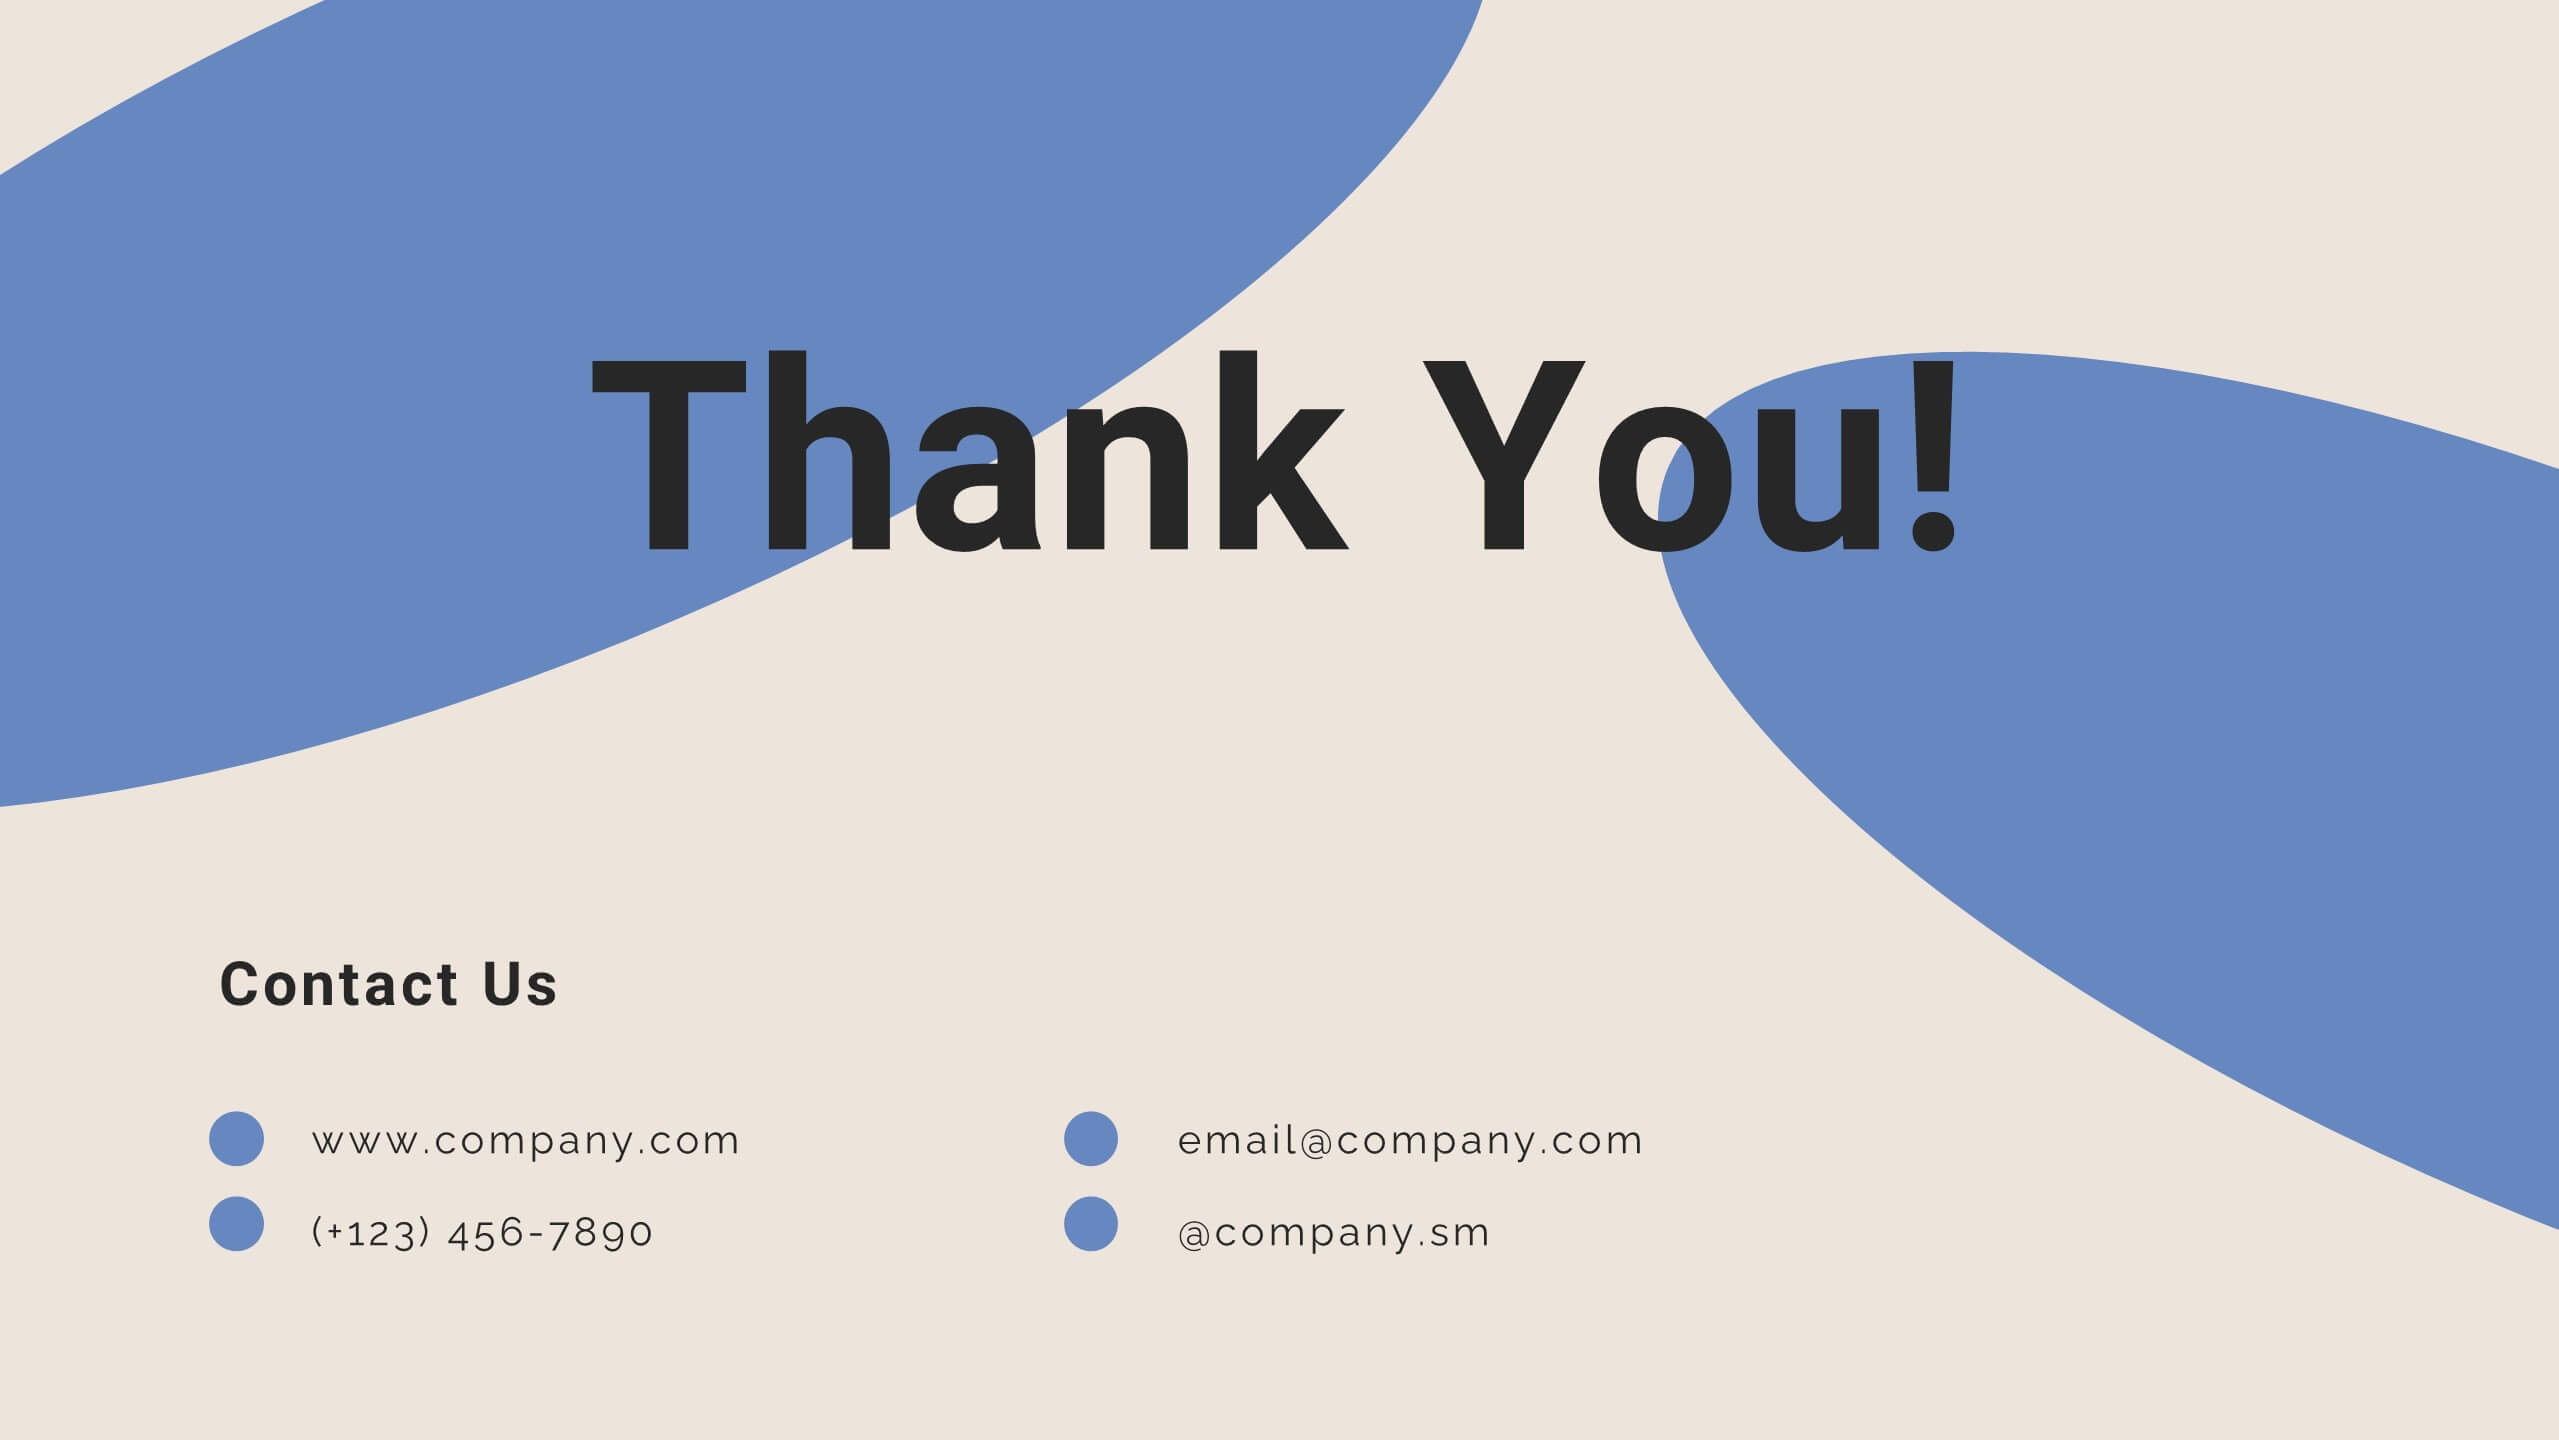
Creative Gratitude Slide Presentation
Express gratitude in style with this creative thank-you slide template! Featuring bold typography and modern geometric elements, this design adds a unique touch to your presentations. Ideal for business pitches, creative projects, and professional meetings. Fully customizable and compatible with PowerPoint, Keynote, and Google Slides for effortless personalization.


6 slides
Stages of the Product Life Cycle Presentation
Illustrate the evolution of a product from launch to decline with the Stages of the Product Life Cycle presentation. This vibrant, segmented chart template visualizes key phases—Introduction, Growth, Maturity, and Decline—making it perfect for marketers, product managers, and strategists. Each stage is color-coded and icon-marked to enhance clarity and engagement. Fully customizable in PowerPoint, Keynote, and Google Slides.


4 slides
Workplace Collaboration and Team Scenes Presentation
Bring your teamwork story to life with this vibrant, arrow-based layout that guides the viewer through four clear steps. Perfect for visualizing collaboration strategies, team roles, or task flow, this template balances clean design with helpful icons. Easily customize it in PowerPoint, Keynote, or Google Slides for a polished presentation.


6 slides
How to Master Time Management Presentation
Make every minute count with this sleek and dynamic template built to visualize productivity, efficiency, and planning. Perfect for showcasing workflows, priorities, or time allocation, it helps communicate structure with clarity and style. Fully customizable and compatible with PowerPoint, Keynote, and Google Slides for effortless editing and presentation.


6 slides
30 60 90 Manager Infographic
A 30-60-90 day plan outlines an individual's goals and tasks for the first three months of a new job, project, or role. This infographic template outlines the goals and tasks a manager plans to achieve during the first 30, 60, and 90 days of their role. This is a helpful tool to communicate objectives and strategy to your team. Design the infographic so that it's easy to share. The 30-60-90 Manager Infographic serves as a roadmap for the manager's initial months and provides transparency to their team about their goals and priorities. Use a consistent color scheme that aligns with your company's branding.


22 slides
Mystic Startup Strategy Presentation
Launch your startup with confidence using this comprehensive funding proposal template! Perfect for showcasing your mission, vision, and business model to potential investors. Highlight your unique value proposition and growth plan with style. Compatible with PowerPoint, Keynote, and Google Slides, this template ensures your pitch stands out and secures the funding you need.


8 slides
Directional Diagram with Progress Arrows Presentation
Showcase milestones, track development, or visualize progress with the Directional Diagram with Progress Arrows Presentation. This modern layout features arrow-based steps, making it ideal for roadmaps, process stages, or timeline breakdowns. Customize labels, icons, and colors to suit your message. Fully editable in PowerPoint, Google Slides, and Canva.


10 slides
Corporate Framework and Structure Presentation
Clearly define your corporate framework and structure with this professional infographic template. Ideal for executives, team leaders, and project managers, this slide visually organizes organizational hierarchy, roles, and key responsibilities in a clean and structured layout. Fully editable in PowerPoint, Keynote, and Google Slides, allowing seamless customization for your company's needs.


5 slides
Video Games History Infographics
The history of video games is a testament to the constant innovation and evolution of technology. These vertical infographics are visually captivating and informative designs that allow you to showcase the evolution and milestones of the video game industry. This template is perfect for presentations, educational materials, or any content related to video game history. Compatible with PowerPoint, Keynote, and Google Slides. This template features a combination of text, icons, illustrations, and vibrant colors to captivate your audience and present information in a visually appealing way. This is a powerful tool for showcasing the impact of the video game industry.


5 slides
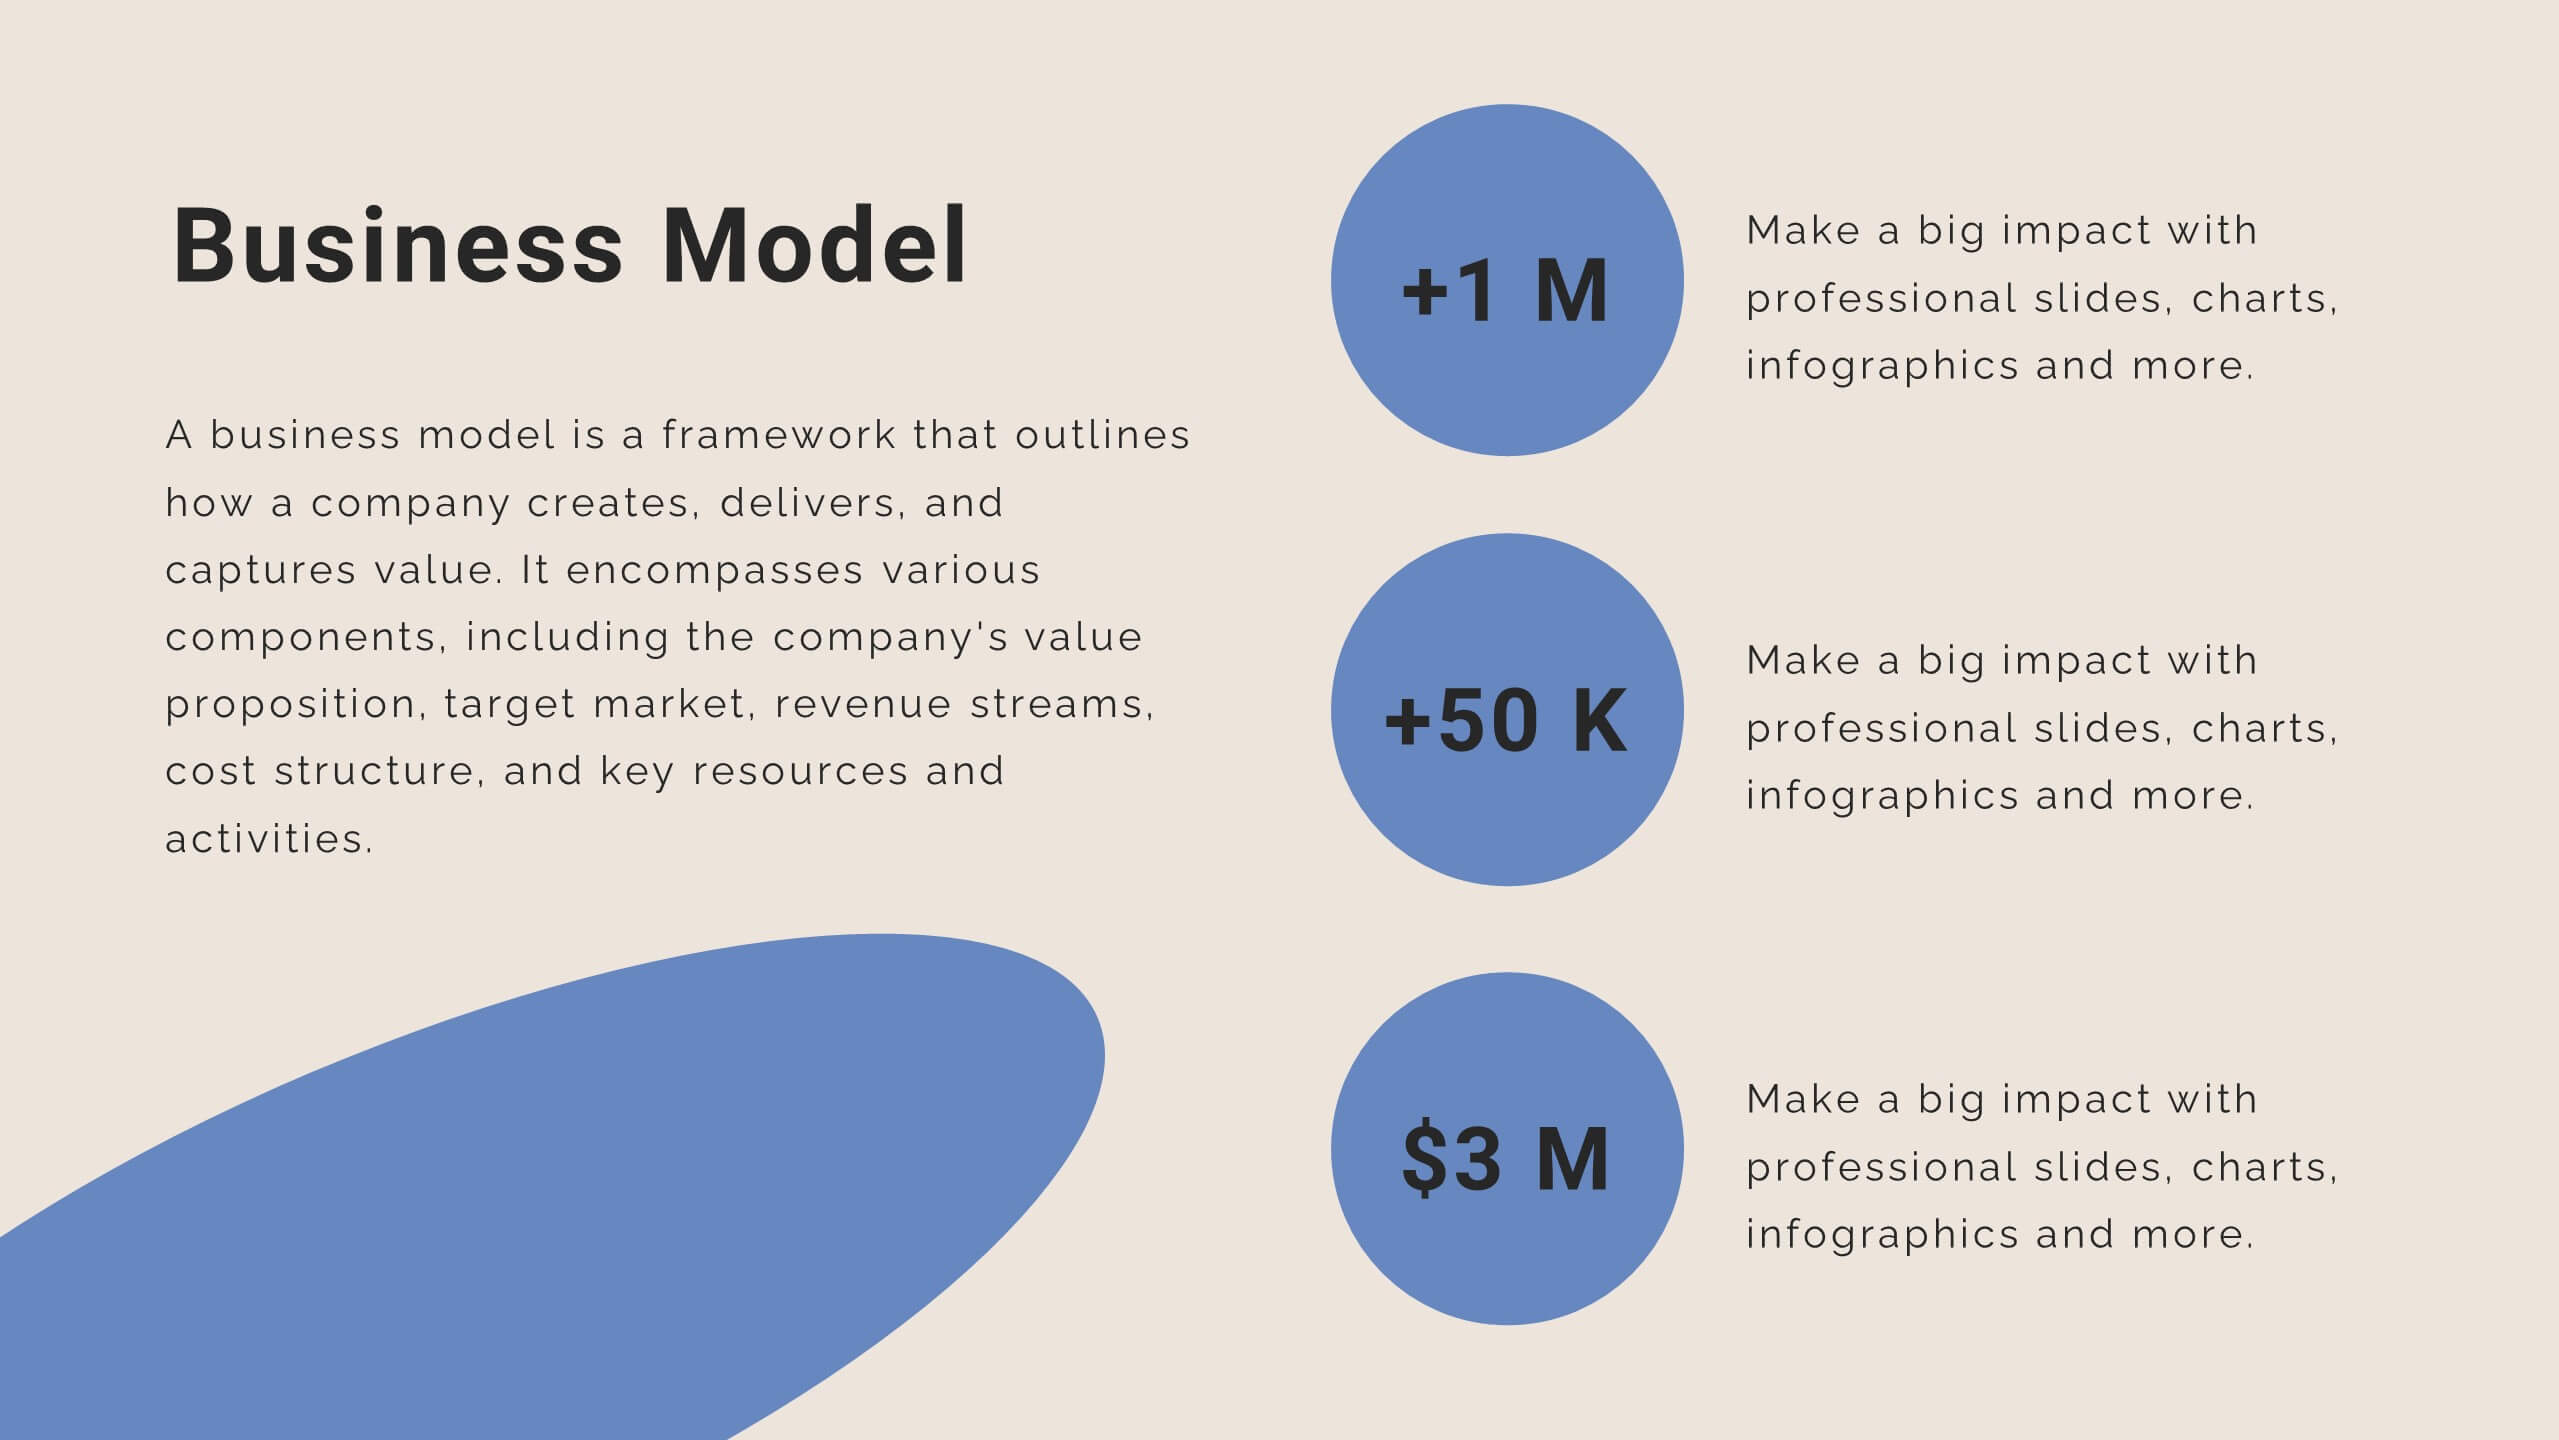
Revenue and Cost Breakdown Presentation
Present your financial insights with clarity using this 4-point revenue and cost analysis layout. Ideal for summarizing earnings, expenses, or budget comparisons. The circular icon design keeps information clean and engaging. Fully customizable in Canva, PowerPoint, or Google Slides to fit your brand’s data and presentation needs.
20 slides
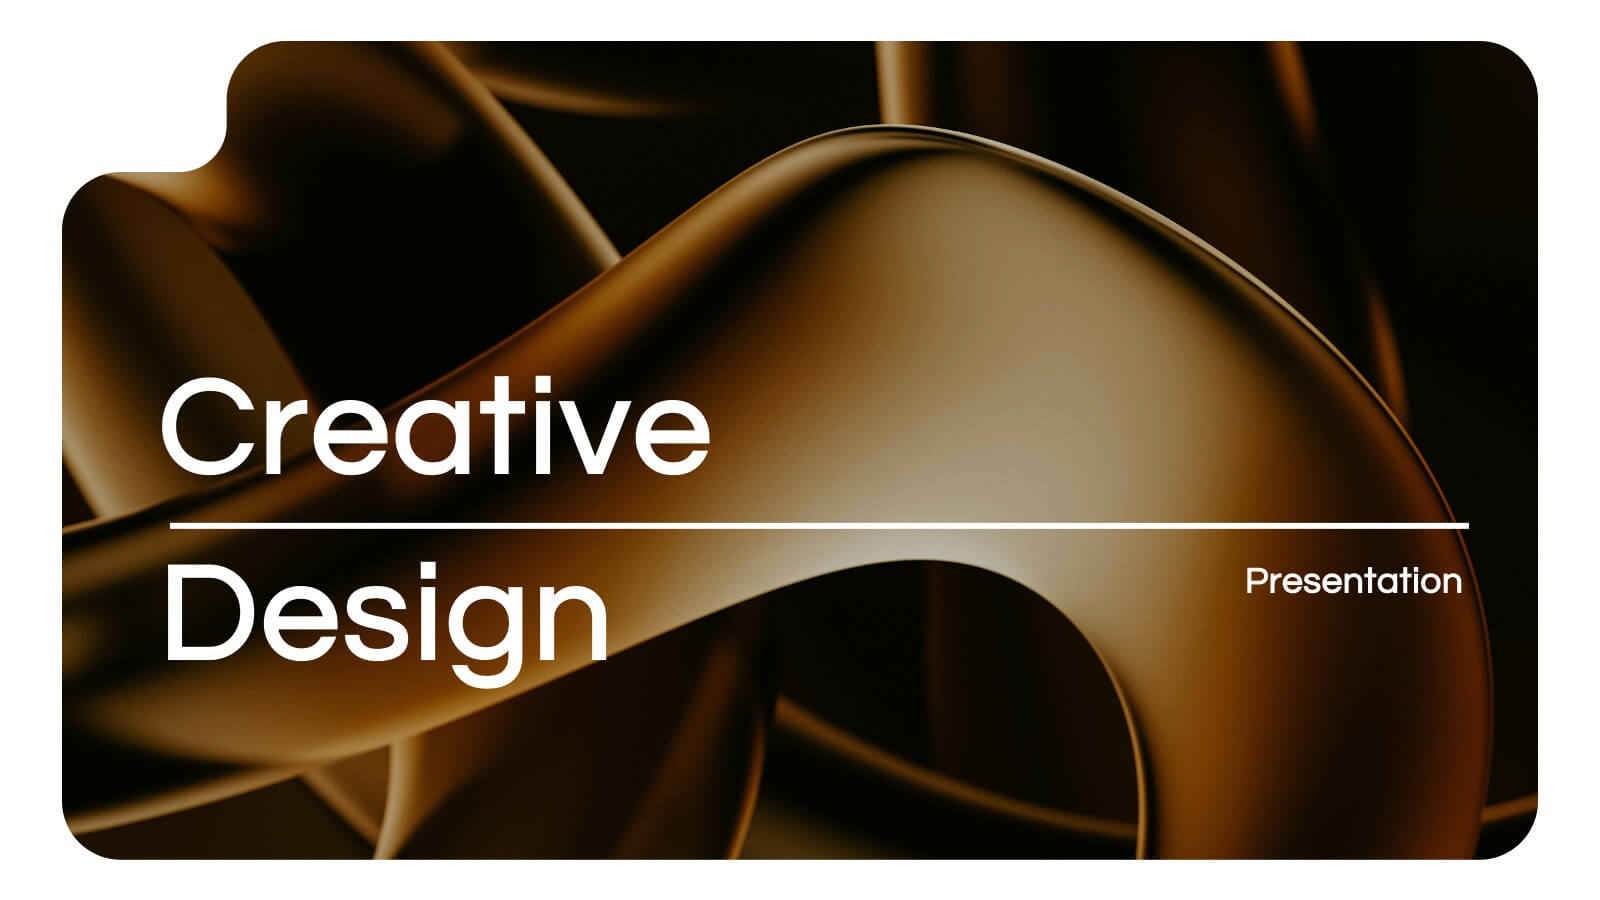
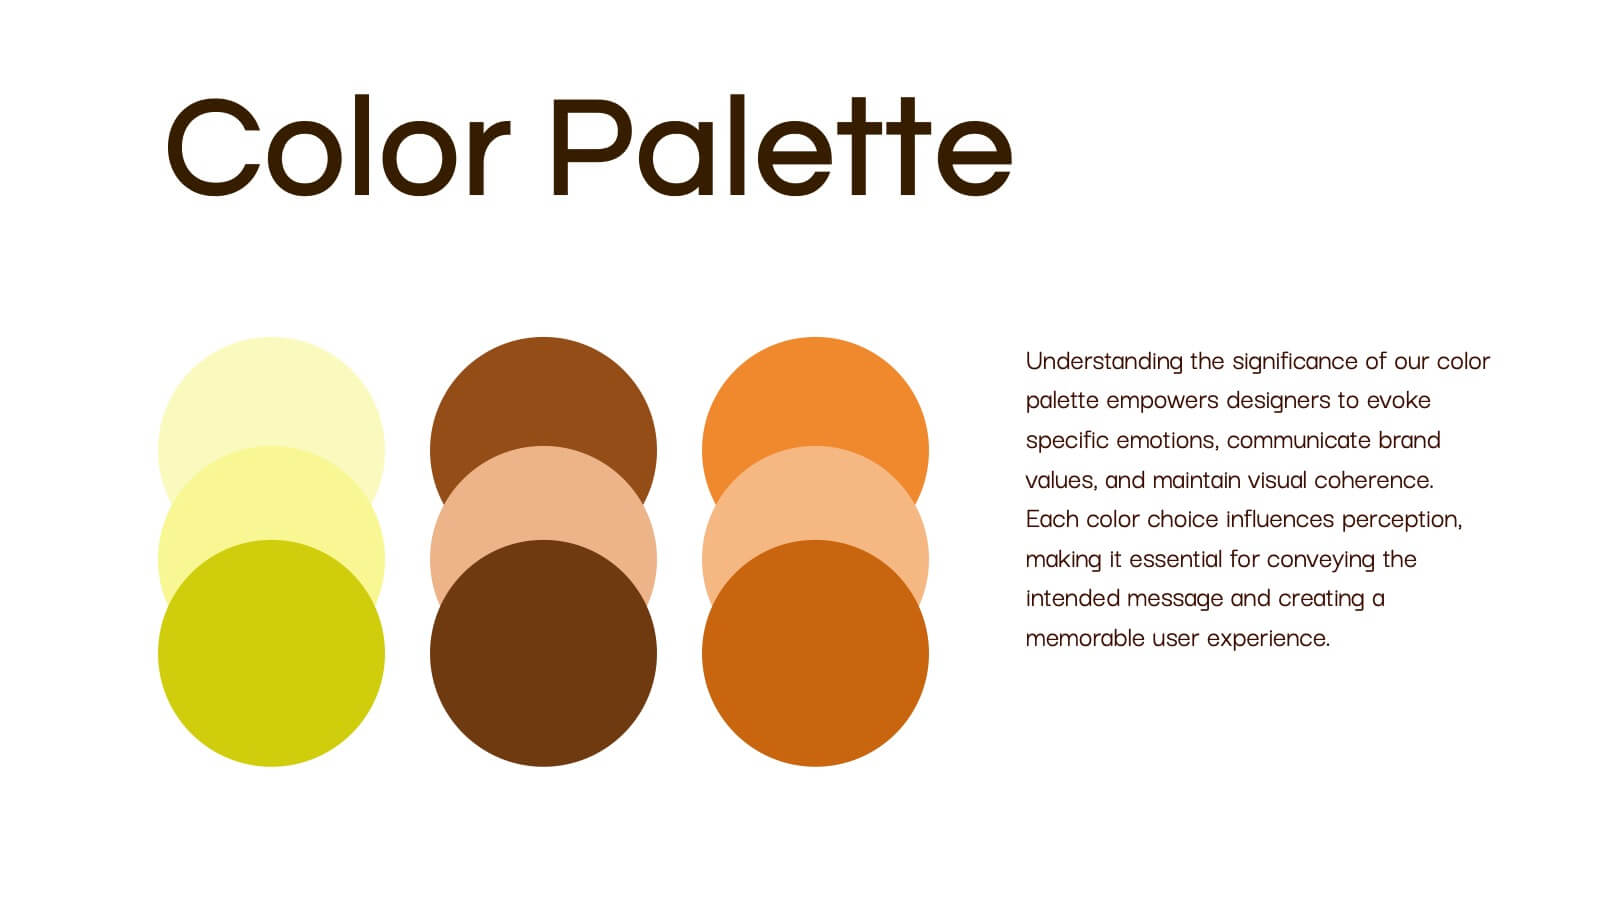
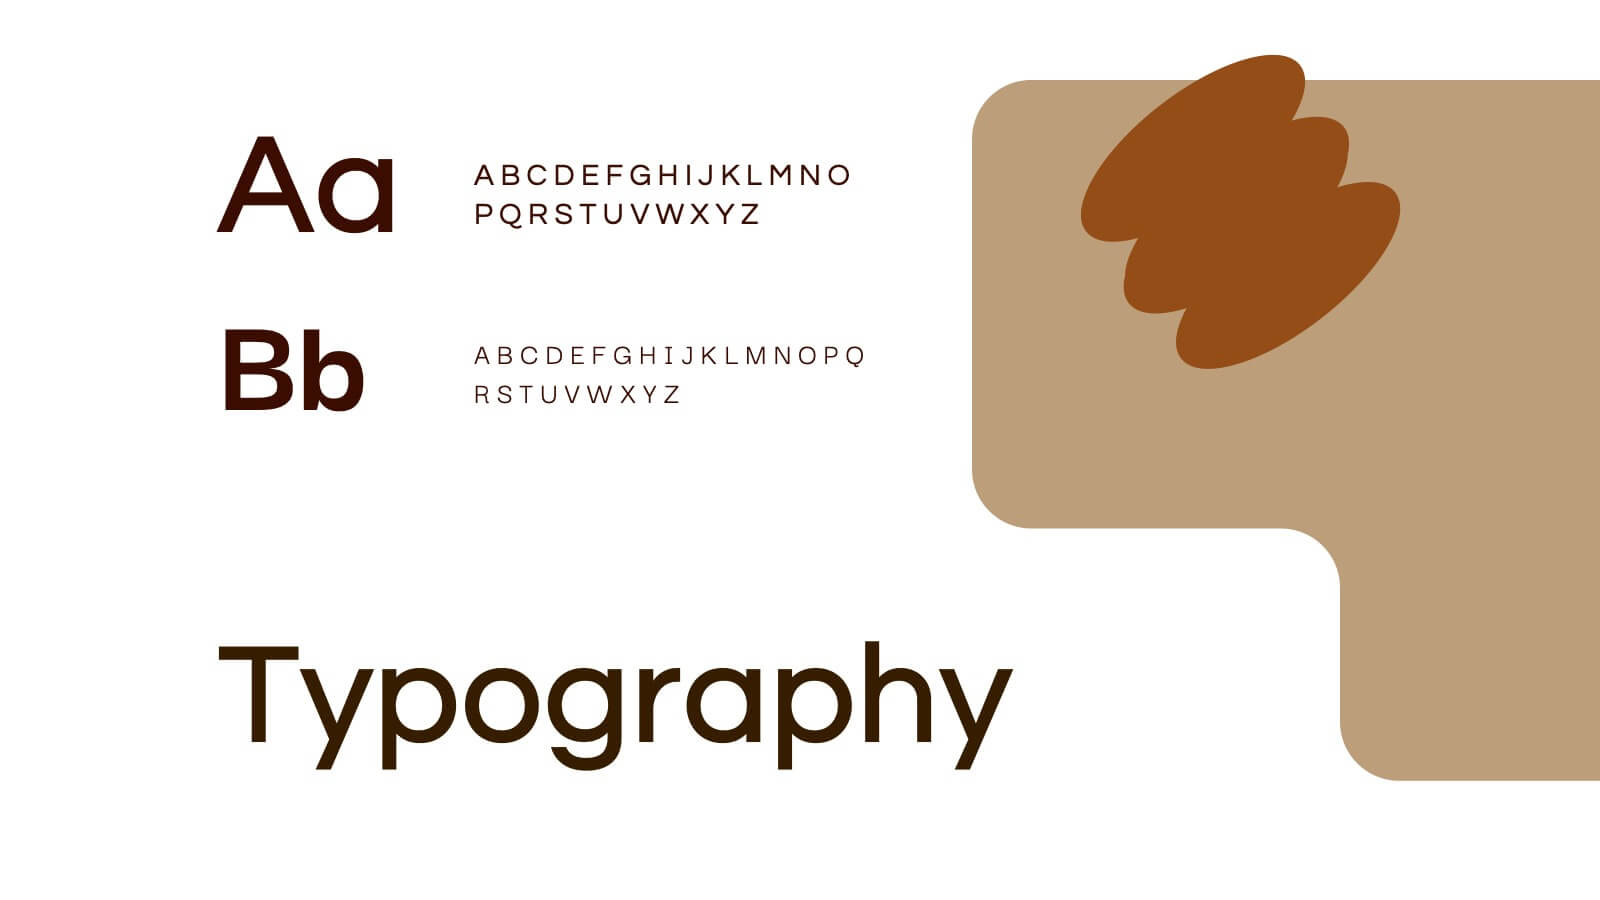
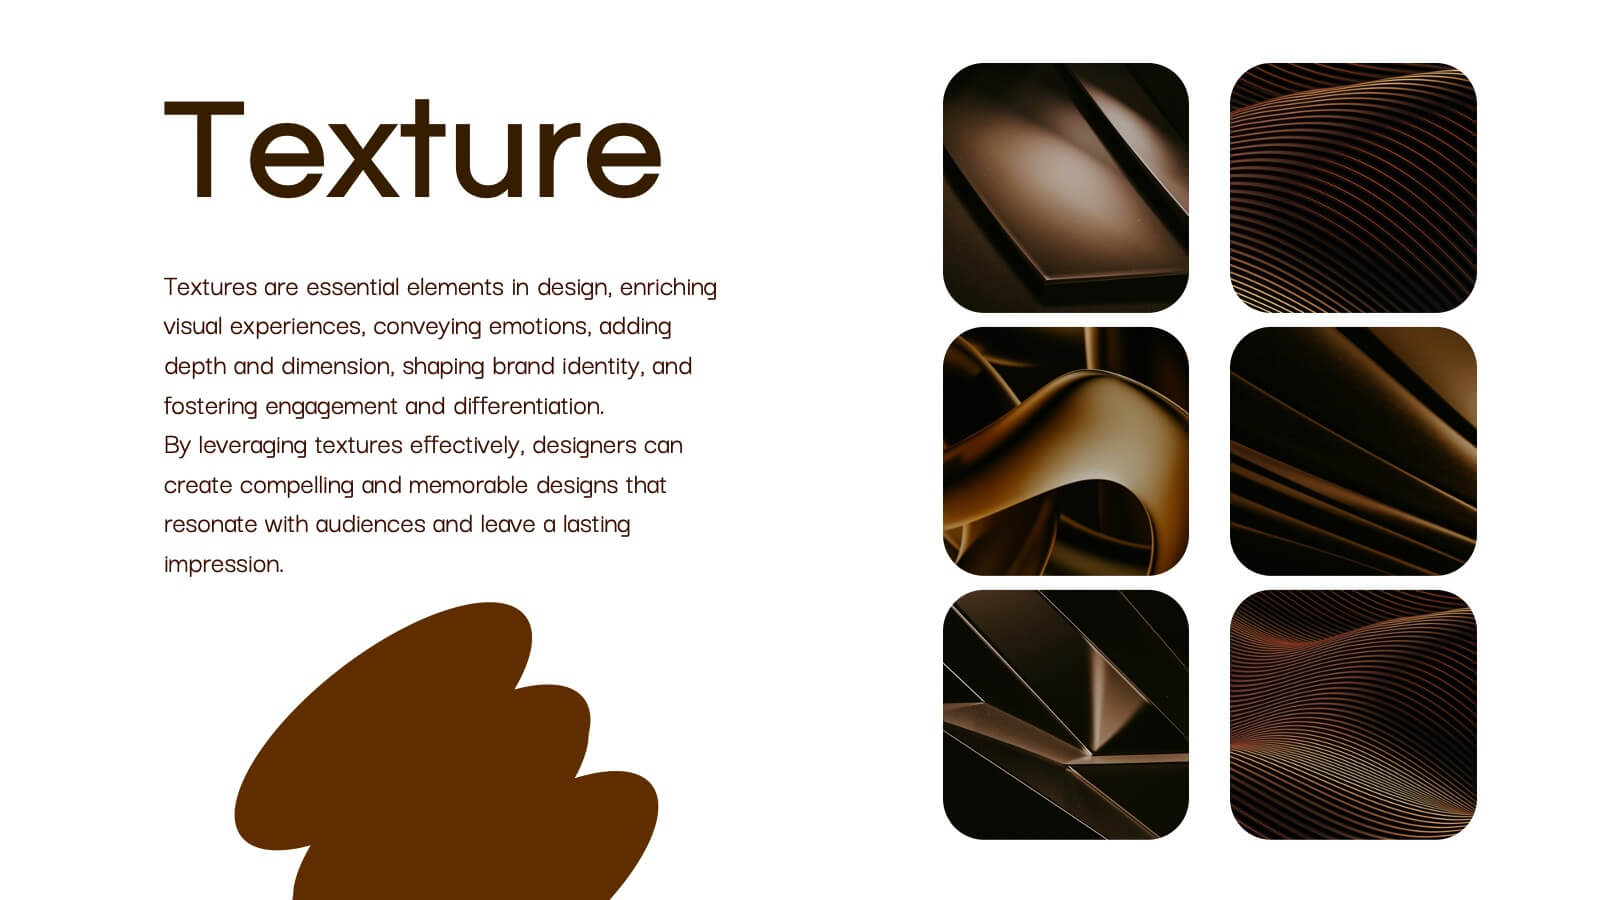
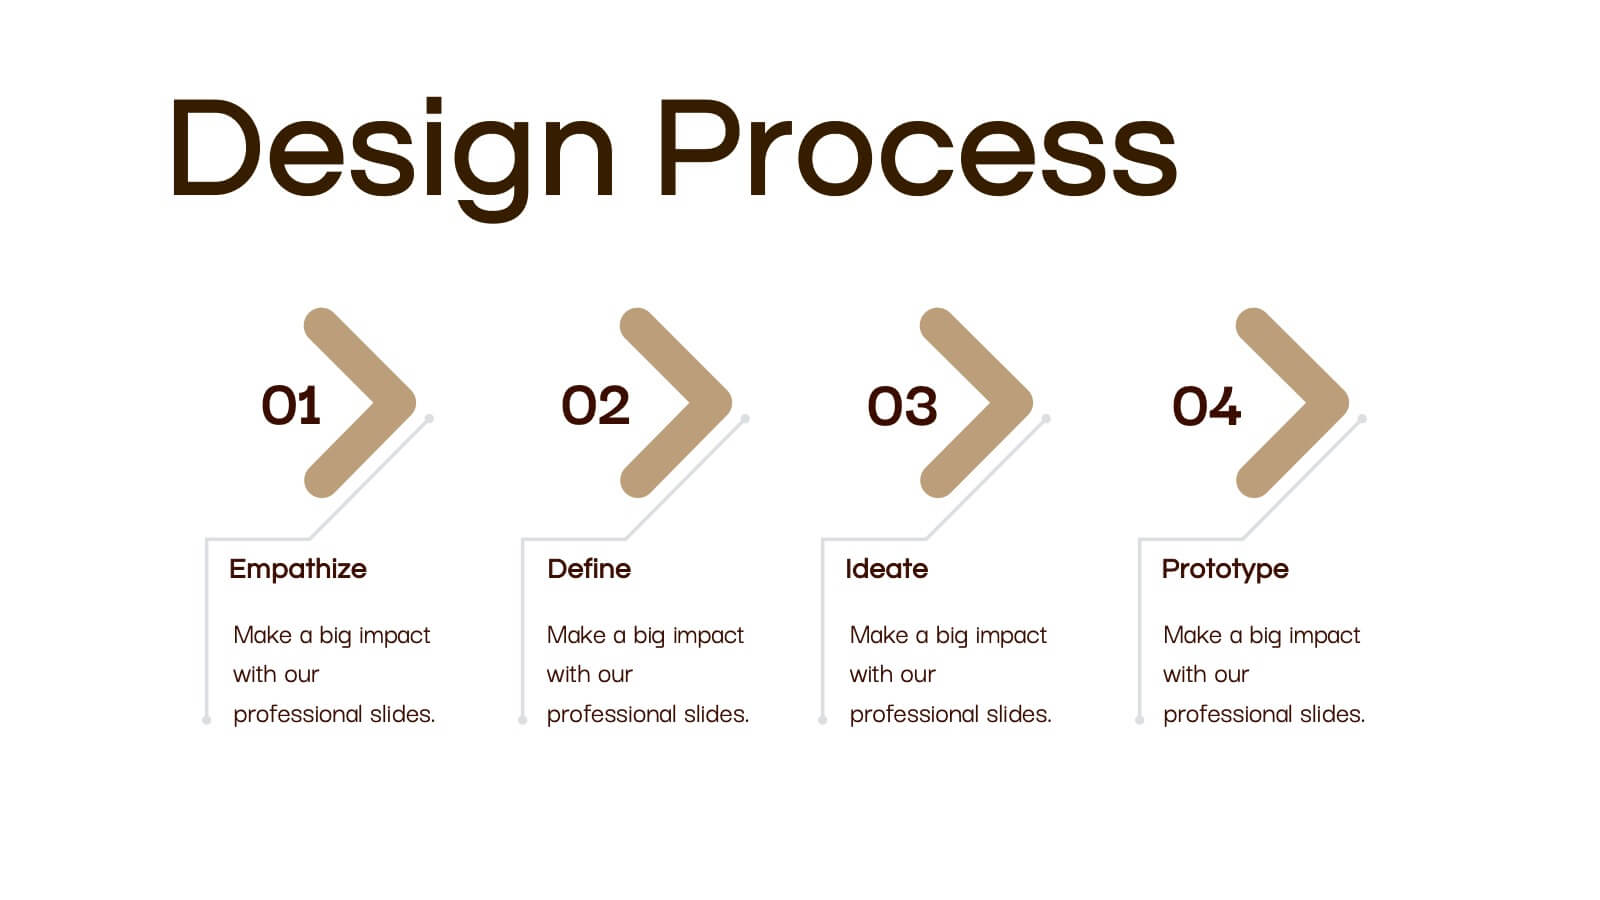
Obsidian Creative Design Report Presentation
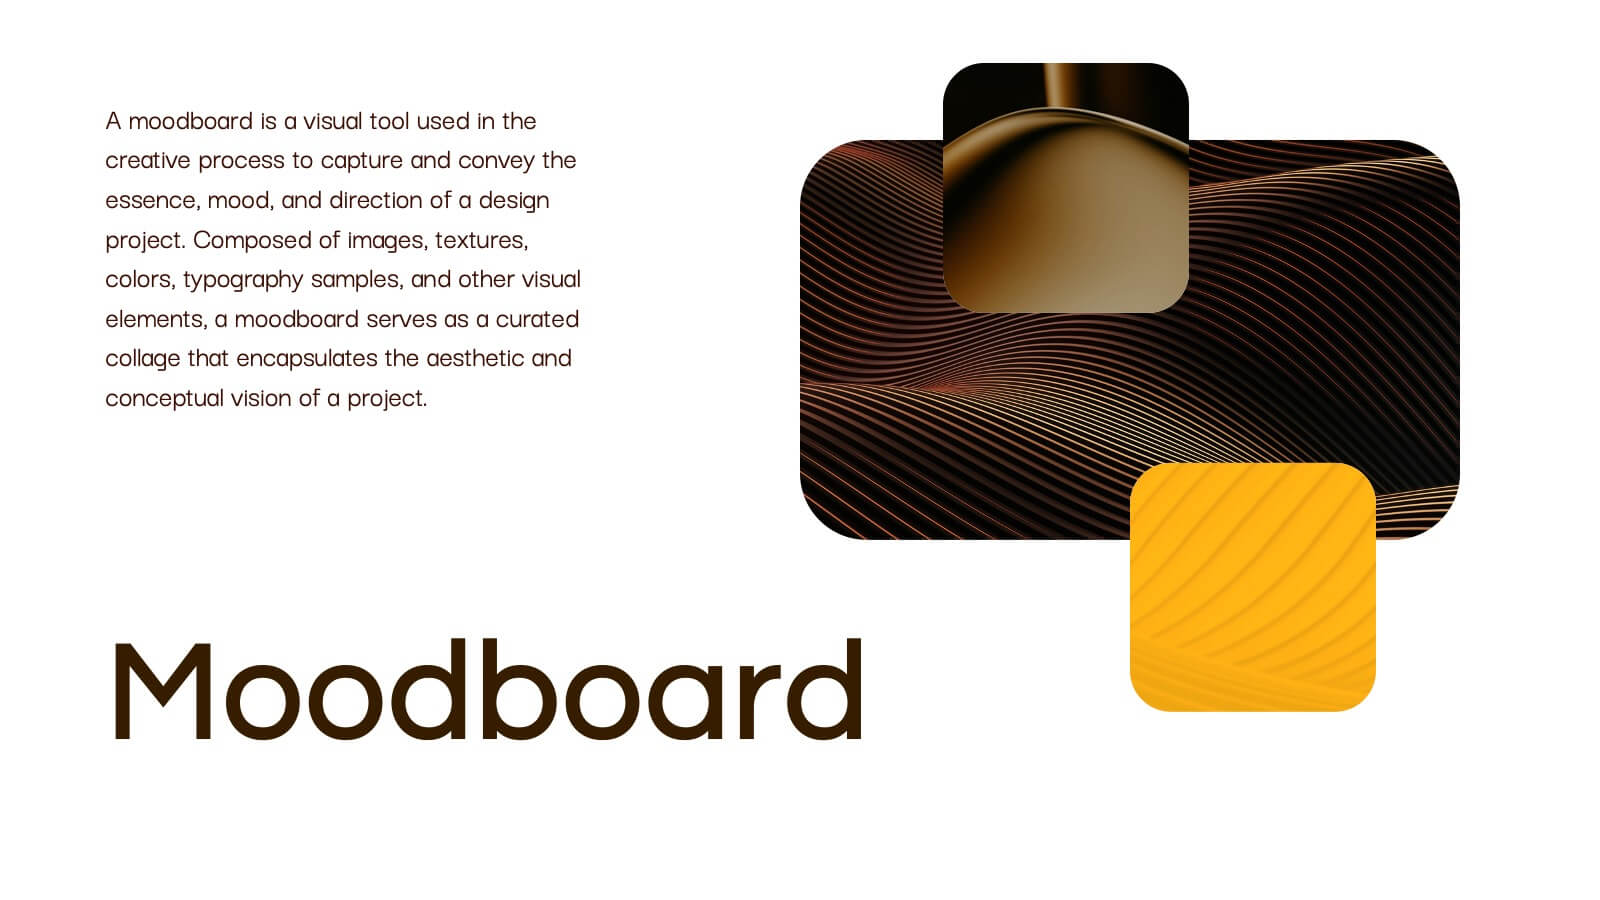
Bring your creative vision to life with this stunning design presentation template! Perfect for showcasing your design process, from concept development and mood boards to typography and final assets. Ideal for creative professionals, this template offers clarity and style at every step. Compatible with PowerPoint, Keynote, and Google Slides, it’s your ultimate tool for design presentations.


6 slides
Project Proposal Timeline Infographic
Effectively manage and present the timelines of your projects with our Project Proposal Timeline Templates. Designed for clarity and impact, these templates aid project managers, planners, and coordinators in outlining the key milestones and phases of projects, ensuring all stakeholders are aligned with the project schedule. Each slide in the collection features a streamlined design, utilizing shades of green to emphasize different stages and important dates. The templates are equipped with intuitive layouts that include Gantt charts, timelines, and lists, making it easy to visualize the sequence of activities, dependencies, and deadlines. Customizable for various types of projects, these timeline slides allow for detailed specifications, enabling you to adjust durations, update tasks, and refine objectives as your project evolves. Whether used for internal planning or external presentations, these templates help convey your project's scope and schedule in a professional and easily understandable manner.


10 slides
Results-Oriented Strategy Solutions Presentation
Drive your message home with the Results-Oriented Strategy Solutions Presentation. This layout features a presenter and chart graphic to emphasize goal tracking, performance analysis, and strategic actions. Perfect for business updates, KPIs, or coaching sessions. Fully customizable for PowerPoint, Keynote, and Google Slides.


26 slides
Agile Project Management Presentation
Elevate your project management approach with our Agile Project Management presentation template. Compatible with PowerPoint, Keynote, and Google Slides, it's designed to adapt to any presentation environment effortlessly. Ideal for project managers, team leaders, and agile enthusiasts, this template is engineered to illustrate the flexibility and efficiency of agile methodologies in project execution. Our Agile Project Management template is a powerful tool for demonstrating the benefits of agile processes, including increased adaptability, improved stakeholder engagement, and enhanced product quality. With a series of well-organized slides, it guides you through the agile journey, from project inception to completion. The template offers a diverse range of slides that cover all facets of agile project management, including sprint planning, daily stand-ups, and retrospectives. This template is not just visually appealing but also rich in content, providing ample space to detail out roles, responsibilities, and timelines. It ensures that your team and stakeholders are aligned with the project goals, making complex information accessible and understandable. Unlock the potential of your projects with this SEO-optimized template, and become the go-to source for agile project management strategies.


8 slides
Value Chain Optimization and Analysis Presentation
Streamline Your Business for Maximum Efficiency with this Value Chain Optimization and Analysis presentation template. This visually engaging template is designed to map, analyze, and enhance the key activities in your value chain, helping businesses identify opportunities for cost reduction, performance improvements, and strategic advantages. Featuring a clean flowchart layout, intuitive color-coded sections, and editable placeholders, this template is ideal for business analysts, consultants, and executives. Fully compatible with PowerPoint, Keynote, and Google Slides, ensuring seamless customization and professional delivery.


6 slides
Simple Horizontal Timeline Design Presentation
Bring your story to life with a smooth, step-by-step visual that guides viewers through key events with clarity and ease. This presentation helps you outline timelines, processes, or project stages in a clean horizontal flow that’s simple to follow and easy to customize. Fully compatible with PowerPoint, Keynote, and Google Slides.


6 slides
Ideas Connection Venn Presentation Design
Present interconnected ideas with creativity and impact using the Ideas Connection Venn Presentation Design. This colorful, lightbulb-themed 5-section layout helps you visualize related concepts or stages, ideal for brainstorming, innovation mapping, or content planning. Each segment includes icons, titles, and descriptions to showcase your thoughts clearly. Fully customizable in PowerPoint, Keynote, and Google Slides.