


Features
- 6 Unique slides
- Fully editable and easy to edit in Microsoft Powerpoint, Keynote and Google Slides
- 16:9 widescreen layout
- Clean and professional designs
- Export to JPG, PDF or send by email


Do you have any questions?
Recommend


7 slides
Online Marketing Plan Presentation
Turn your digital strategy into a story worth sharing with this clean, modern layout designed to showcase marketing goals, channels, and performance insights. Ideal for planning campaigns or presenting analytics, it keeps content structured and engaging. Fully editable and compatible with PowerPoint, Keynote, and Google Slides for easy customization.


7 slides
Enterprise Security Infographic
In today's digital age, enterprise security has become the bedrock of business operations, ensuring data integrity and protection from threats. Our enterprise security infographic encapsulates key aspects of this vital domain, harmoniously blending white, blue, and hints of yellow. It's an essential visual tool for IT professionals, cybersecurity experts, and corporate strategists, illustrating the multifaceted nature of modern security protocols. Tailored to seamlessly integrate with PowerPoint, Keynote, and Google Slides, this infographic is your go-to resource for conveying complex security concepts in a digestible format.


7 slides
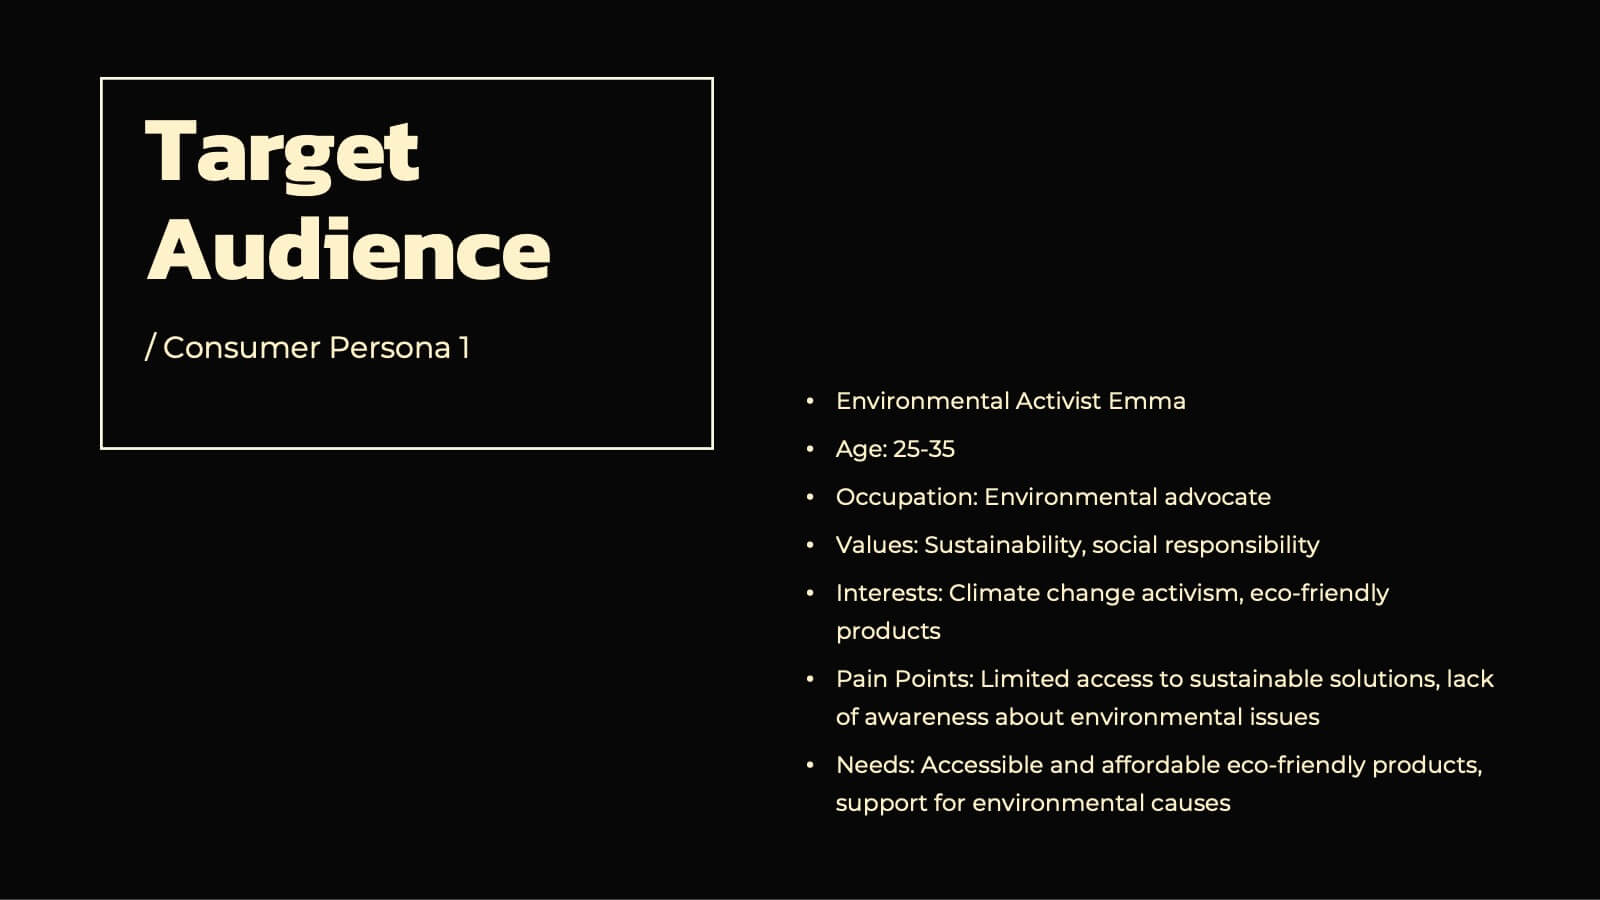
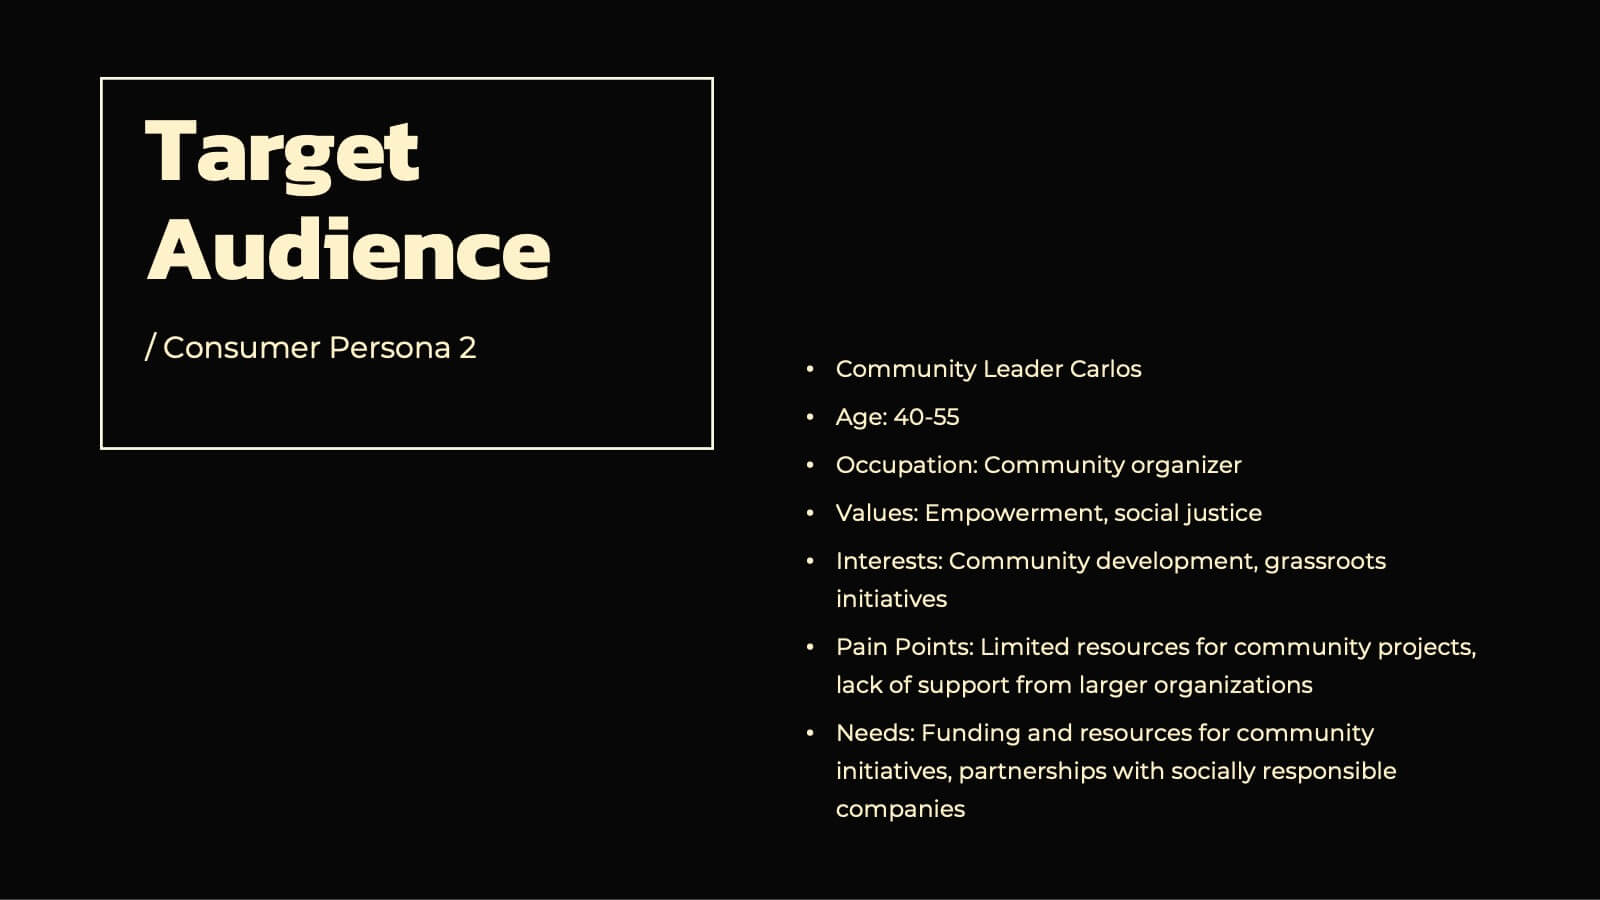
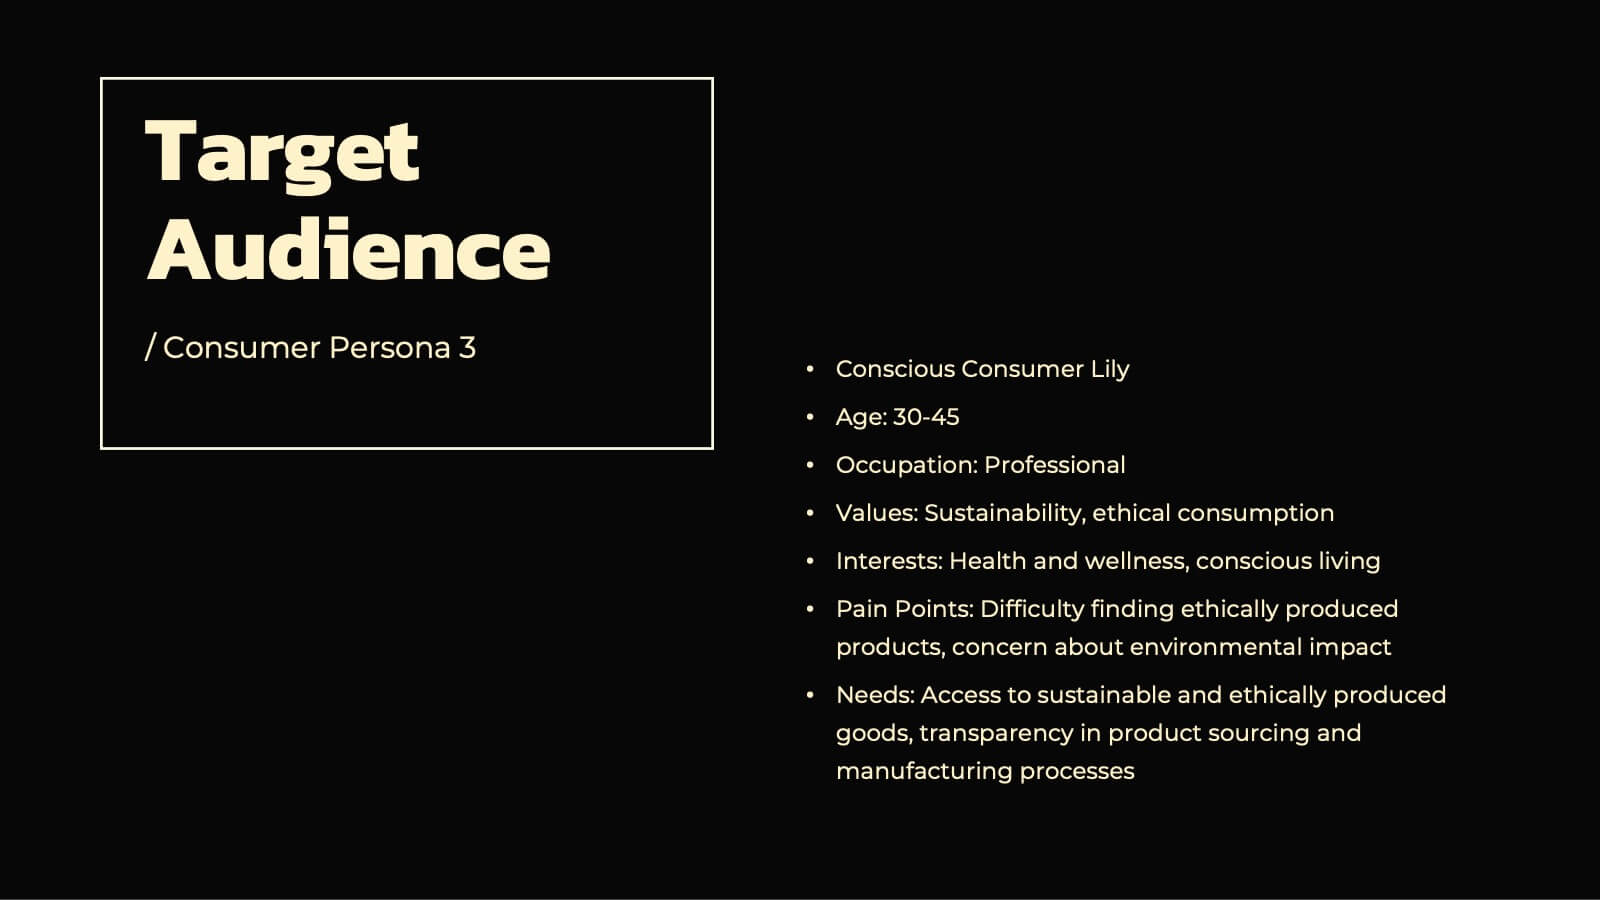
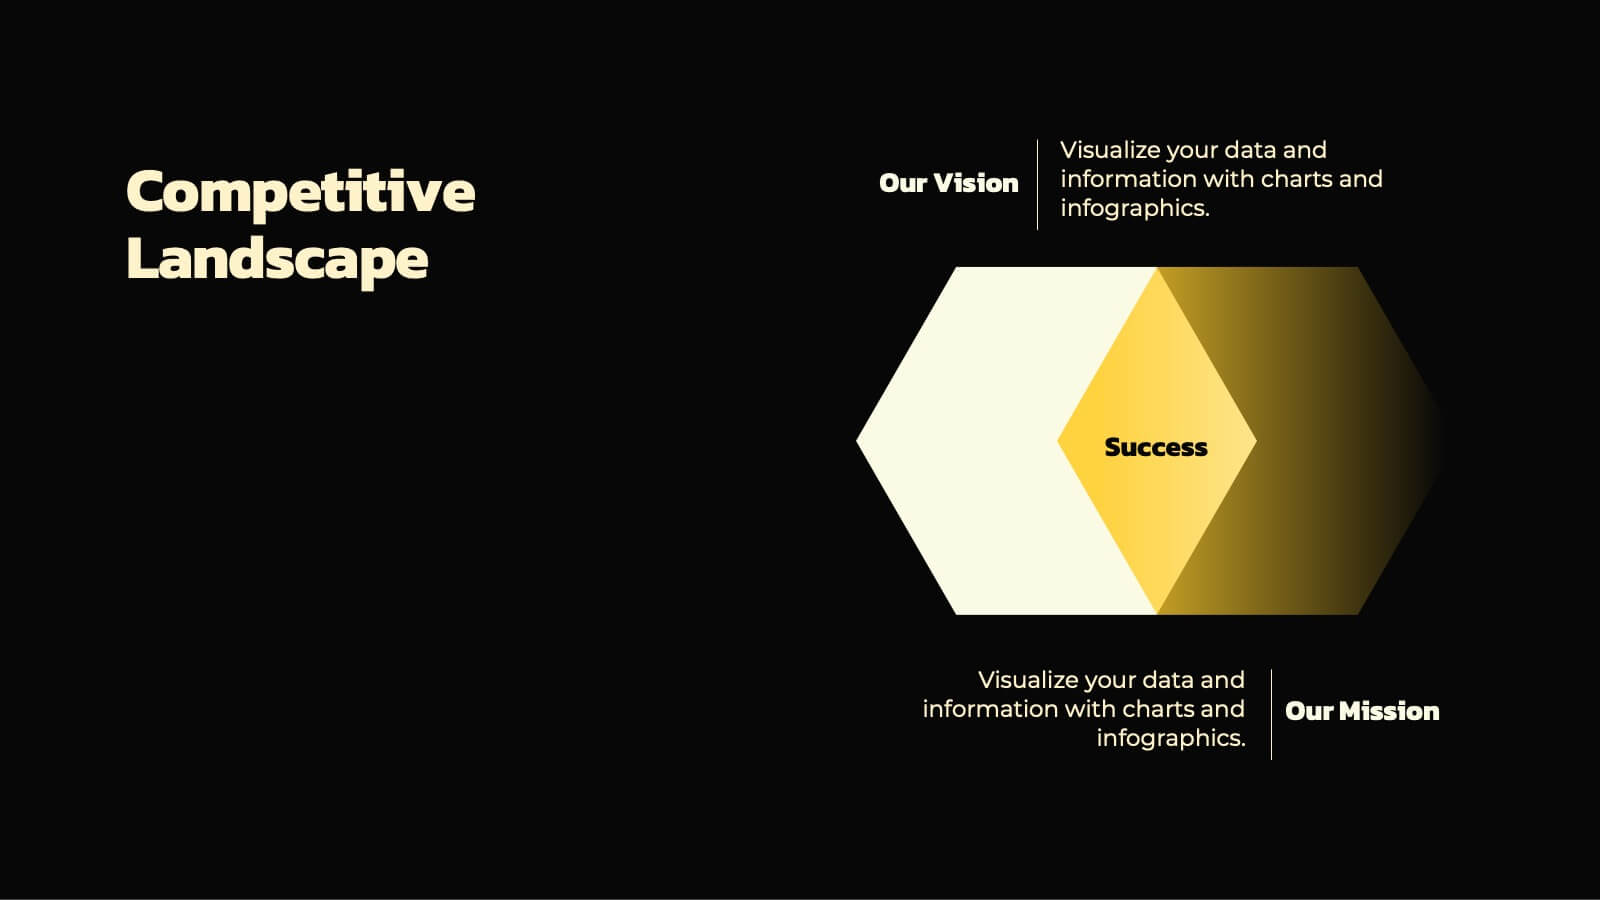
Buyer Persona Guide Infographic
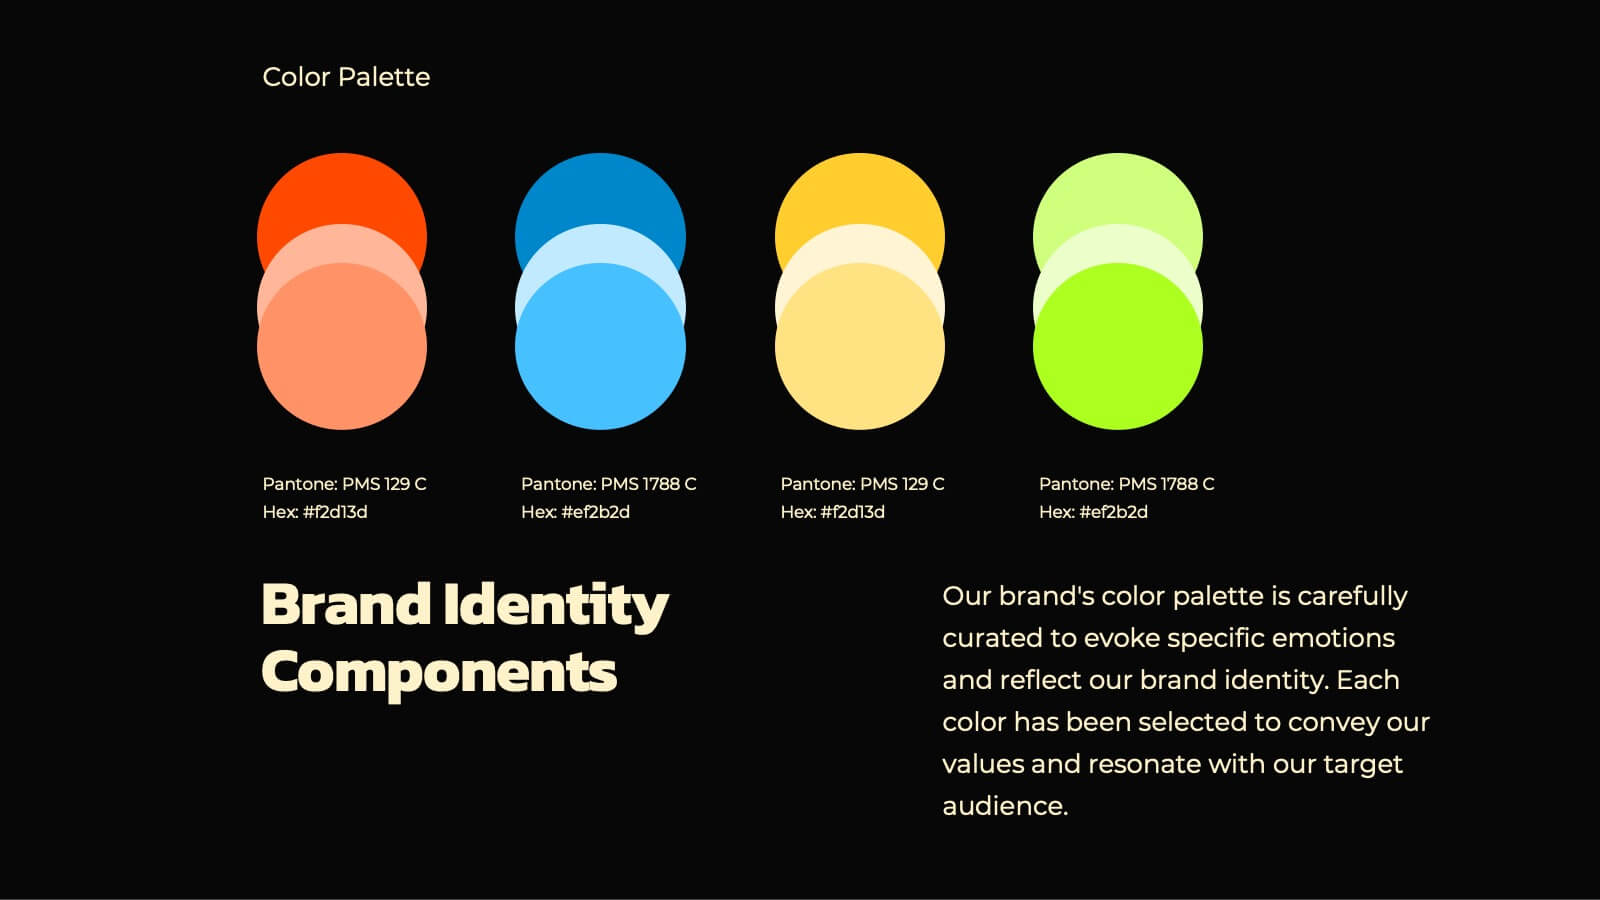
Elevate your marketing strategy with our Buyer Persona Guide Infographic Template, designed to distill complex customer data into stunning, easy-to-understand visual profiles. This template is a canvas for creativity, allowing marketers to paint detailed portraits of their ideal customers using a mix of vibrant colors, engaging layouts, and succinct text. Craft each persona with care, detailing demographics, preferences, behaviors, and needs, all laid out in an aesthetically pleasing format that makes data pop off the page. Whether you're presenting to stakeholders, guiding your content strategy, or training your sales team, these visuals serve as your roadmap to deeper customer connections. Fully customizable to reflect your brand's unique voice and style, this template adapts seamlessly to your needs, ensuring that every insight into your audience is not just informative but also visually captivating. It's an essential tool for anyone looking to enhance their understanding of their market and refine their approach to meet customer demands.


6 slides
7S Framework for Organizational Alignment Presentation
Present a cohesive organizational strategy using the 7S Framework slide. With hexagonal visuals highlighting key elements—Strategy, Structure, Systems, Shared Values, Style, Staff, and Skills—this template simplifies complex alignment concepts. Ideal for leadership, consulting, or HR presentations. Fully editable for PowerPoint, Google Slides, and Keynote to match your brand.


6 slides
Startup Unicorn Infographic
A "startup slide" usually refers to a slide within a presentation, often a pitch deck, that introduces and provides key information about a startup company. The purpose of this Startup Slide Infographic is to deliver a concise overview of the startup's value proposition and key information. Capturing the audience's attention and conveying essential details about the startup's mission and market opportunity. This can be used in presentations or marketing materials. This infographic design is clean, visually engaging, and easy to understand at a glance. Fully customizable and compatible with Powerpoint, Keynote, and Google Slides.


6 slides
Business Plan Steps Infographic
A business plan is a written document that outlines the goals, strategies, and financial projections of a business. This infographic template is designed to serves as a roadmap for the organization, providing a comprehensive overview of how the business will operate and achieve its objectives. This infographic outlines the key steps involved in creating a comprehensive business plan. The template provides tips on presenting the business plan in a professional and visually appealing manner. It incorporates visuals to support key points, and organizing the document with headings, subheadings, and bullet points for readability.


6 slides
Roadmap Milestones Infographic
Chart your project's progress with our Roadmap Milestones Infographic, optimized for Powerpoint, Google Slides, and Keynote. This infographic is expertly designed to visualize the journey of your project from conception to completion. The roadmap's layout is intuitive and user-friendly, making it simple to customize with your specific project stages, timeframes, and critical tasks. Whether you're outlining a new business initiative, or planning an event, this template helps you lay out a path to success that your team can follow. With this Roadmap infographic, you can keep stakeholders informed and your team aligned on the project's goals and progress.


21 slides
Goldenshadow Professional Portfolio Showcase Presentation
A refined portfolio presentation template crafted to highlight professional achievements and expertise. Showcase featured projects, collaborations, and client testimonials with a sleek, modern design. Includes sections for services offered, awards, pricing, and contact information. Fully customizable and compatible with PowerPoint, Keynote, and Google Slides for impactful portfolio presentations.


27 slides
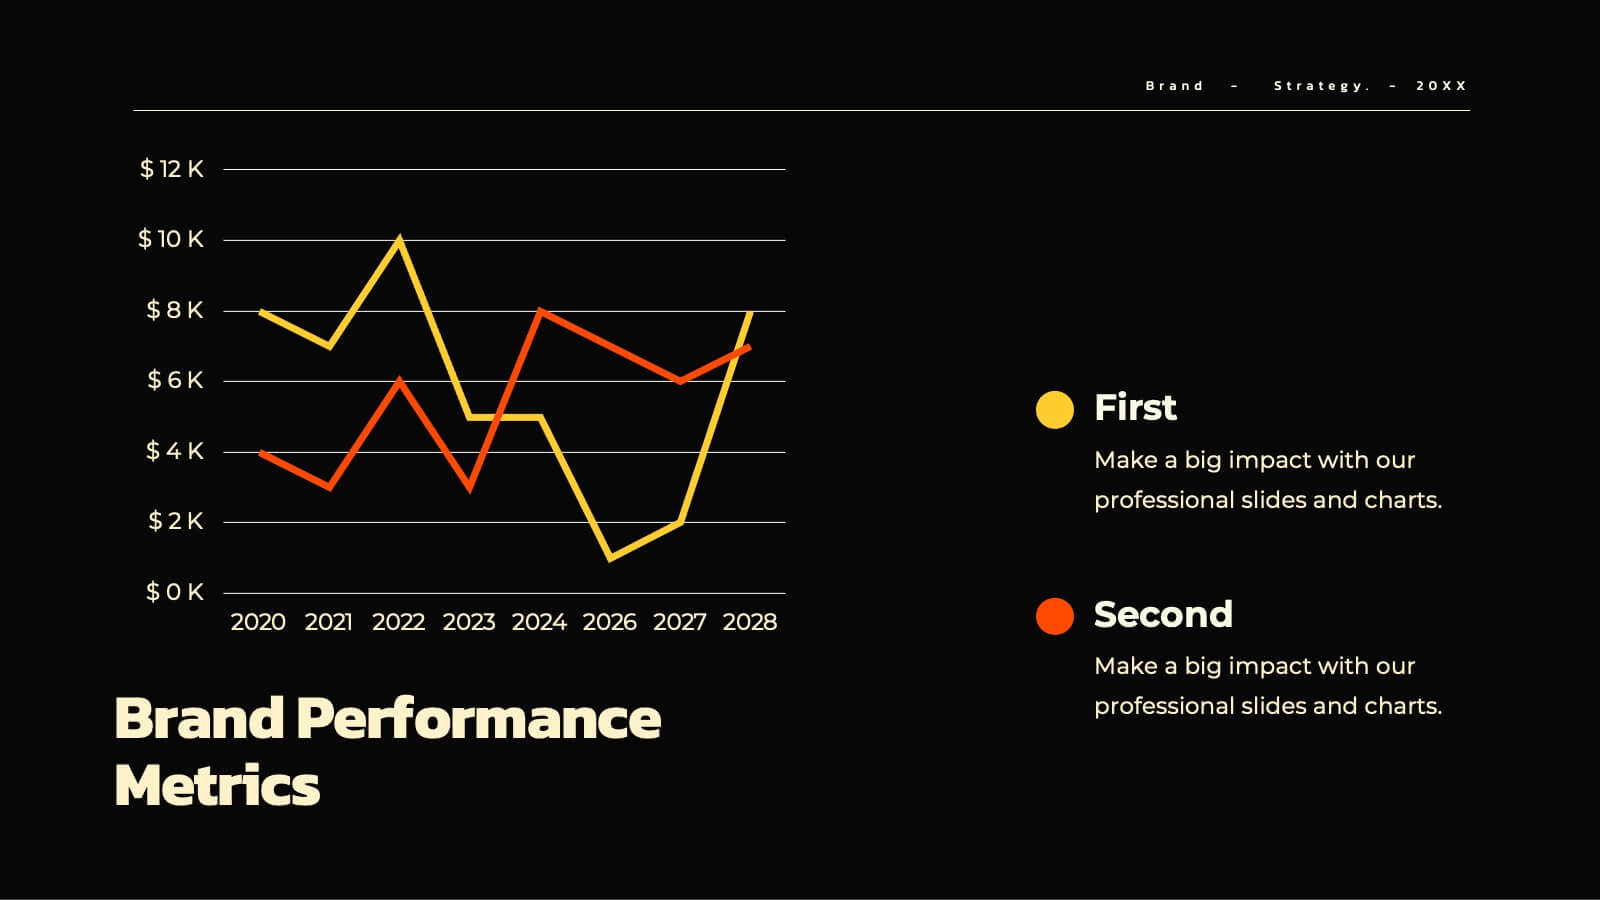
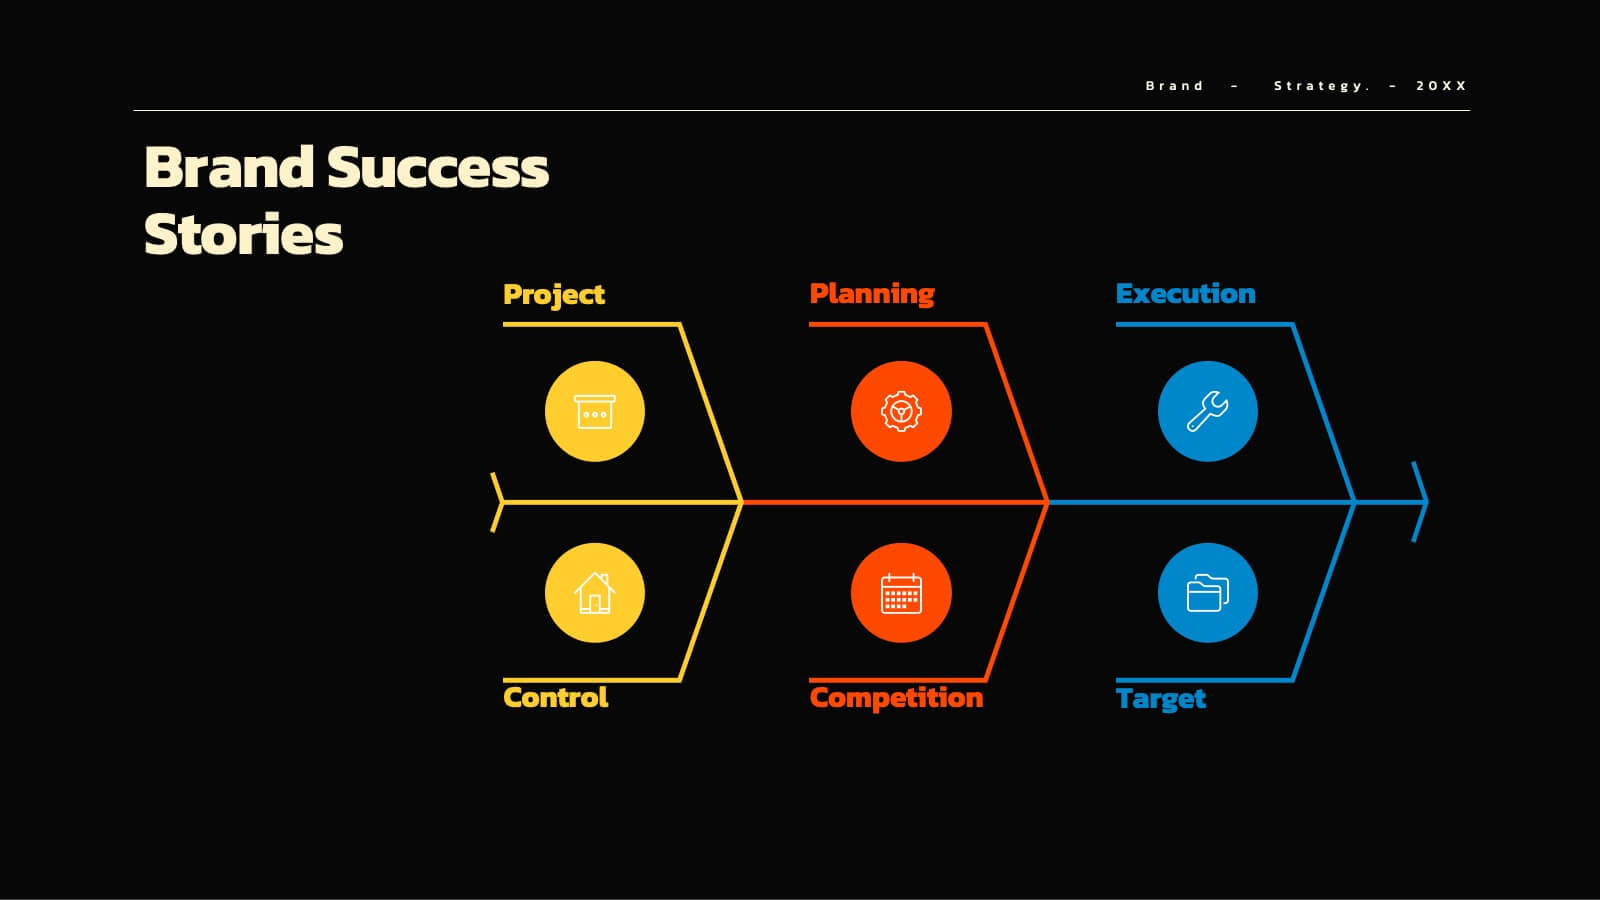
Aqua Brand Strategy Report Presentation
Make waves with this fresh, aqua-inspired presentation template, perfect for delivering a standout brand strategy report! Designed to help you showcase your brand's vision, market positioning, and strategic goals, it features a clean, modern layout that grabs attention. Compatible with PowerPoint, Keynote, and Google Slides for effortless customization.


6 slides
5-Stage Workflow Presentation
Turn complex processes into clear, visual stories with this structured step-by-step layout. Ideal for showcasing project stages, workflows, or development phases, it guides your audience through each milestone with precision and flow. Fully editable and compatible with PowerPoint, Keynote, and Google Slides for easy customization and professional results.


5 slides
Poaching Effects Infographics
Navigate the critical issue of wildlife endangerment with our poaching effects infographics. Crafted in earthy tones of brown and tan, this informative and creatively styled vertical template sheds light on the harsh realities of illegal wildlife hunting. Whether you're an environmental activist, an educator, or part of an ecological research team, this infographic is structured to resonate with your audience, offering compelling visuals and thematic icons that starkly represent the consequences of poaching. It's more than a presentation; it's a call to global action, crucial for anyone advocating for wildlife preservation and aiming to inspire change through storytelling.


20 slides
Pegasus Sales Forecast Presentation
This bold sales forecast template combines powerful visuals with a sleek design to highlight key performance metrics, competitive analysis, and pricing strategy. With sections for service overview, testimonials, promotions, and next steps, it’s ideal for impactful presentations. Compatible with PowerPoint, Keynote, and Google Slides, delivering your message has never been easier.


20 slides
Cometis Small Business Pitch Deck Presentation
Introduce your business effectively with this pitch deck template, crafted for small businesses seeking impactful presentations. From company overview to objectives and strategies, this design is tailored to highlight your key messages. Dive into sections such as business highlights, team introductions, and future goals while maintaining a professional flow. This template includes callout slides, break announcements, and customizable placeholders for your brand visuals and content. Ideal for pitching ideas to stakeholders or presenting at workshops, it ensures clarity and engagement. Compatible with PowerPoint, Google Slides, and Keynote, it offers flexibility across platforms.


26 slides
Workouts for Every Body Part Presentation
Achieve total-body fitness with this dynamic presentation on targeted workouts for every muscle group. Covering effective exercises, proper form, strength training techniques, and workout plans, this template helps simplify fitness routines for all levels. Fully customizable and compatible with PowerPoint, Keynote, and Google Slides for a seamless and engaging presentation experience.


6 slides
5G Technology Rollout and Future Vision Presentation
From 1G to 5G, tell the story of progress with this visually engaging infographic slide. Perfect for showcasing mobile network evolution, telecom innovation, or digital transformation strategies, each stage is clearly marked for simple, informative storytelling. Fully compatible with PowerPoint, Keynote, and Google Slides for easy editing and seamless presentation.


6 slides
Platform-Specific Social Strategy Presentation
Break down your marketing approach by channel using this clear, platform-focused timeline. Highlight strategies for TikTok, Facebook, Instagram, X, and email in a linear, easy-to-read format. Ideal for digital marketers, content teams, and social media managers. Fully editable in PowerPoint, Keynote, and Google Slides to match your brand and strategy.


2 slides
Modern Business Cover Slide Presentation
Stand out with this bold and contemporary cover slide. The layout features dynamic geometric shapes and an integrated photo section, perfect for making a memorable first impression. Whether you're presenting to clients or stakeholders, this slide combines style and structure to deliver your brand message clearly. Fully customizable and easy to edit in PowerPoint, Keynote, and Google Slides.