


Features
- 4 Unique slides
- Fully editable and easy to edit in Microsoft Powerpoint, Keynote and Google Slides
- 16:9 widescreen layout
- Clean and professional designs
- Export to JPG, PDF or send by email


Do you have any questions?
Recommend


6 slides
Real Estate Housing Solutions Presentation
Present property features and real estate plans with this creative multi-level housing diagram. Designed for agents, developers, or housing consultants, this layout clearly segments space usage or service offerings. Fully customizable in PowerPoint, Keynote, and Google Slides—perfect for showcasing floor plans, room functions, or housing solutions with vibrant clarity.


7 slides
Breast Cancer Stages Infographic
The Breast Cancer Stages infographic template is designed to educate and inform about the different stages of breast cancer in a visually engaging and clear manner. The template, compatible with PowerPoint, Google Slides, and Keynote, features a variety of diagram styles such as percentage charts, stage progressions, and anatomical illustrations. It uses a soft color palette of pinks and whites, which is sympathetic to the subject matter. Each slide is carefully constructed to convey essential information about the stages of breast cancer, recommended screenings, and treatment methods. This template is an excellent resource for healthcare professionals, and advocacy groups looking to raise awareness and provide education on breast cancer.


6 slides
Workforce Development Strategy Presentation
Enhance your workforce development strategies with our "Workforce Development Strategy Presentation" template. This infographic effectively displays essential workforce statistics and initiatives, organizing data into visually distinct segments for clarity. It covers various demographics and departmental roles, color-coded to differentiate data points like gender distribution and participation rates. Ideal for HR professionals and corporate trainers, this template supports strategic decisions in talent management and training. It simplifies complex information, making it accessible for all stakeholders. Compatible with PowerPoint, Keynote, and Google Slides, this template is essential for delivering impactful and strategic human resource presentations.


5 slides
Regional Sales Heatmap Presentation
Showcase performance by region with this Regional Sales Heatmap Presentation. This template highlights U.S. state-by-state sales data using gradient color coding and a clear legend system. Easily customizable for quarterly reports, territory analysis, or sales strategy reviews. Compatible with PowerPoint, Keynote, and Google Slides.


23 slides
Sunstone Investor Pitch Presentation
Captivate investors with this professionally crafted pitch deck, showcasing sections for company overview, problem and solution, market opportunity, revenue model, competitive landscape, and growth projections. Present your team, financials, milestones, and funding requirements effectively. Ideal for securing investment and support. Fully customizable for PowerPoint, Keynote, and Google Slides.


6 slides
Cloud Computing Basics Presentation
Bring clarity to the digital world with this sleek and modern template designed to explain online data systems and cloud structures. Perfect for showcasing storage models, connectivity, and IT workflows with simplicity and style. Fully editable and compatible with PowerPoint, Keynote, and Google Slides for seamless customization.


5 slides
3D Element Infographics for Impact Presentation
Add a bold visual twist to your data with the 3D Element Infographics for Impact Presentation. Featuring eye-catching 3D dice-style cubes, this template is perfect for showcasing four key concepts, comparisons, or stages. Ideal for business strategies, risk breakdowns, or decision-making visuals. Fully editable and compatible with PowerPoint, Keynote, and Google Slides.


4 slides
Career Onboarding 30 60 90 Day Presentation
Start strong with a clean, uplifting layout that makes each milestone in the onboarding journey feel clear, motivating, and easy to follow. This presentation helps you outline expectations, track early progress, and communicate development goals with confidence and clarity. Fully editable and compatible with PowerPoint, Keynote, and Google Slides.


24 slides
Business Strategy Presentation
Streamline your strategic planning with our Business Strategy presentation template. It covers SWOT analysis, market trends, competitive landscape, and strategic initiatives. Ideal for business planners and strategists, this template is compatible with PowerPoint, Keynote, and Google Slides, ensuring comprehensive support for your strategic presentations.
10 slides
Professional Business People Icons Presentation
The "Professional Business People Icons" presentation template offers a range of icons designed to represent business roles or activities visually. These slides are structured to incorporate iconography alongside text placeholders, allowing for easy customization to describe specific business functions or departments. The use of simple, clean icons ensures that the content is accessible and straightforward, suitable for professional presentations that require a blend of visual appeal and clarity. This template can effectively communicate various aspects of business operations or team roles in corporate presentations.


7 slides
Remote Work Guidelines and Setup Presentation
Bring clarity to your remote work setup with this sleek visual guide—designed to communicate processes, tools, and best practices in one easy-to-follow layout. Whether you're onboarding a team or streamlining operations, this slide helps break it all down step by step. Fully compatible with PowerPoint, Keynote, and Google Slides.


8 slides
Product Showcase on Devices Presentation
Present your features in a sleek, mobile-first layout with the Product Showcase on Devices Presentation. This vertical slide design mimics a smartphone screen, making it ideal for displaying app features, service tiers, or digital tool highlights. Each section is clearly segmented, perfect for comparisons or step-by-step product walkthroughs. Fully editable in PowerPoint, Keynote, Canva, and Google Slides.


5 slides
Hierarchical Structure in Triangle Format Presentation
Clearly illustrate levels of authority or stages of growth with the Hierarchical Structure in Triangle Format Presentation. This layout features a visually stacked triangle with color-coded segments, each layer representing a tier or level of information. Ideal for organizational charts, value pyramids, or priority structures. Each section includes a title, icon, and description area to keep your message clear and impactful. Fully editable in PowerPoint, Keynote, and Google Slides.


5 slides
Cloud Computing Services Overview Presentation
Simplify cloud service explanations with this Cloud Computing Services Overview template. Perfect for IT professionals, business leaders, and tech strategists, this slide visually breaks down key cloud services and infrastructure using an intuitive, easy-to-understand layout. Featuring color-coded icons and modern design, this template helps showcase essential cloud computing components effectively. Fully compatible with PowerPoint, Keynote, and Google Slides for seamless integration into your presentations.
22 slides
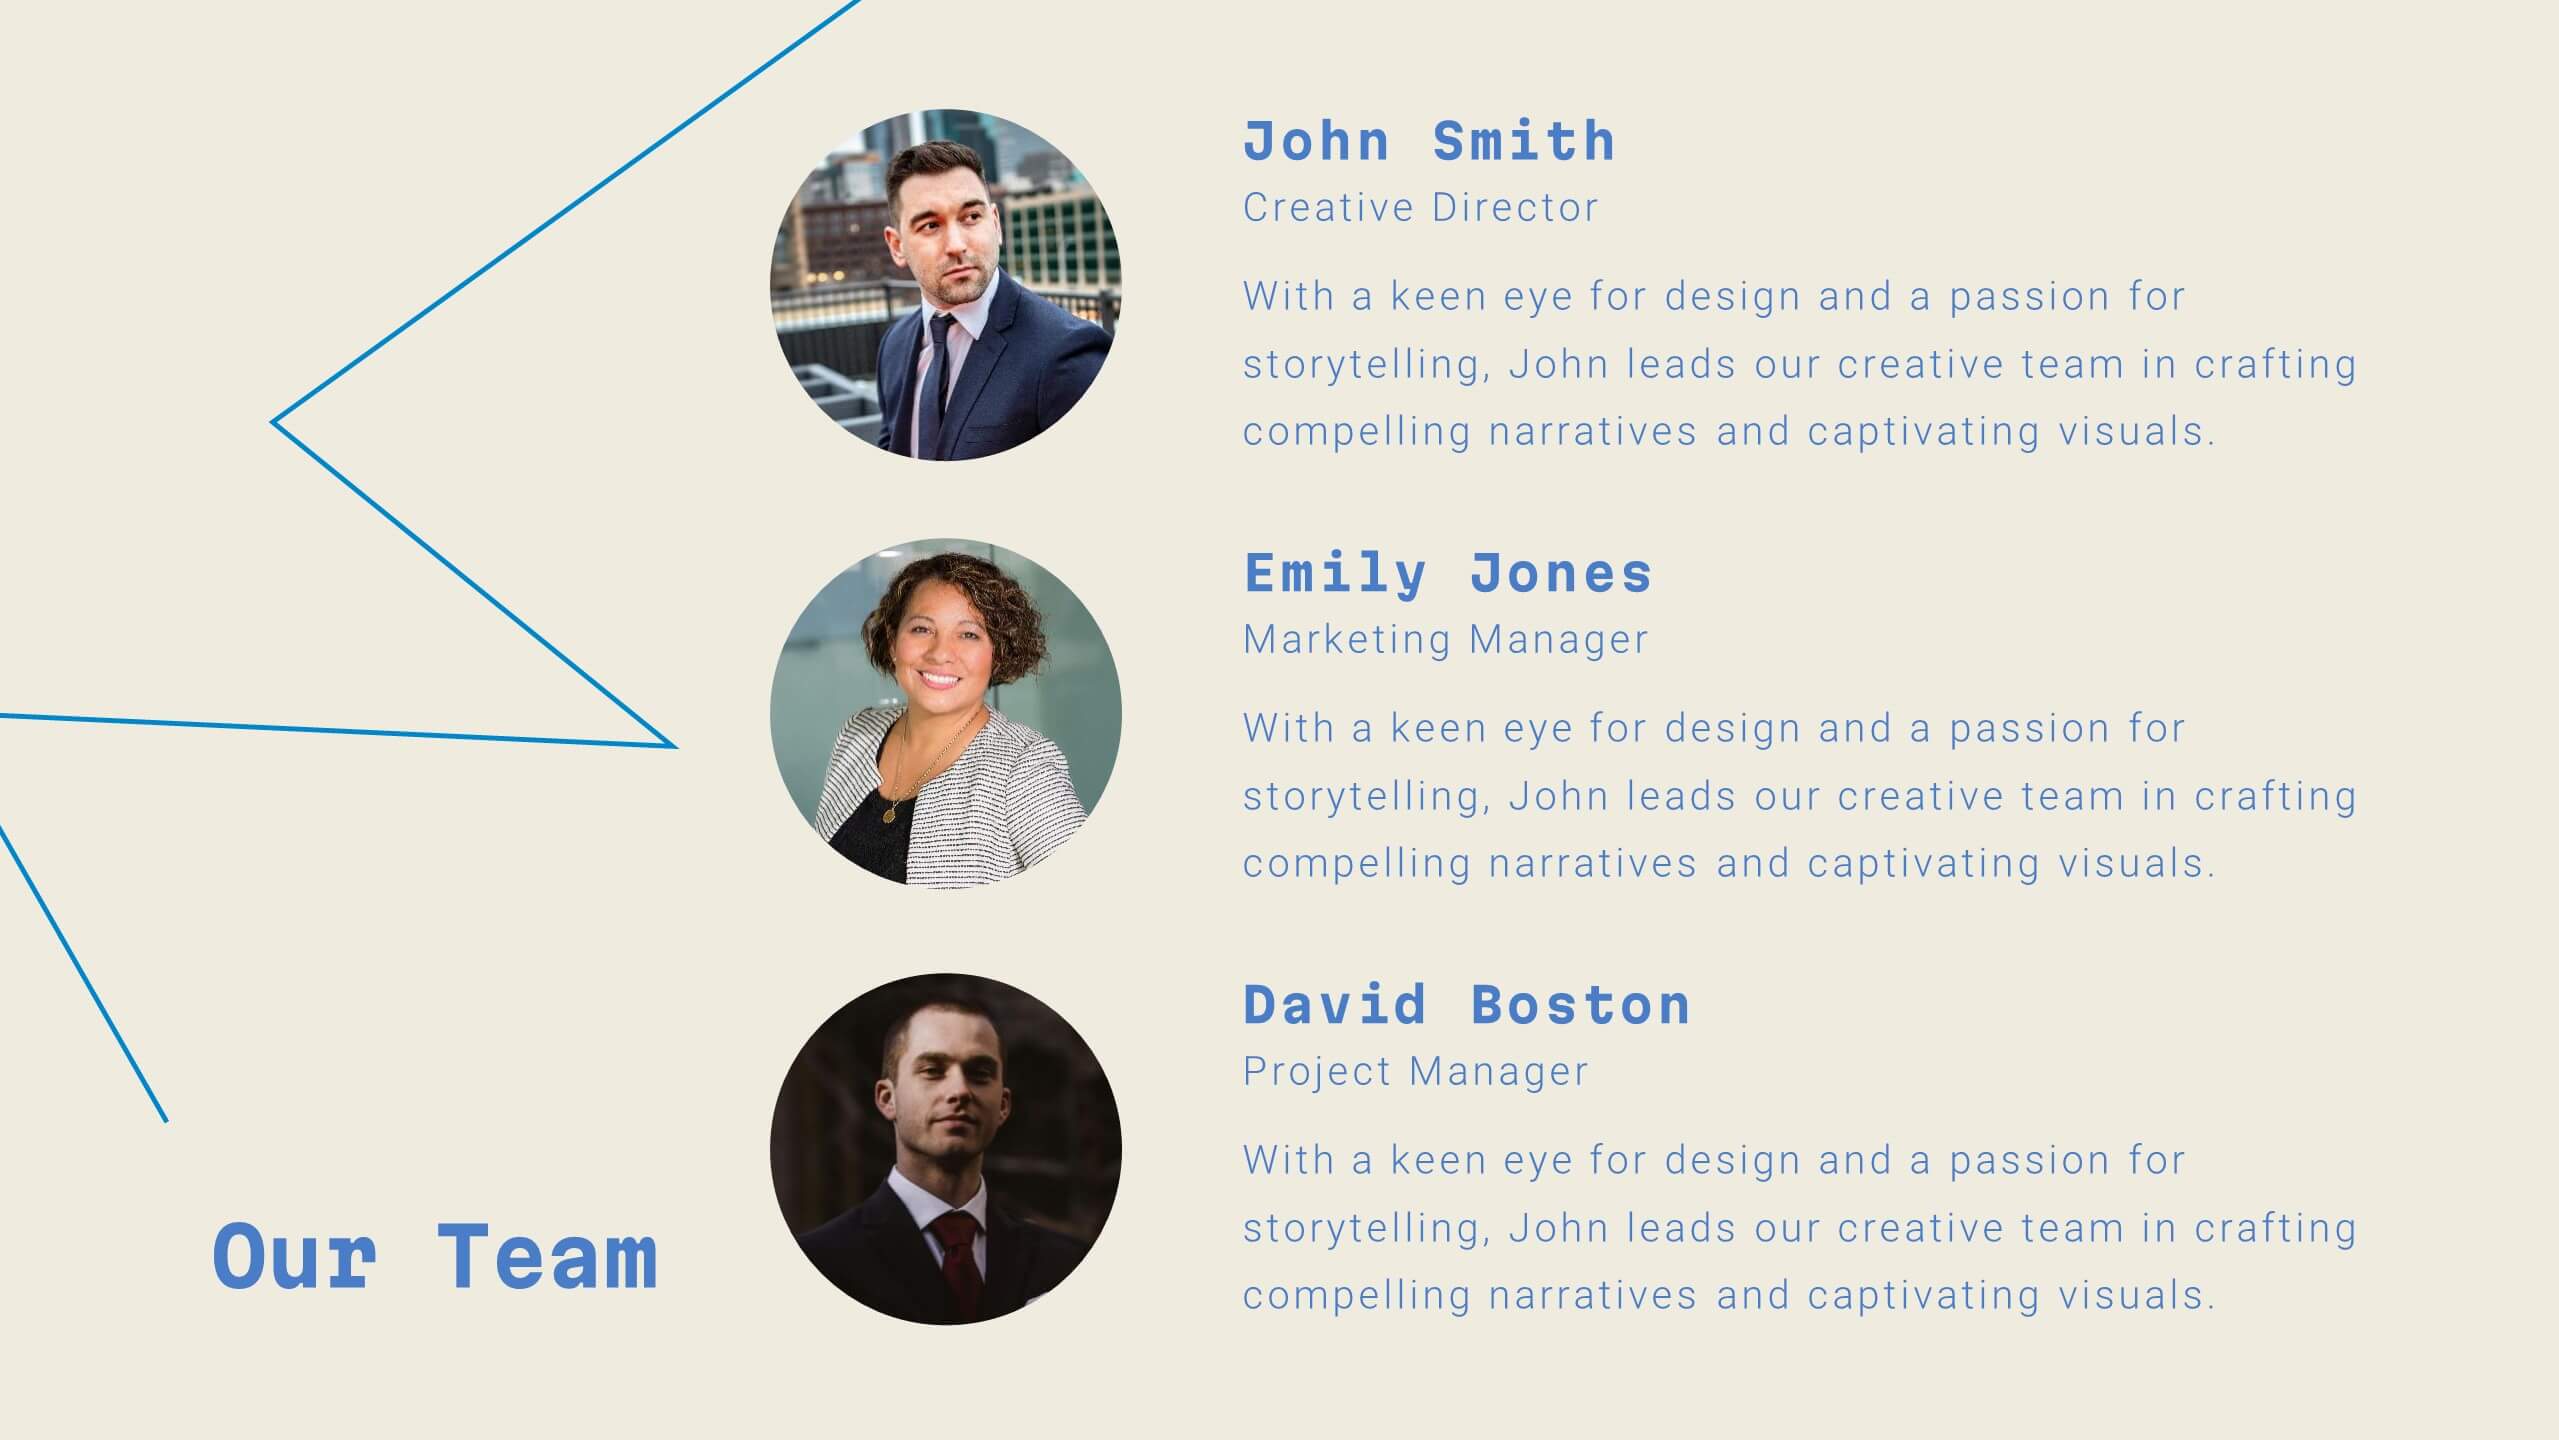
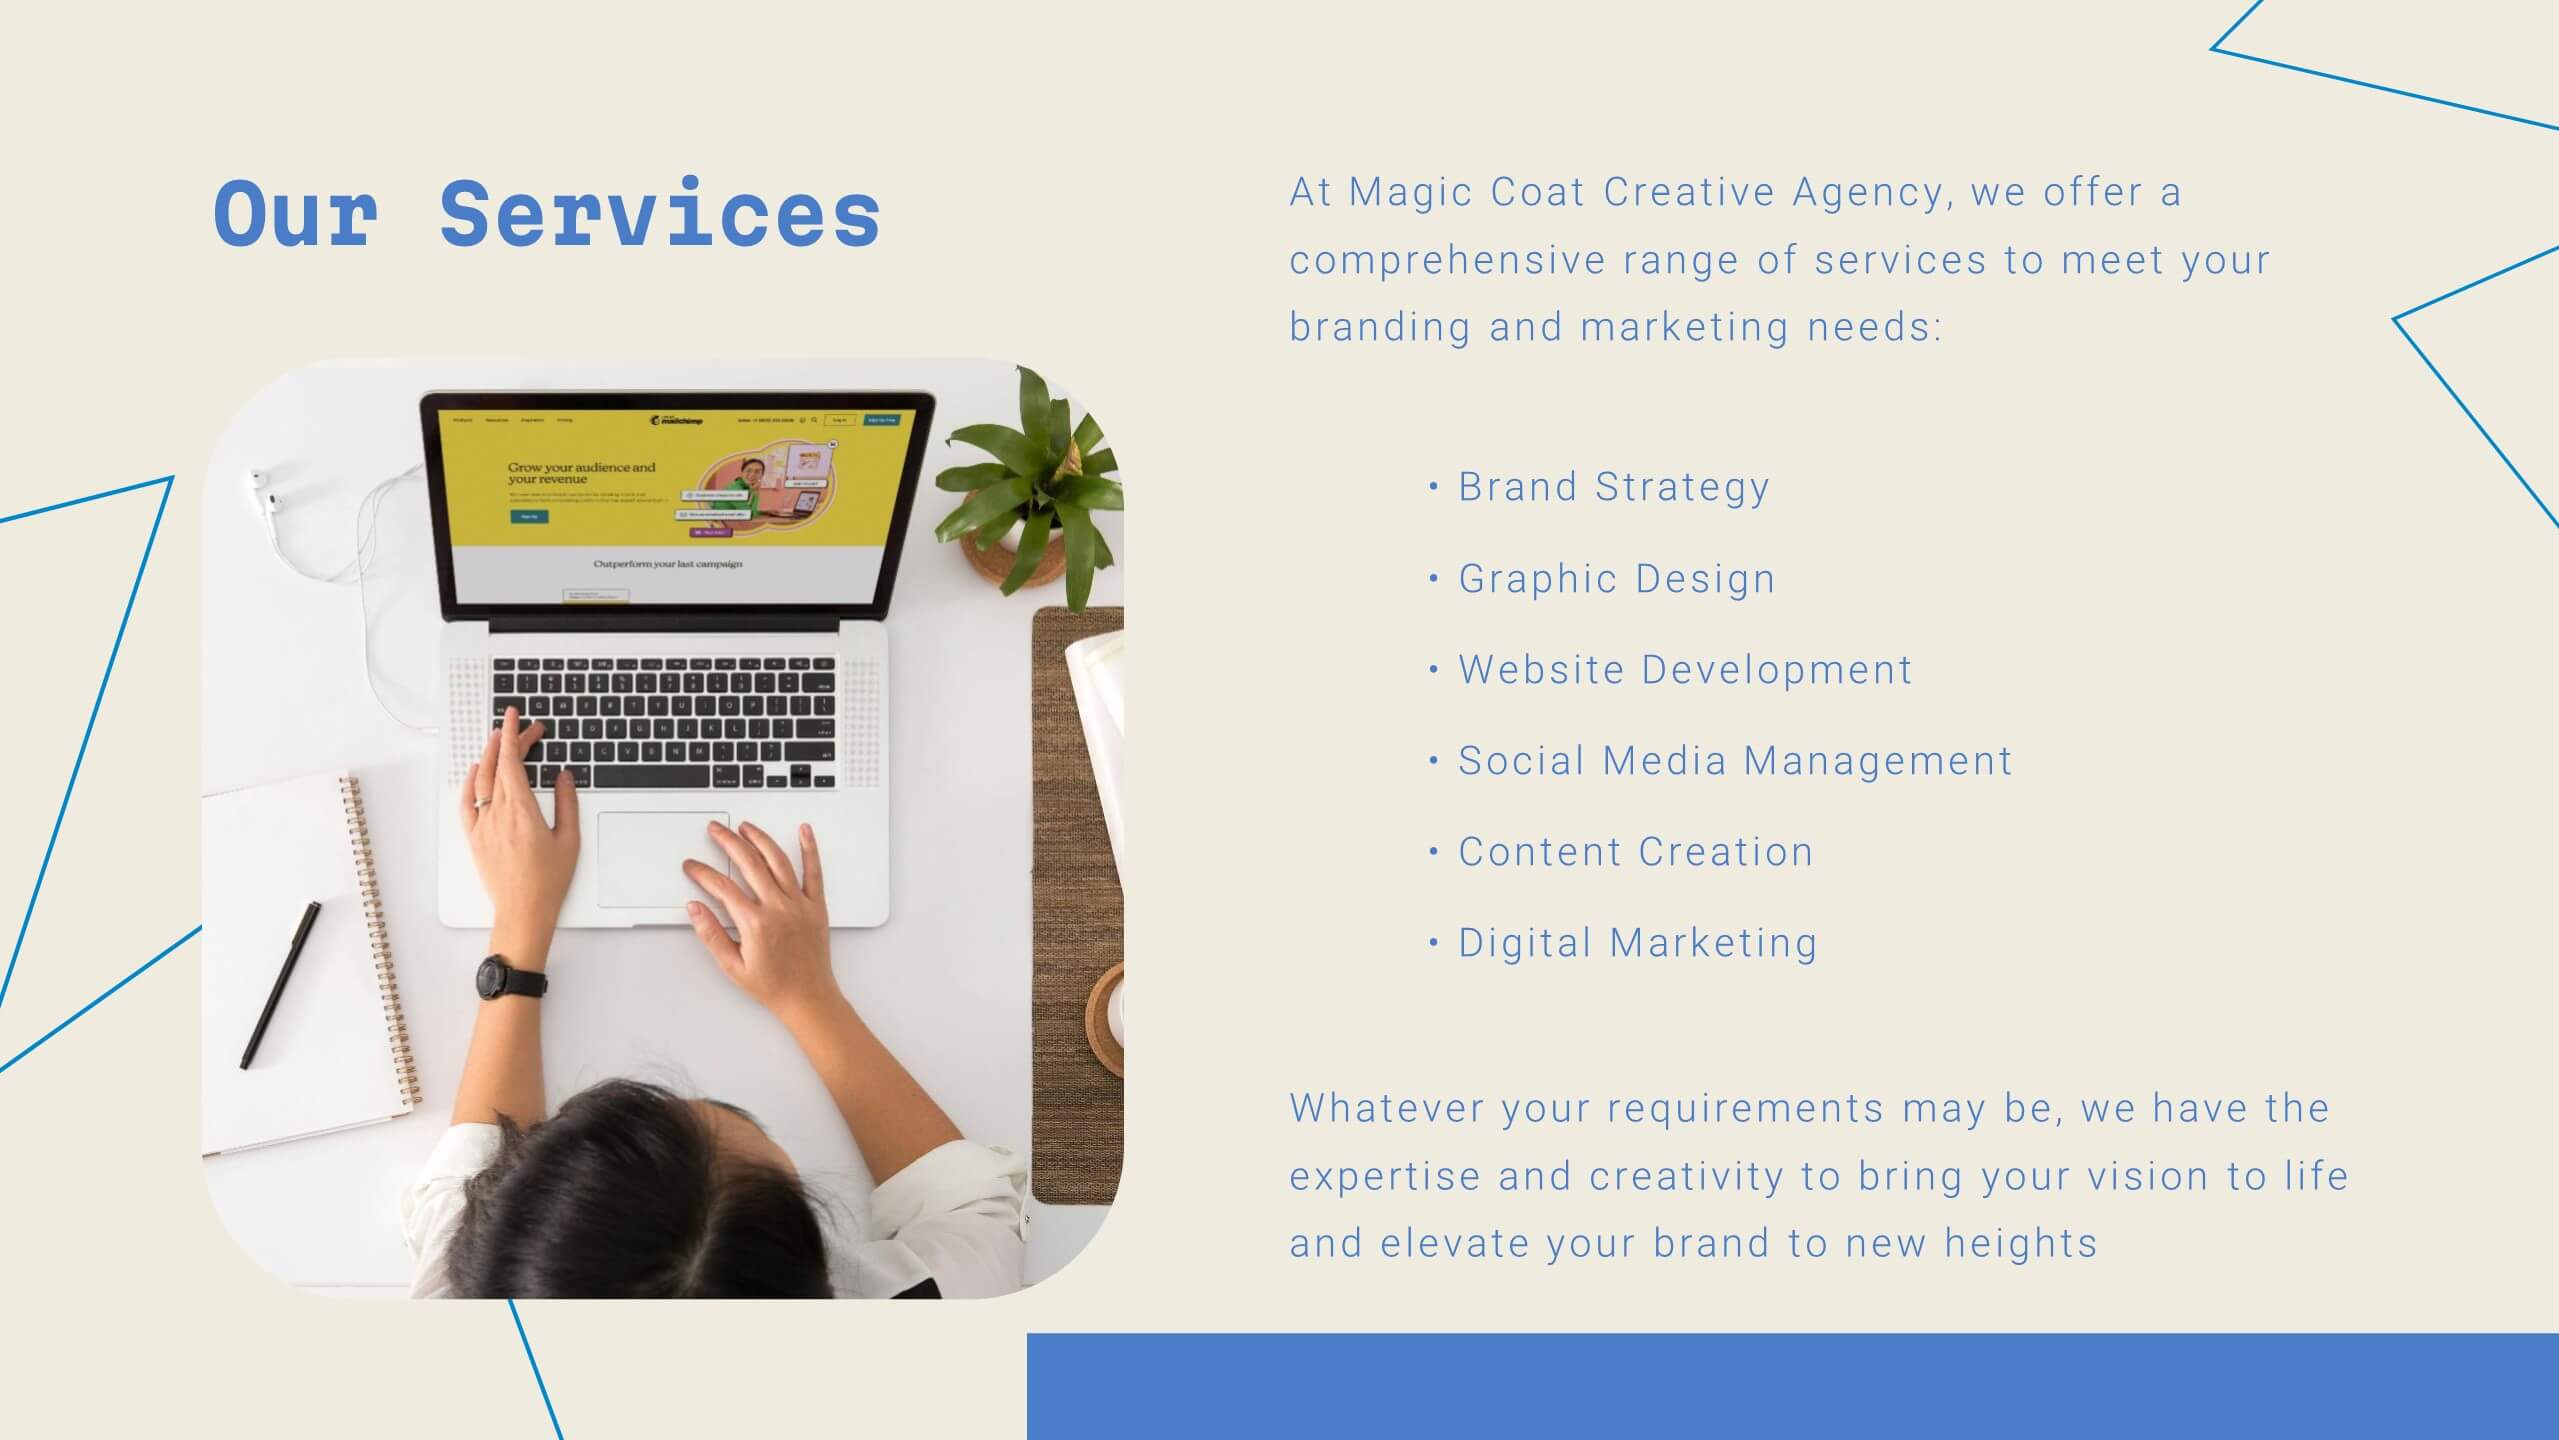
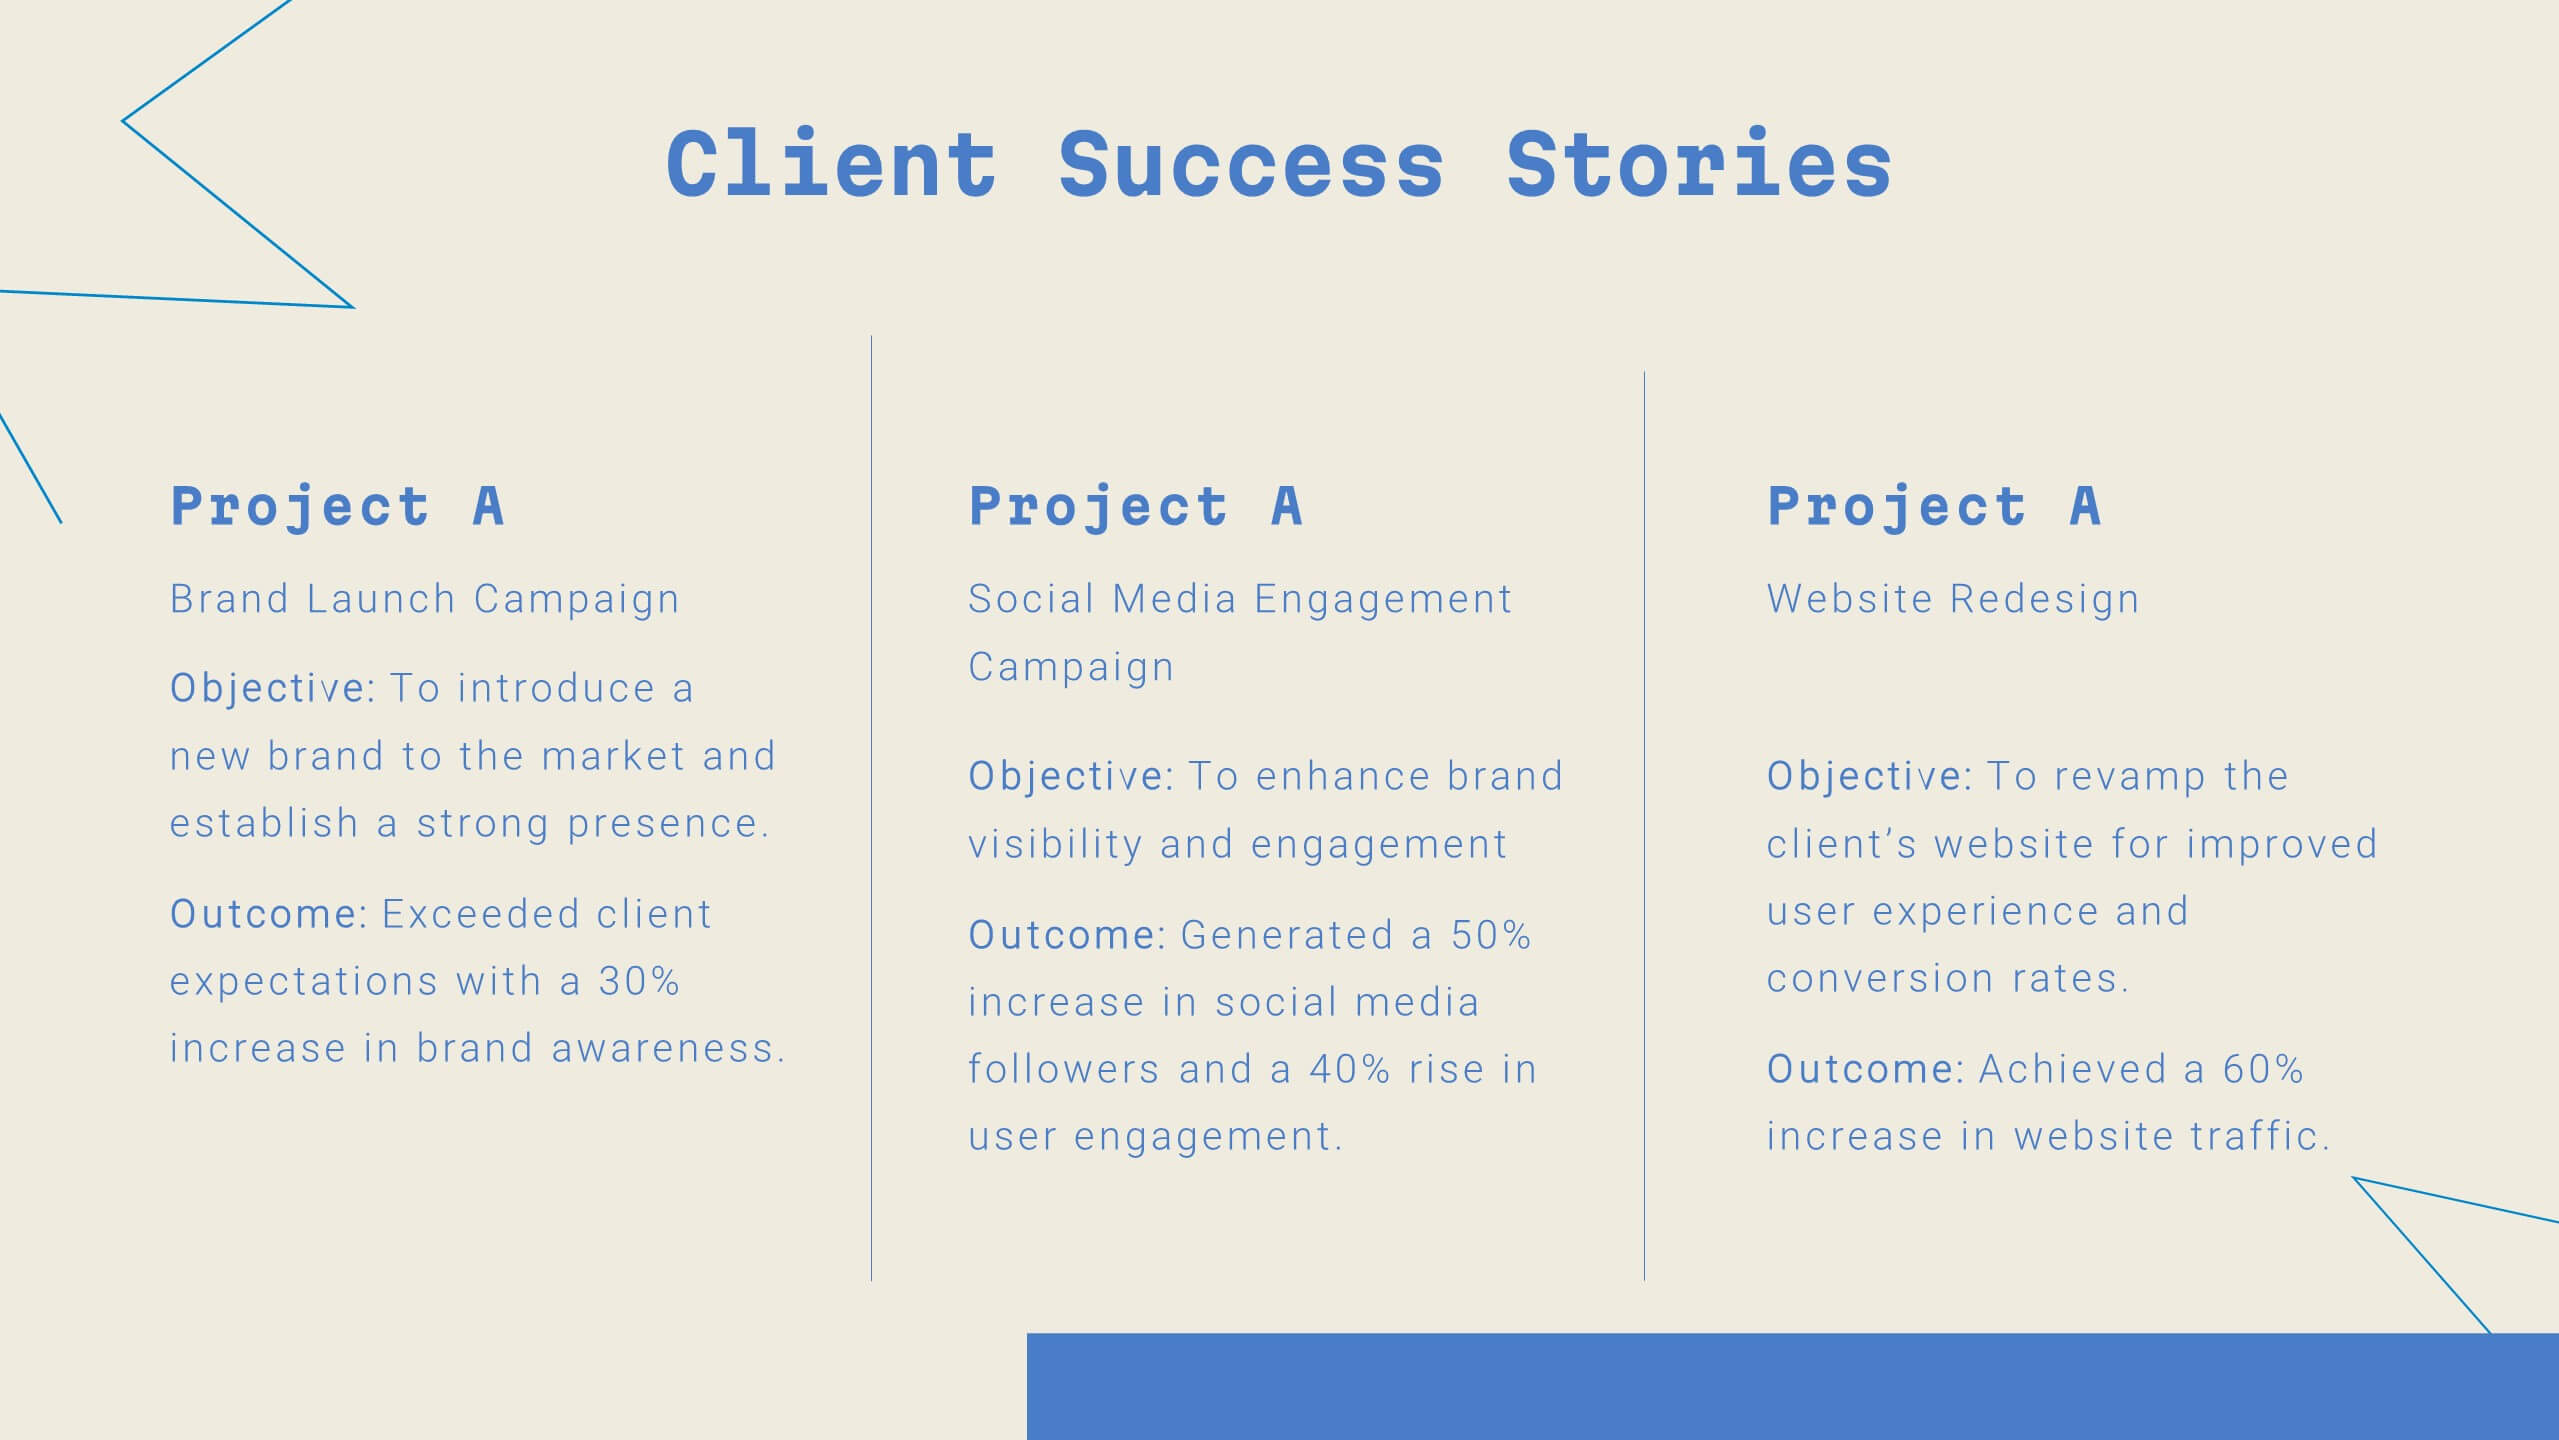
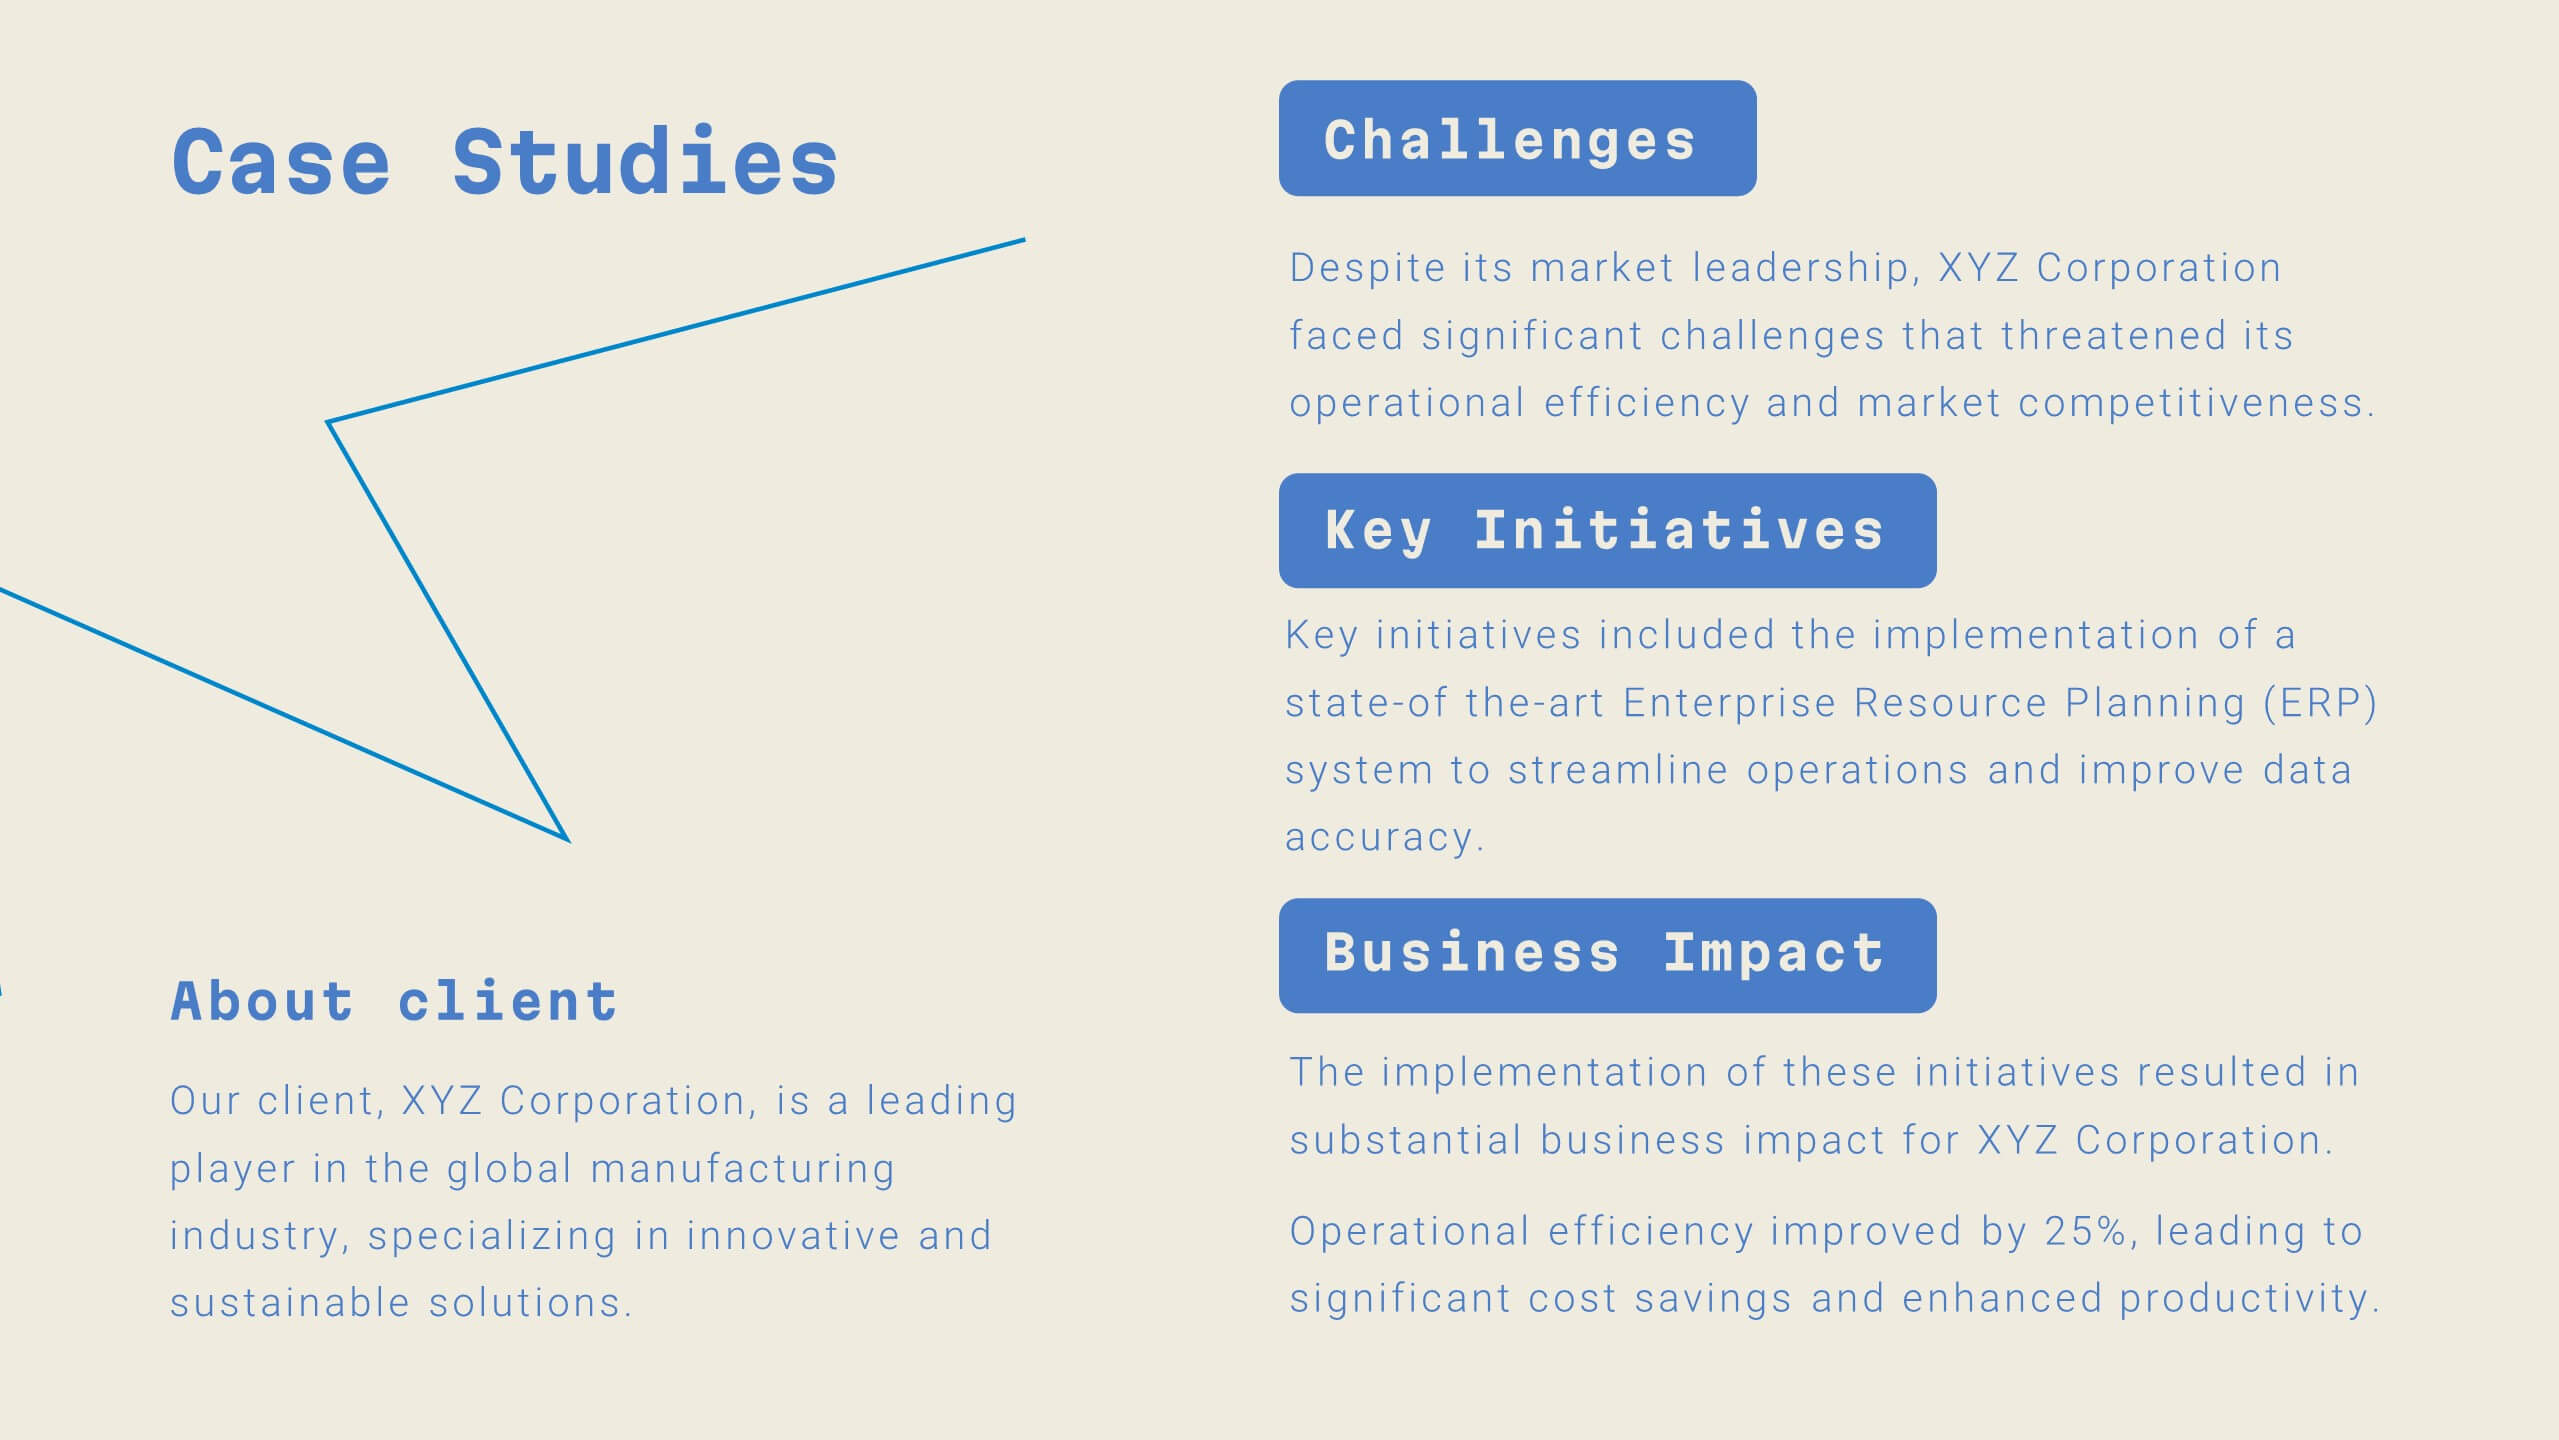
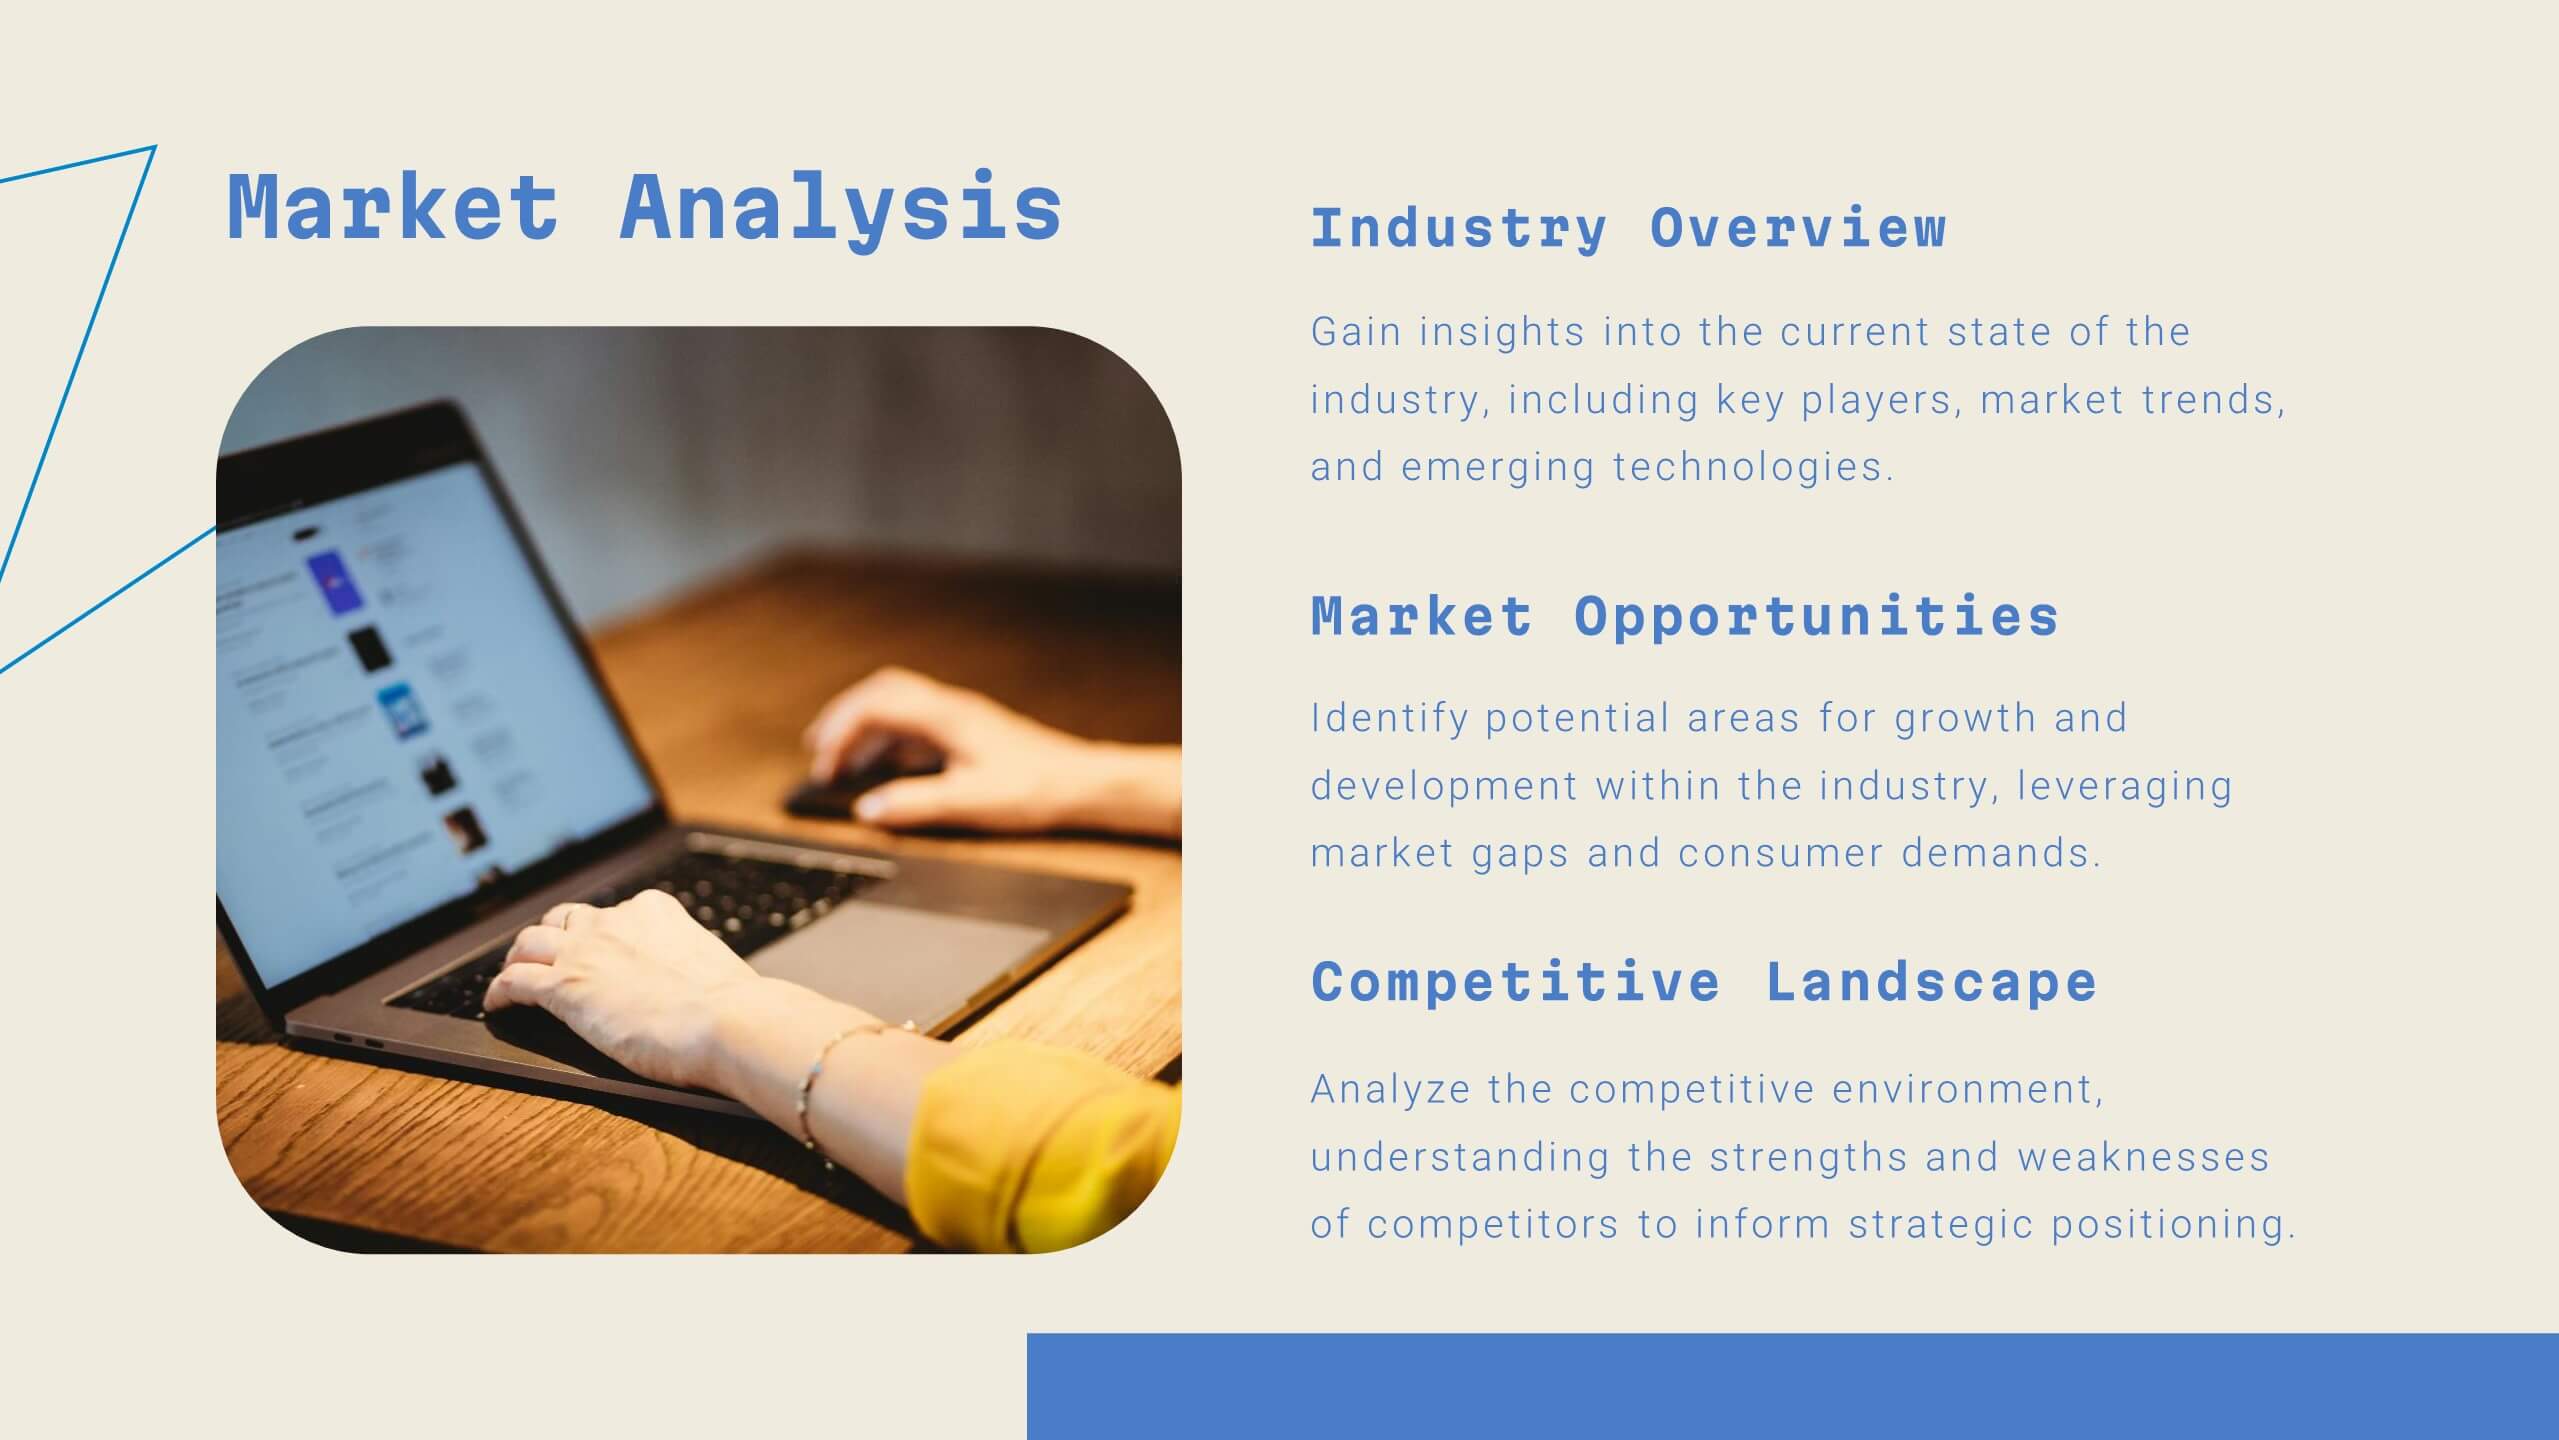
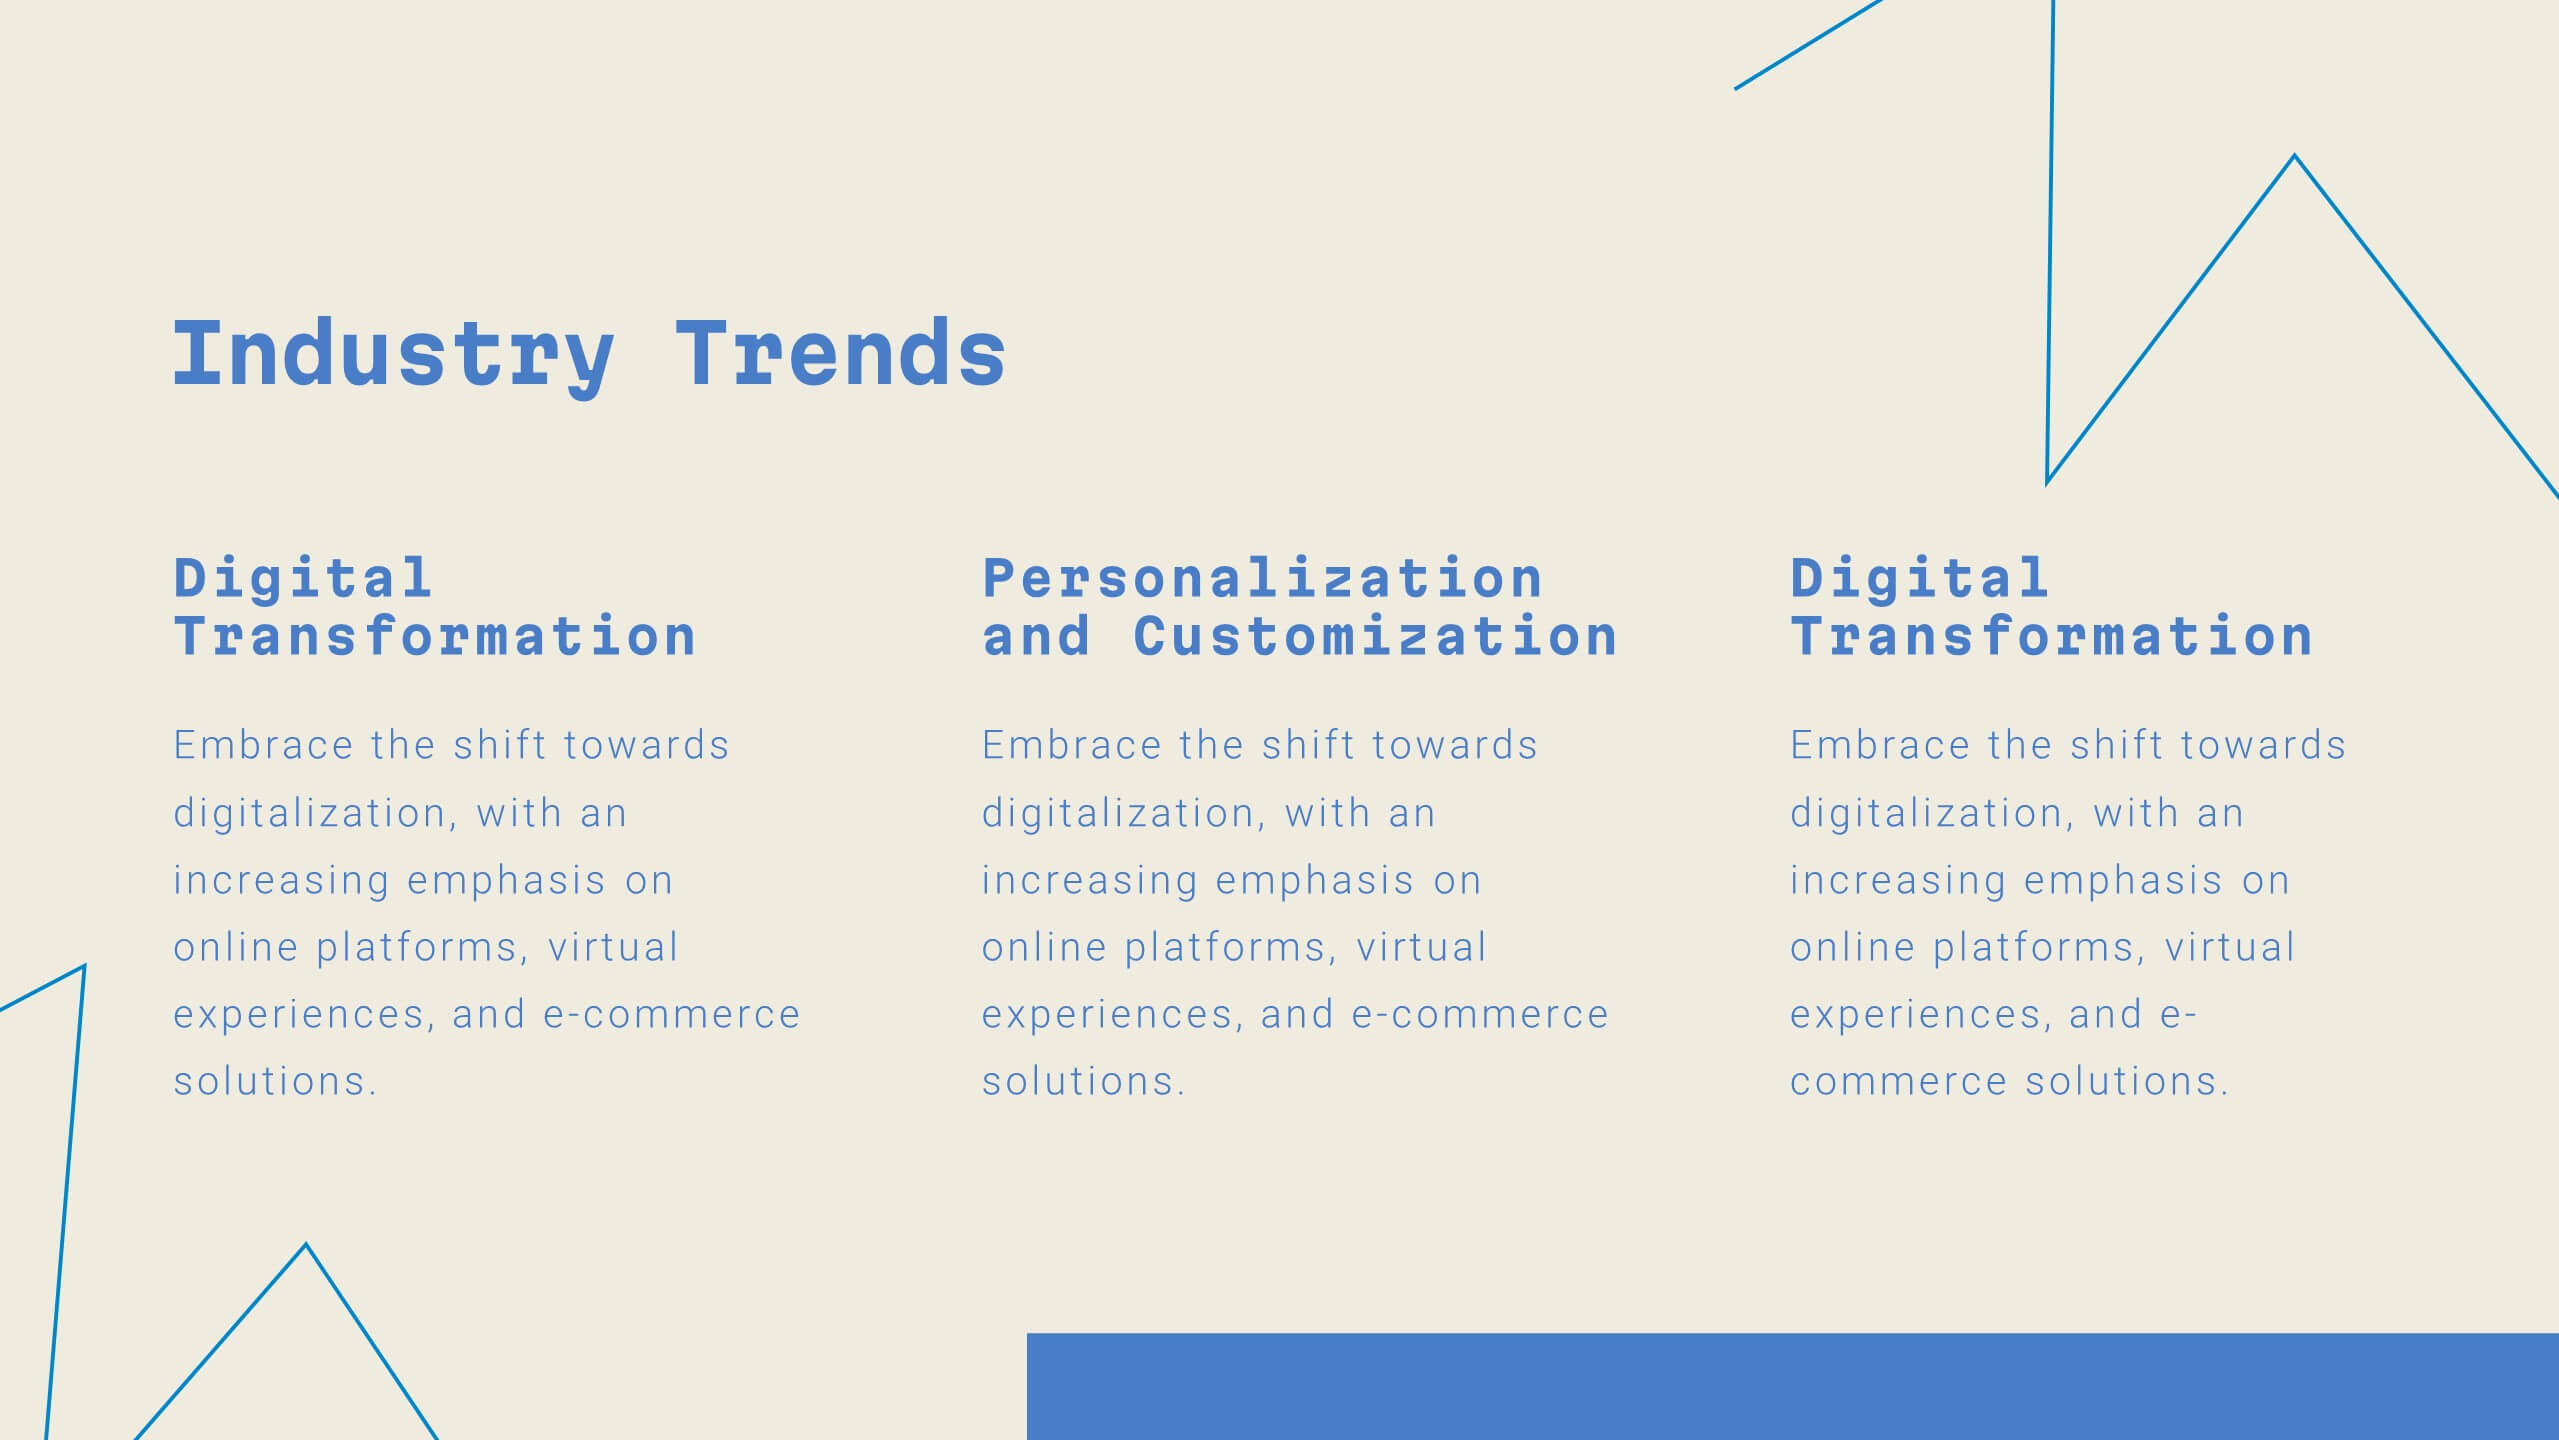
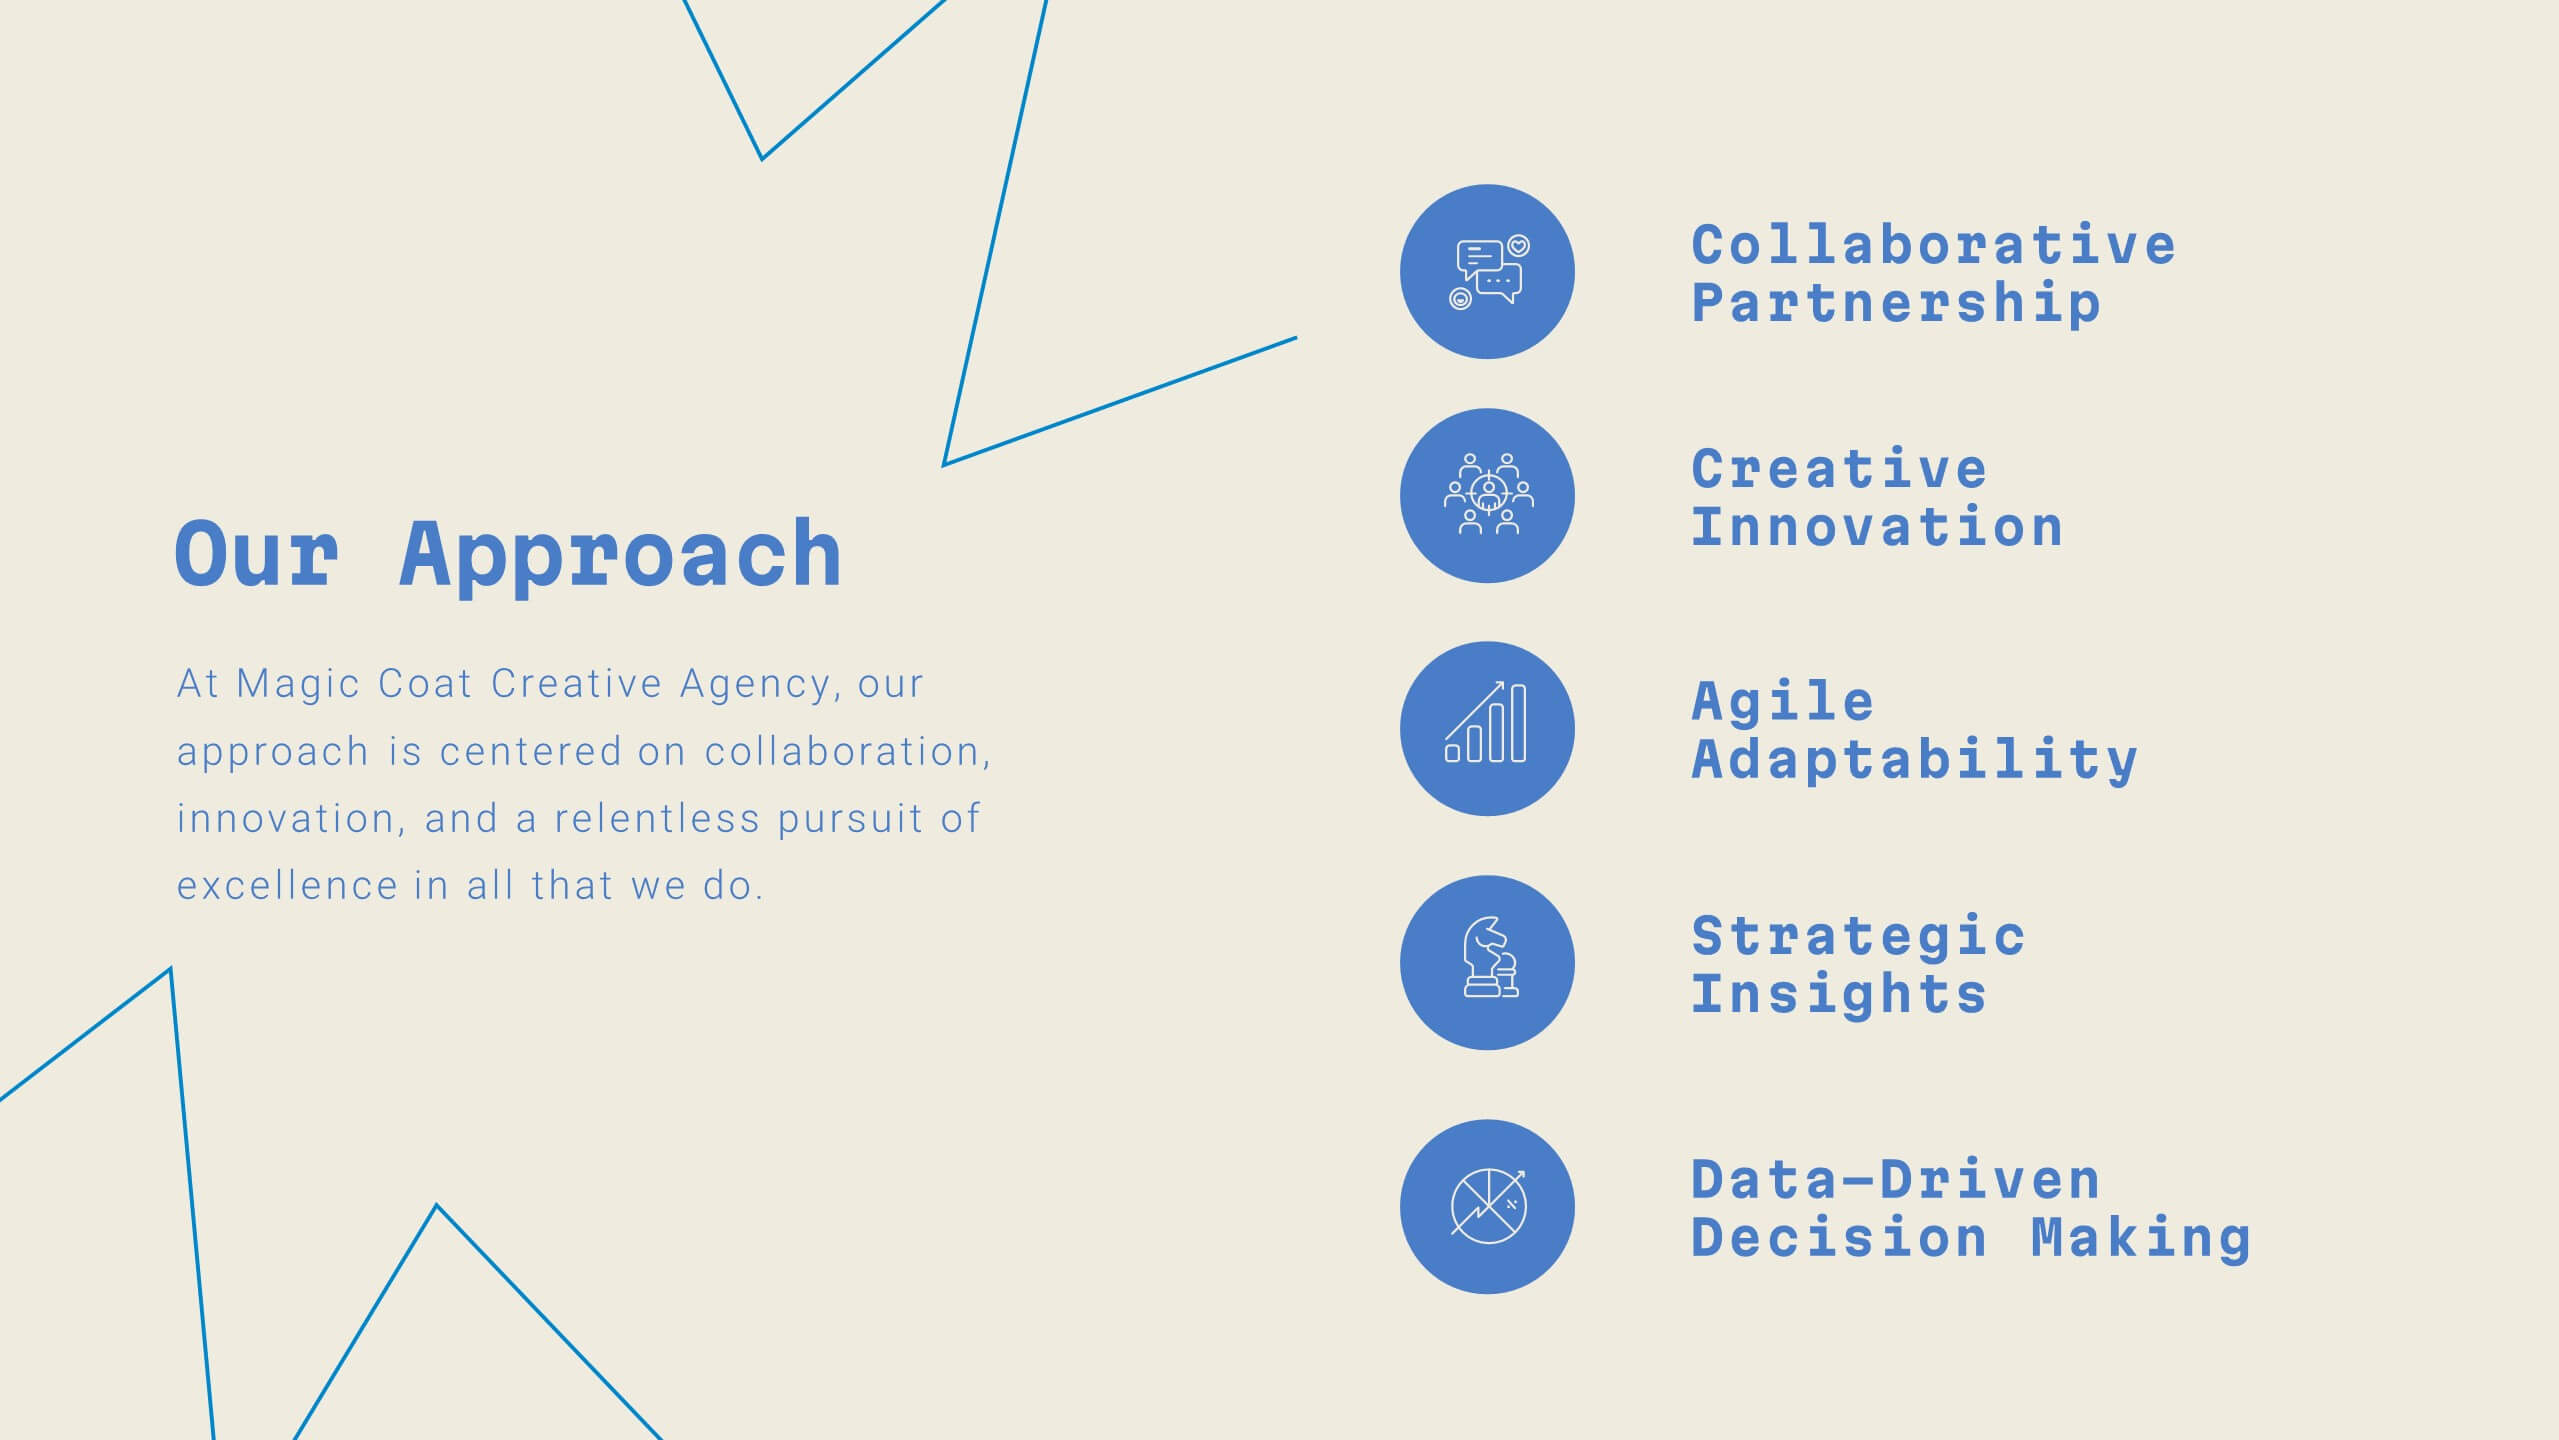
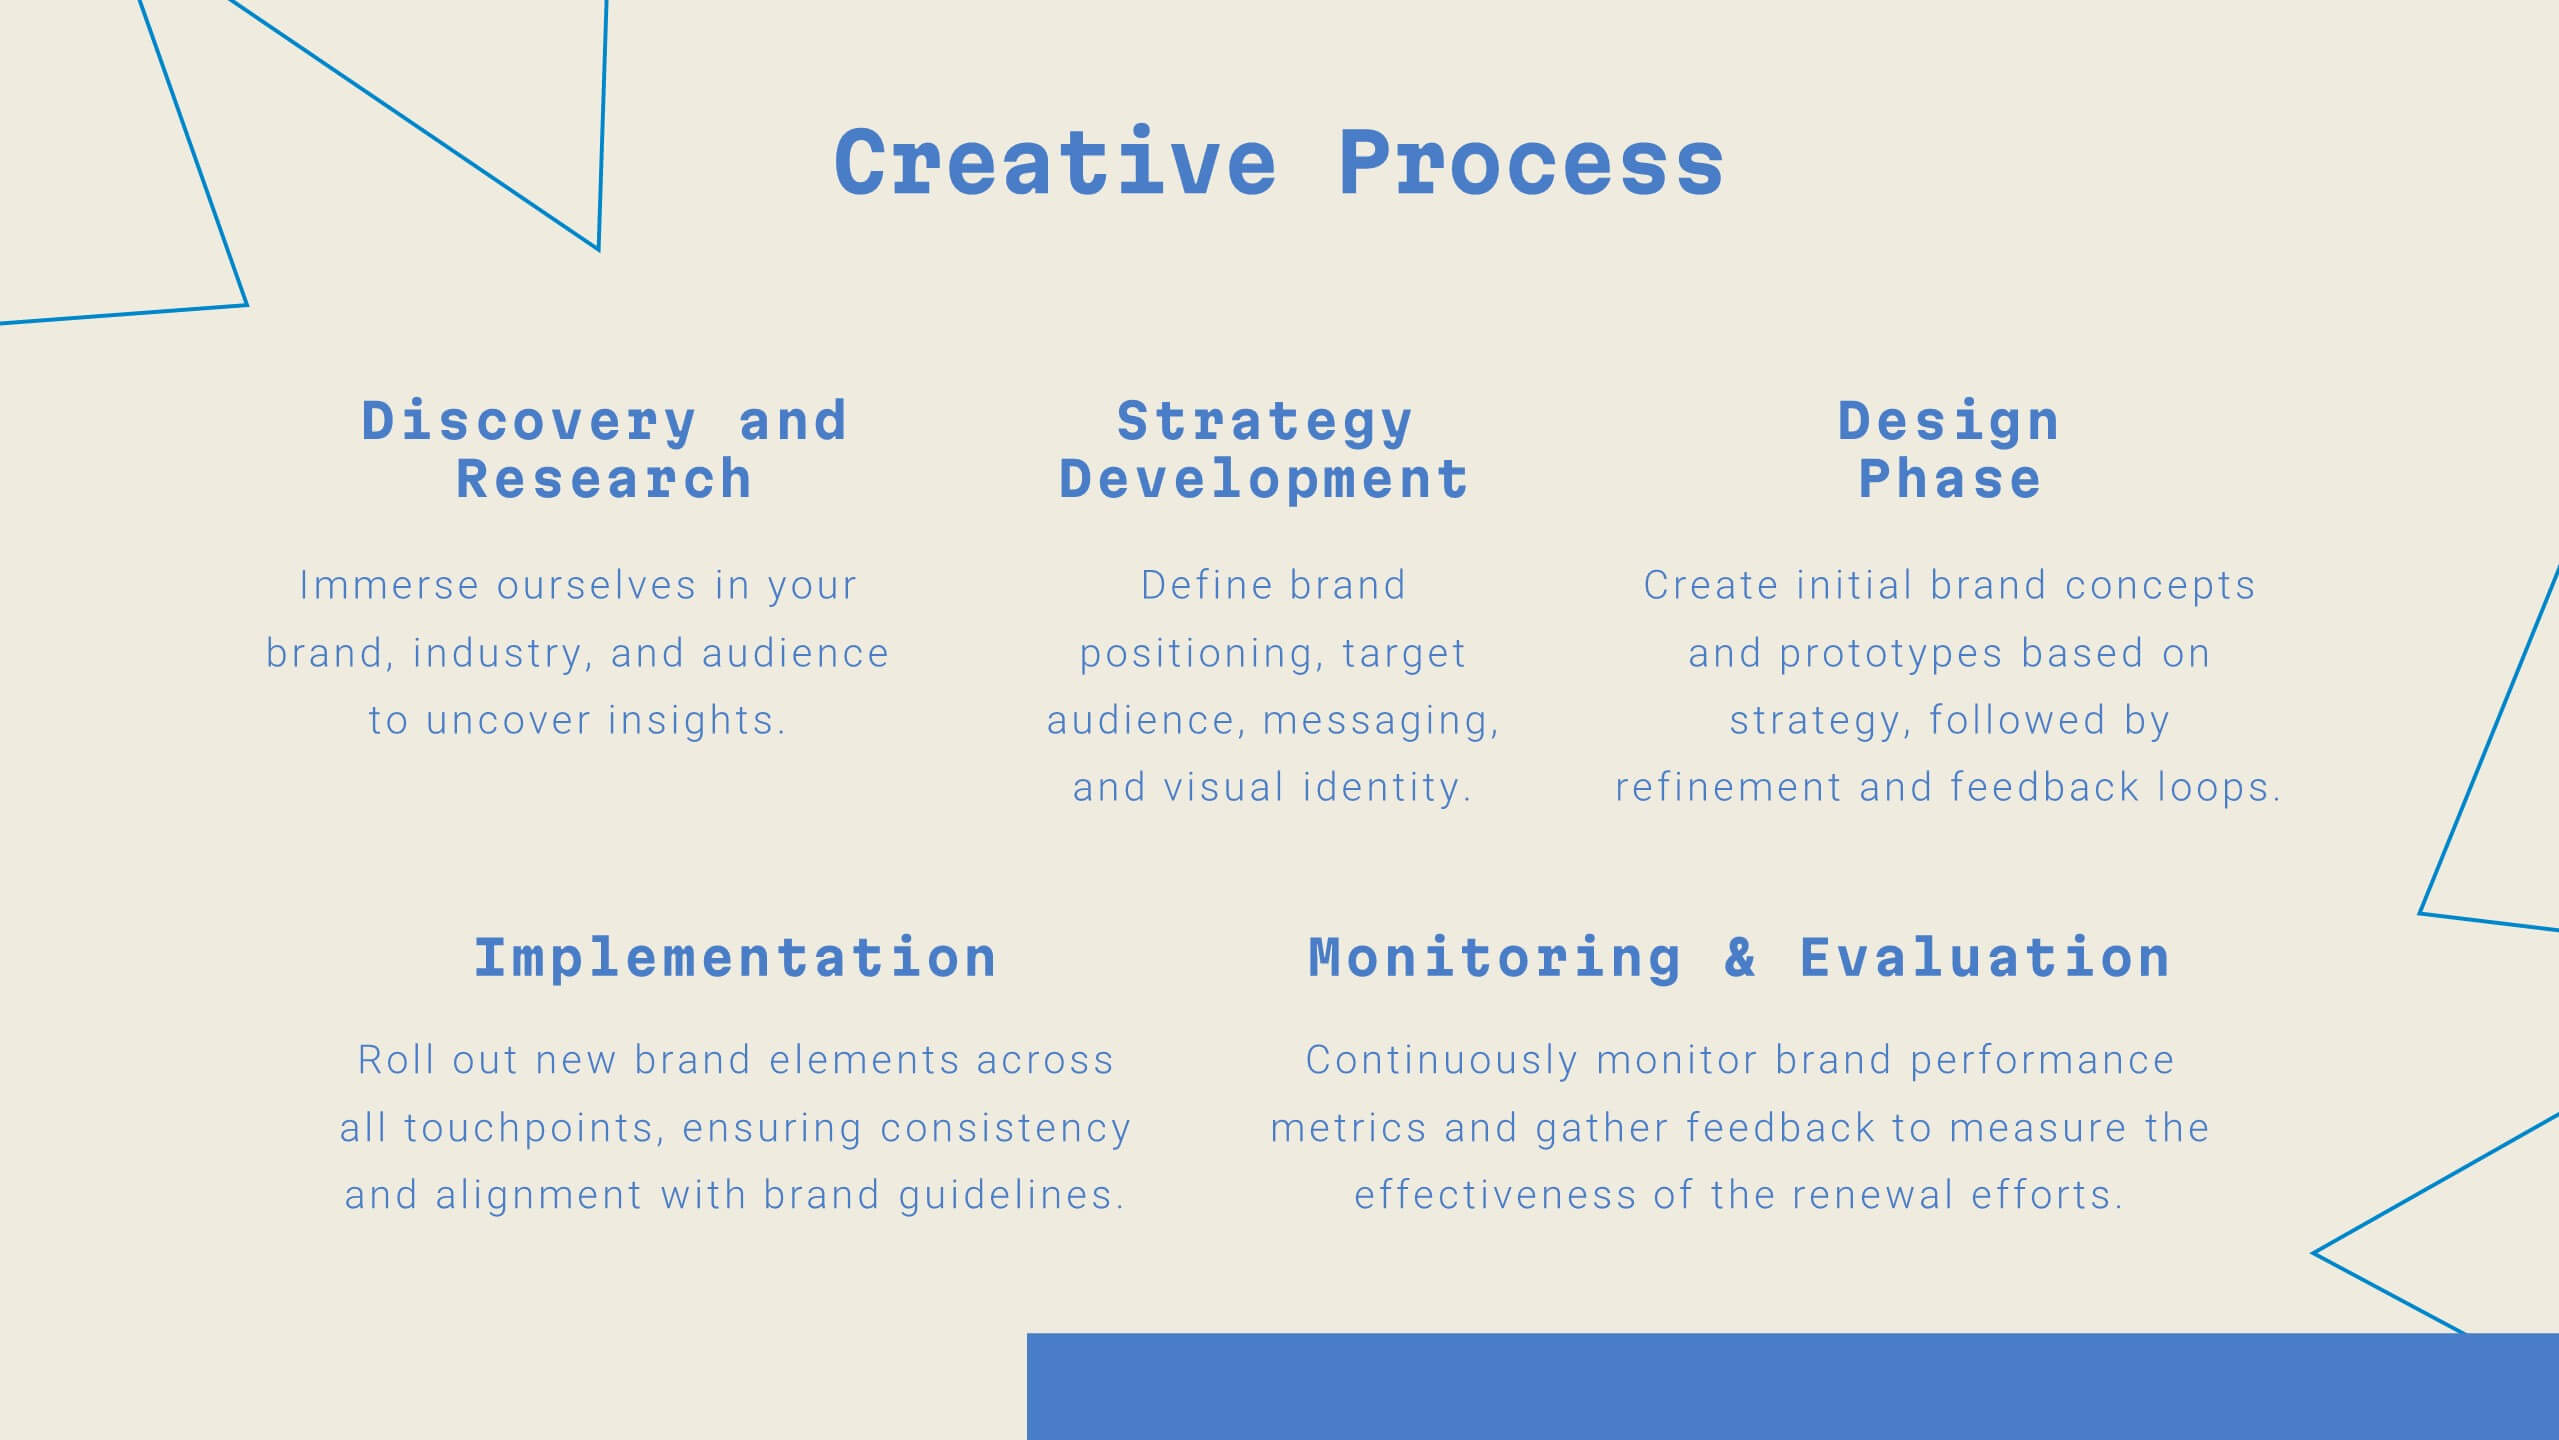
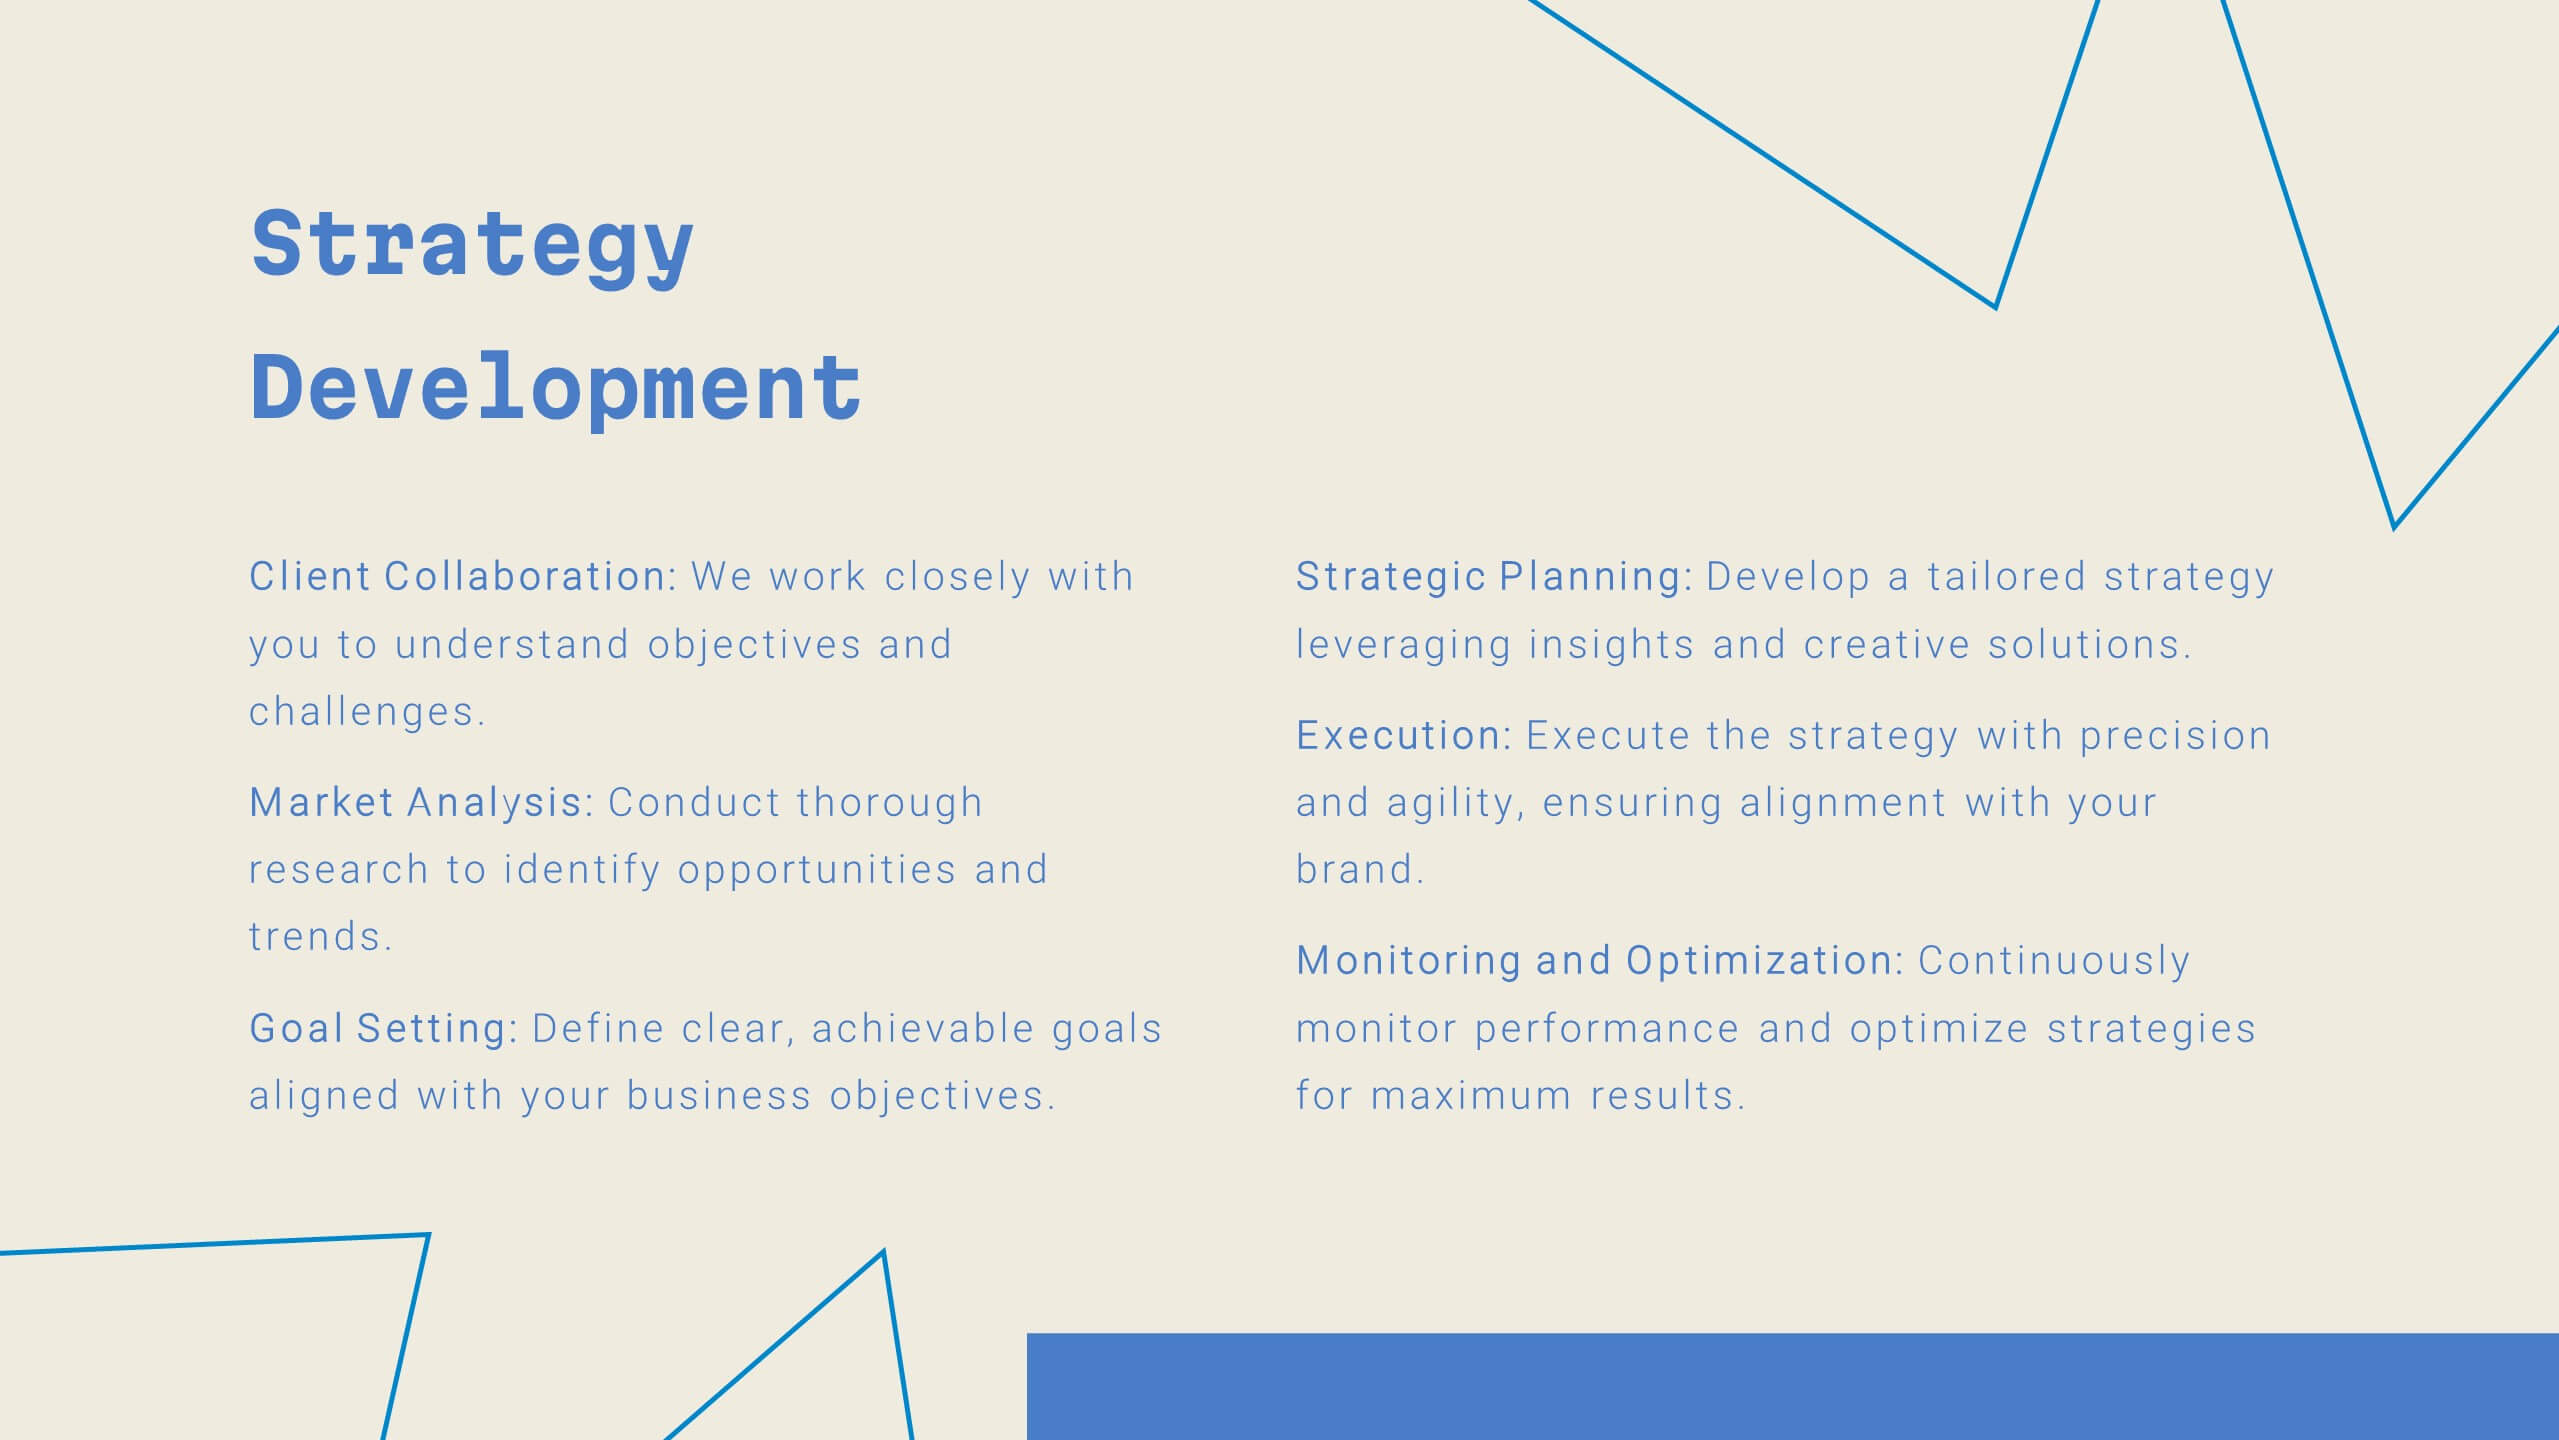
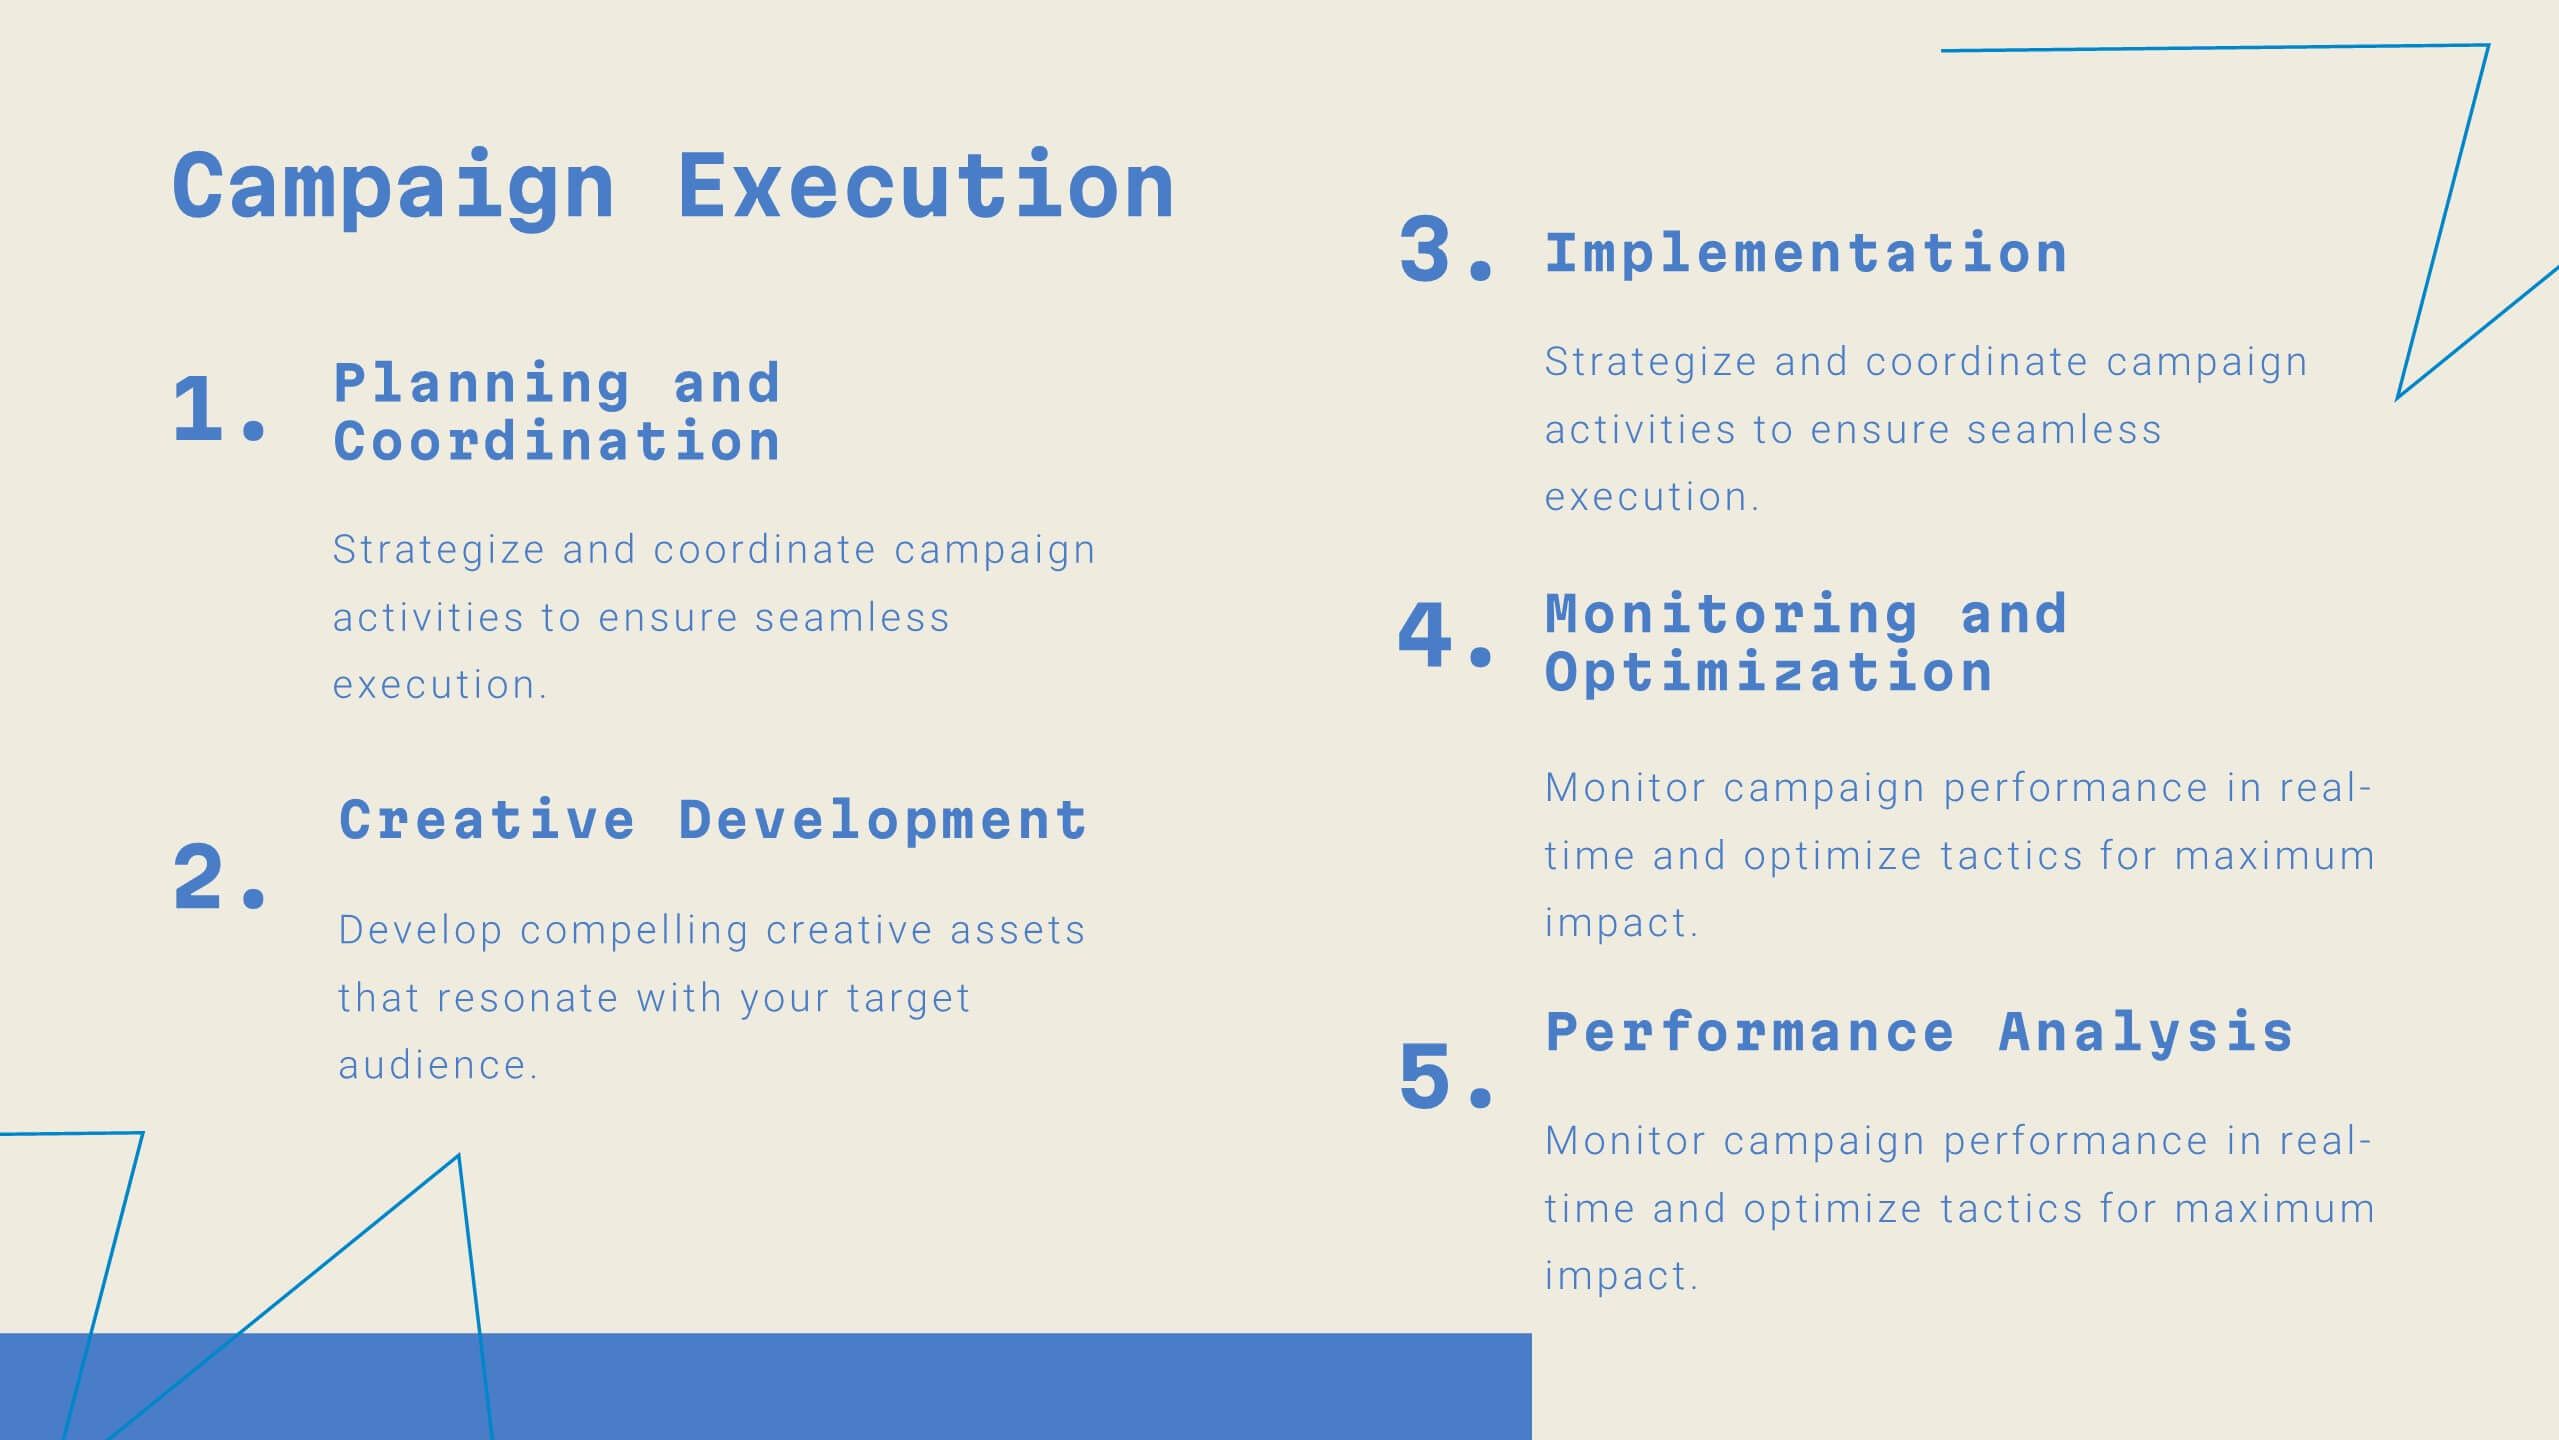
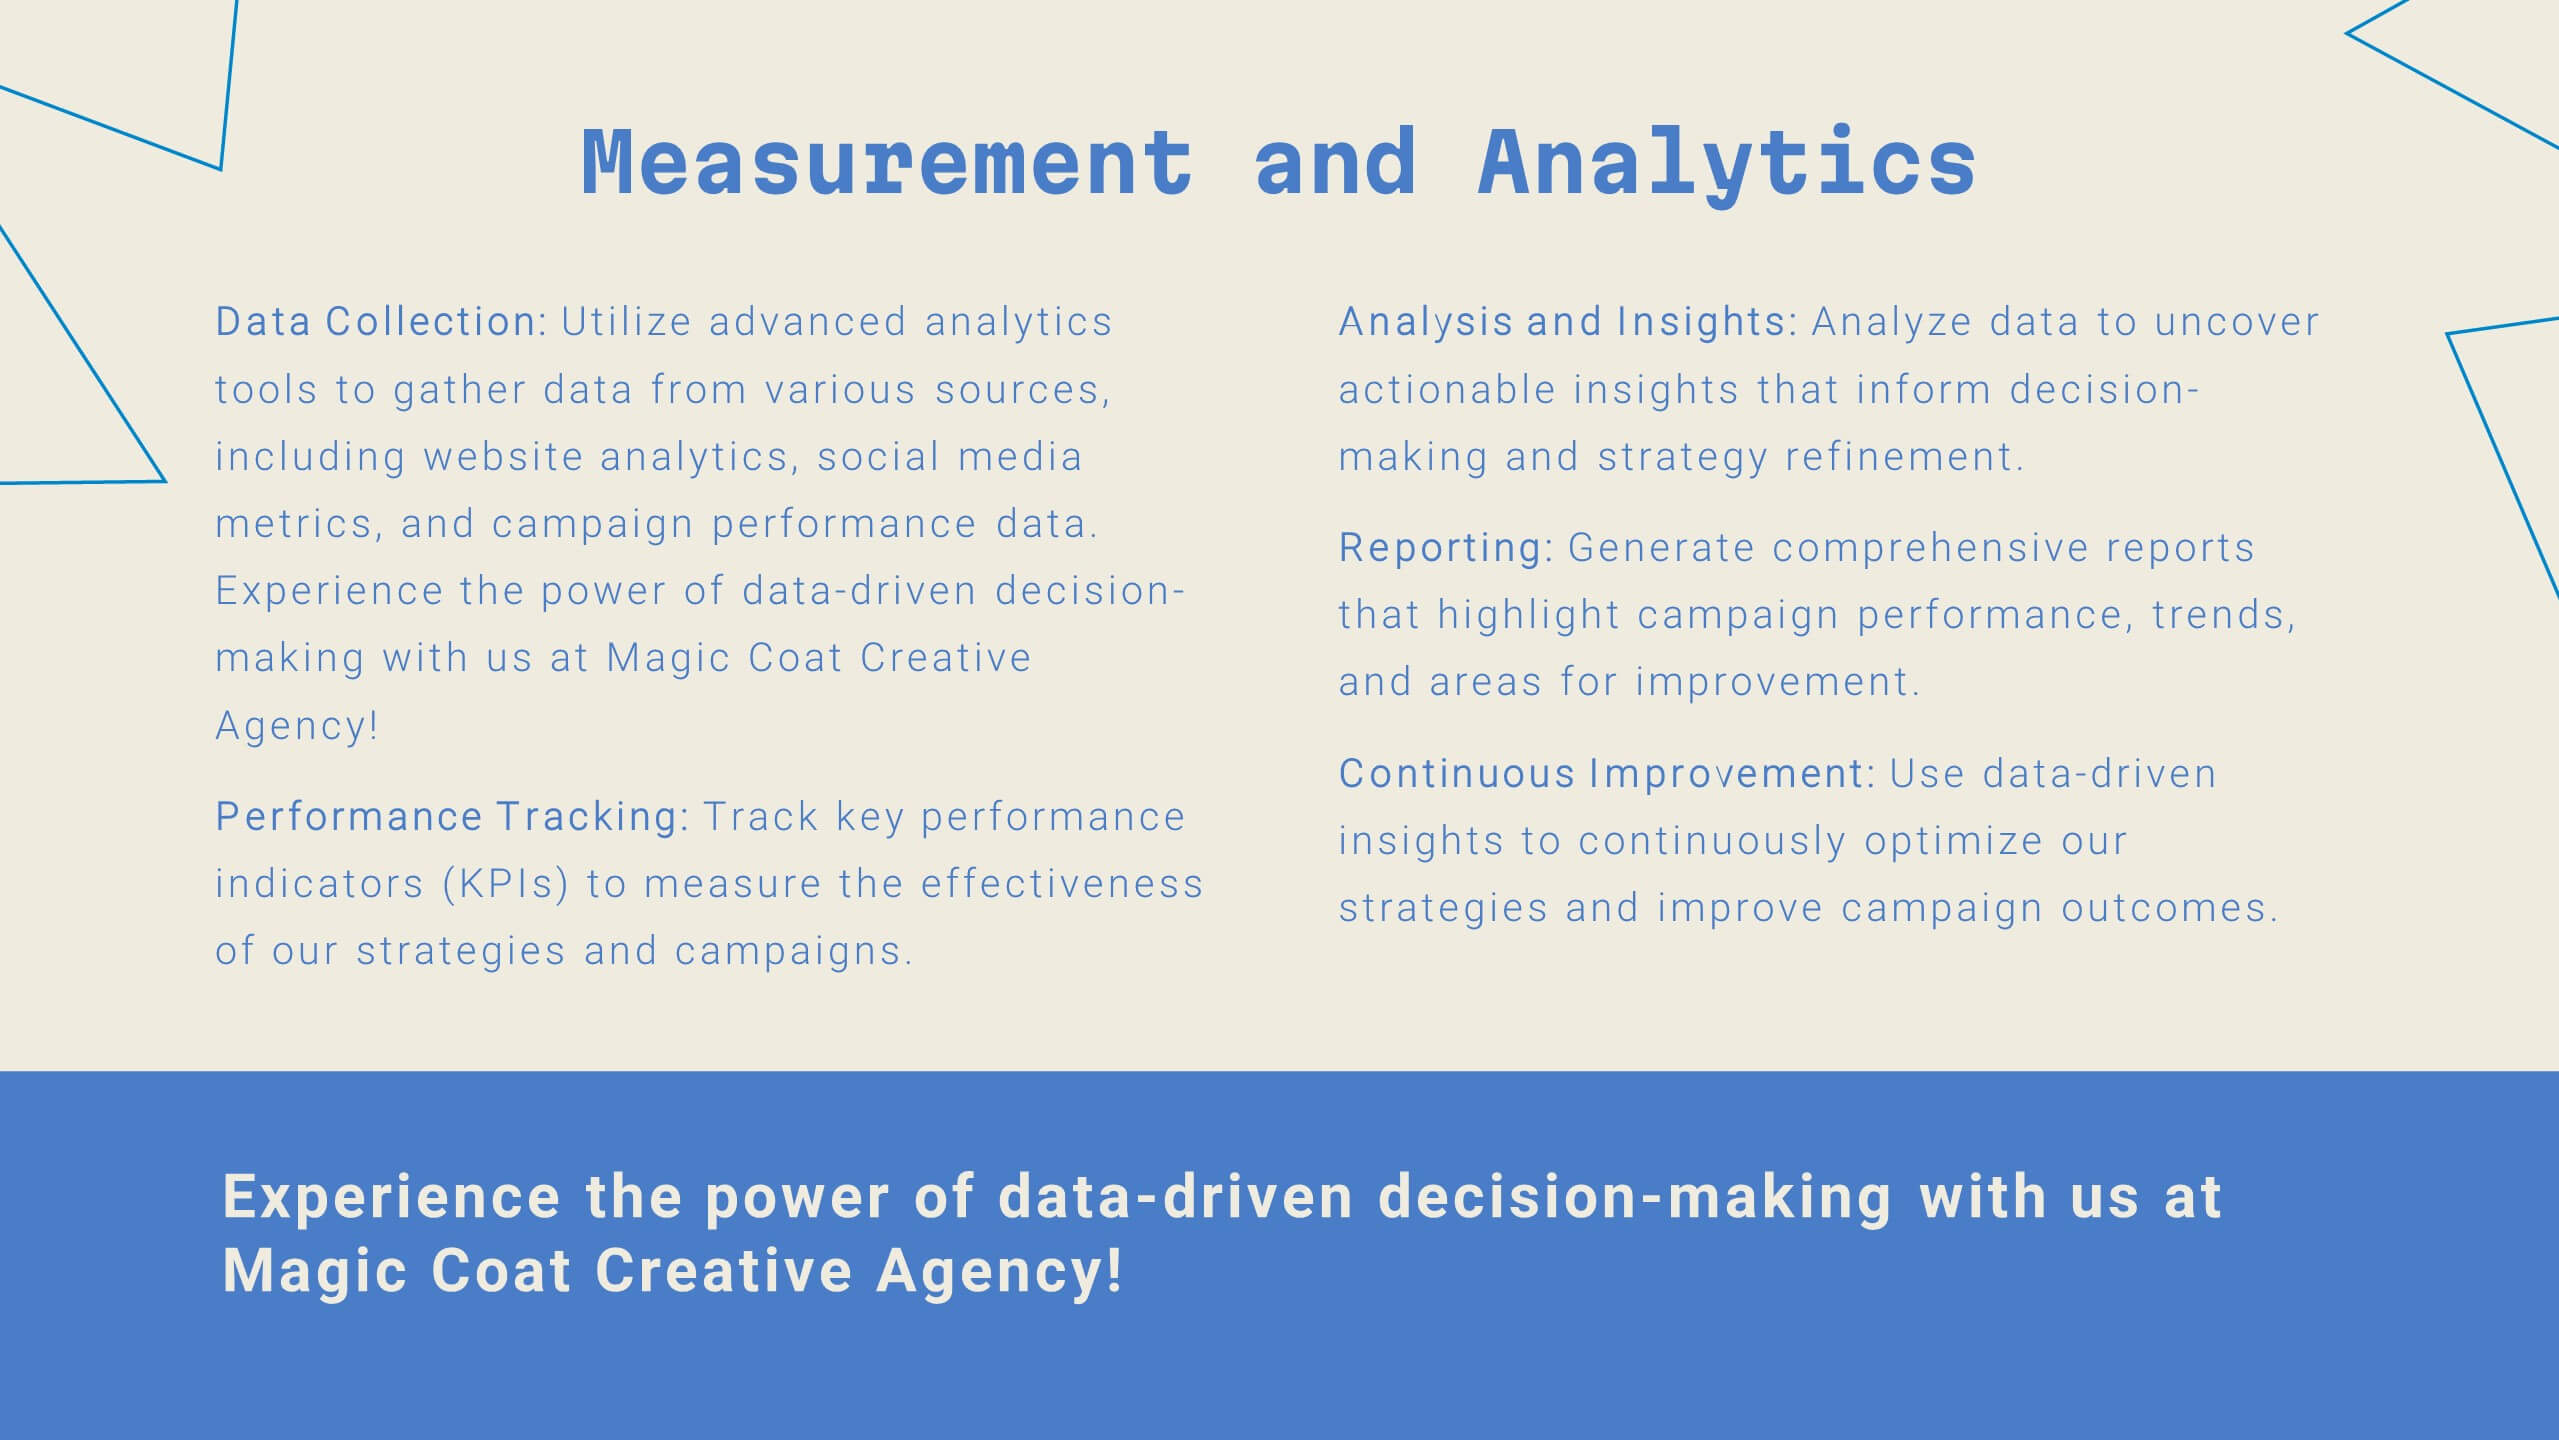
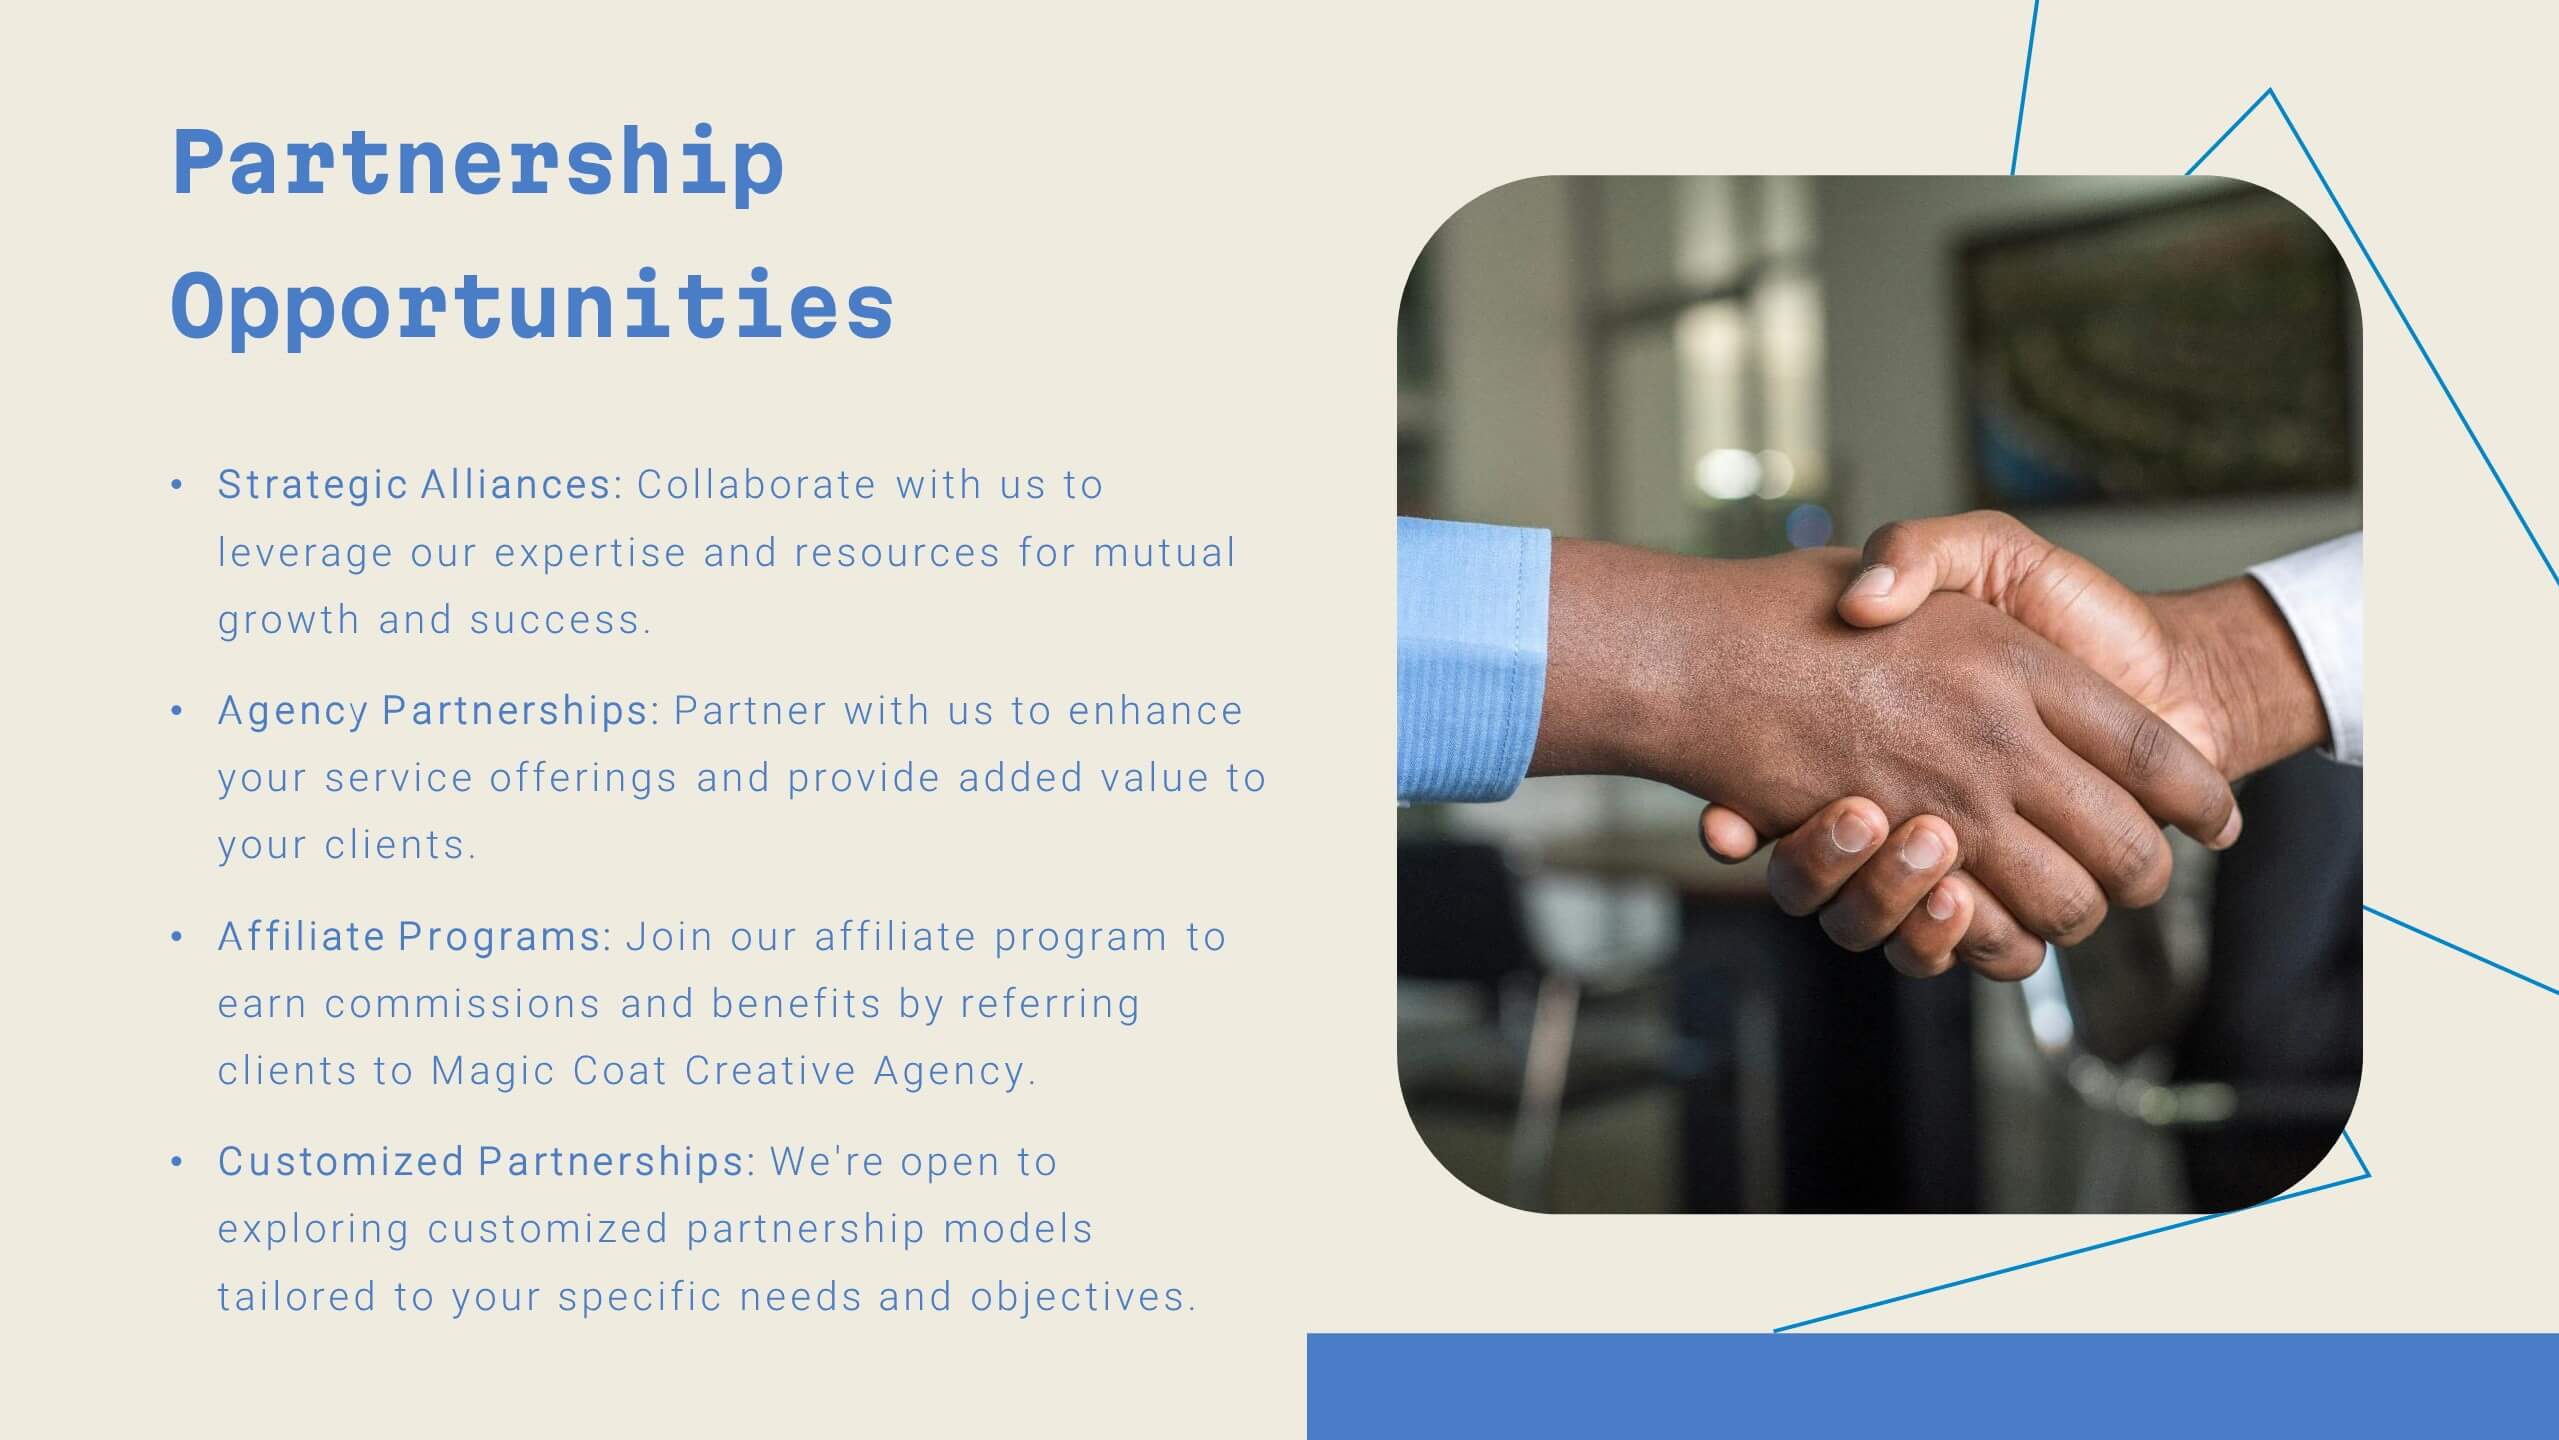
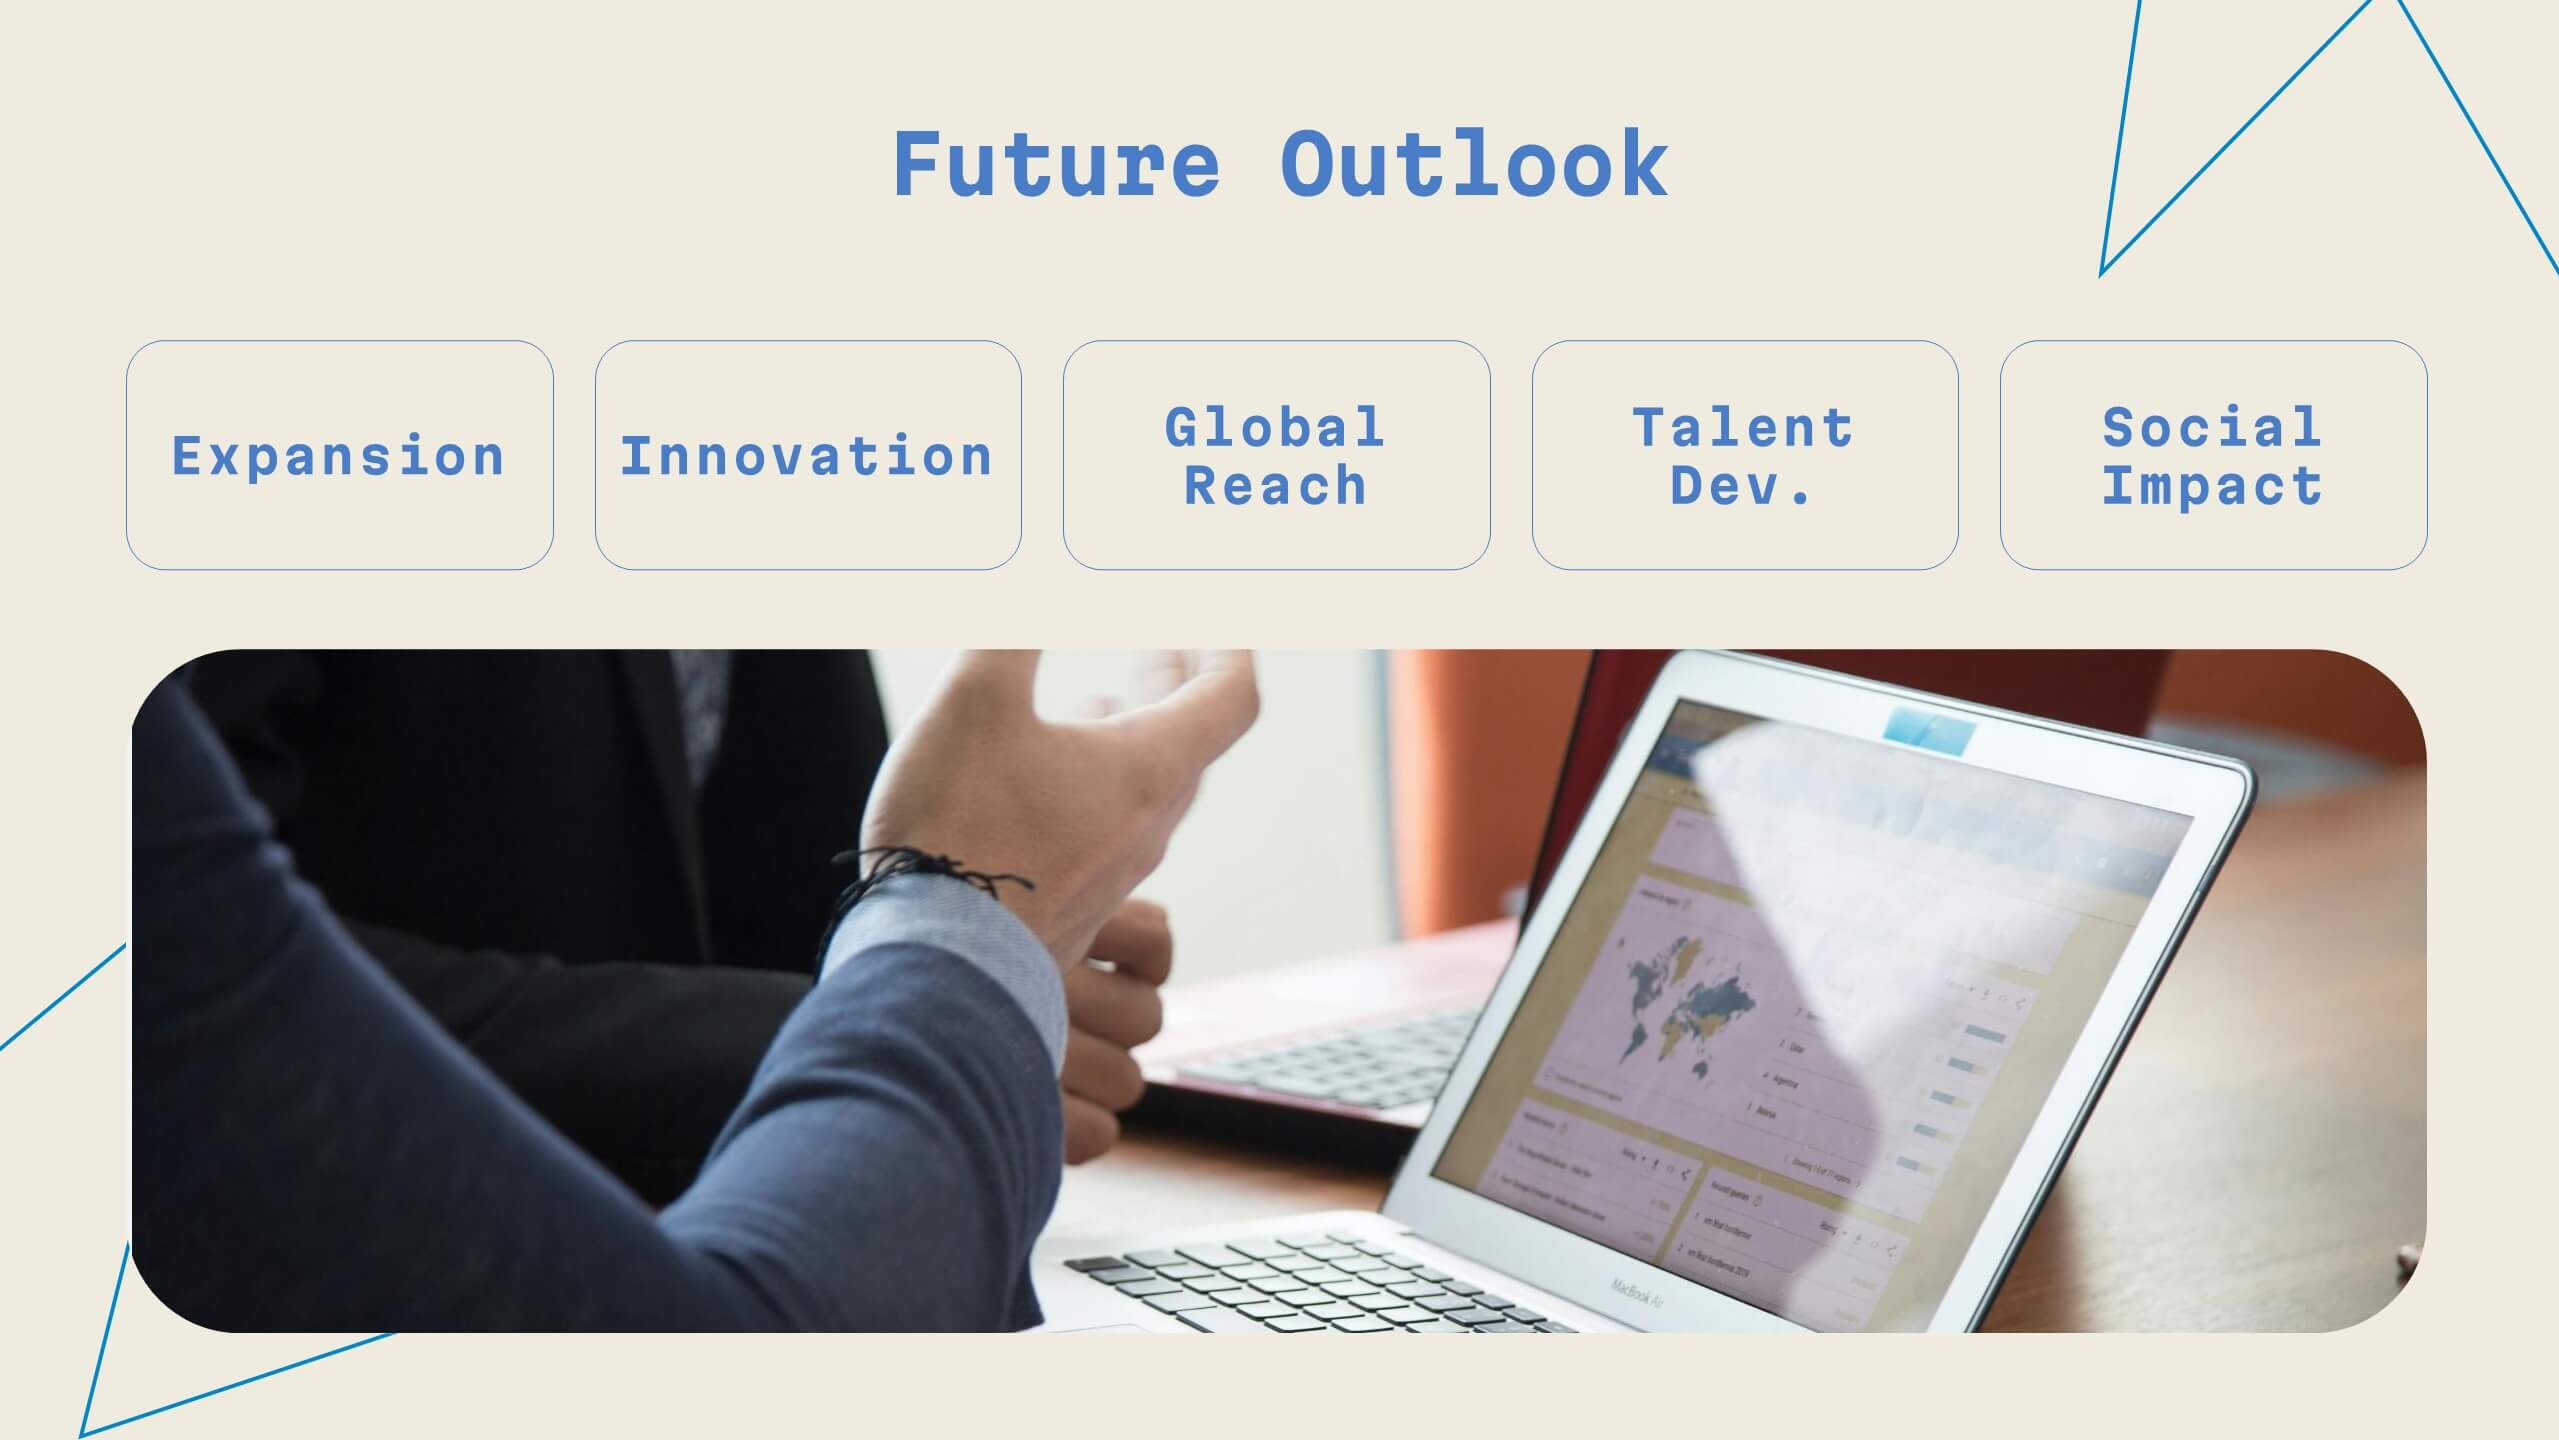
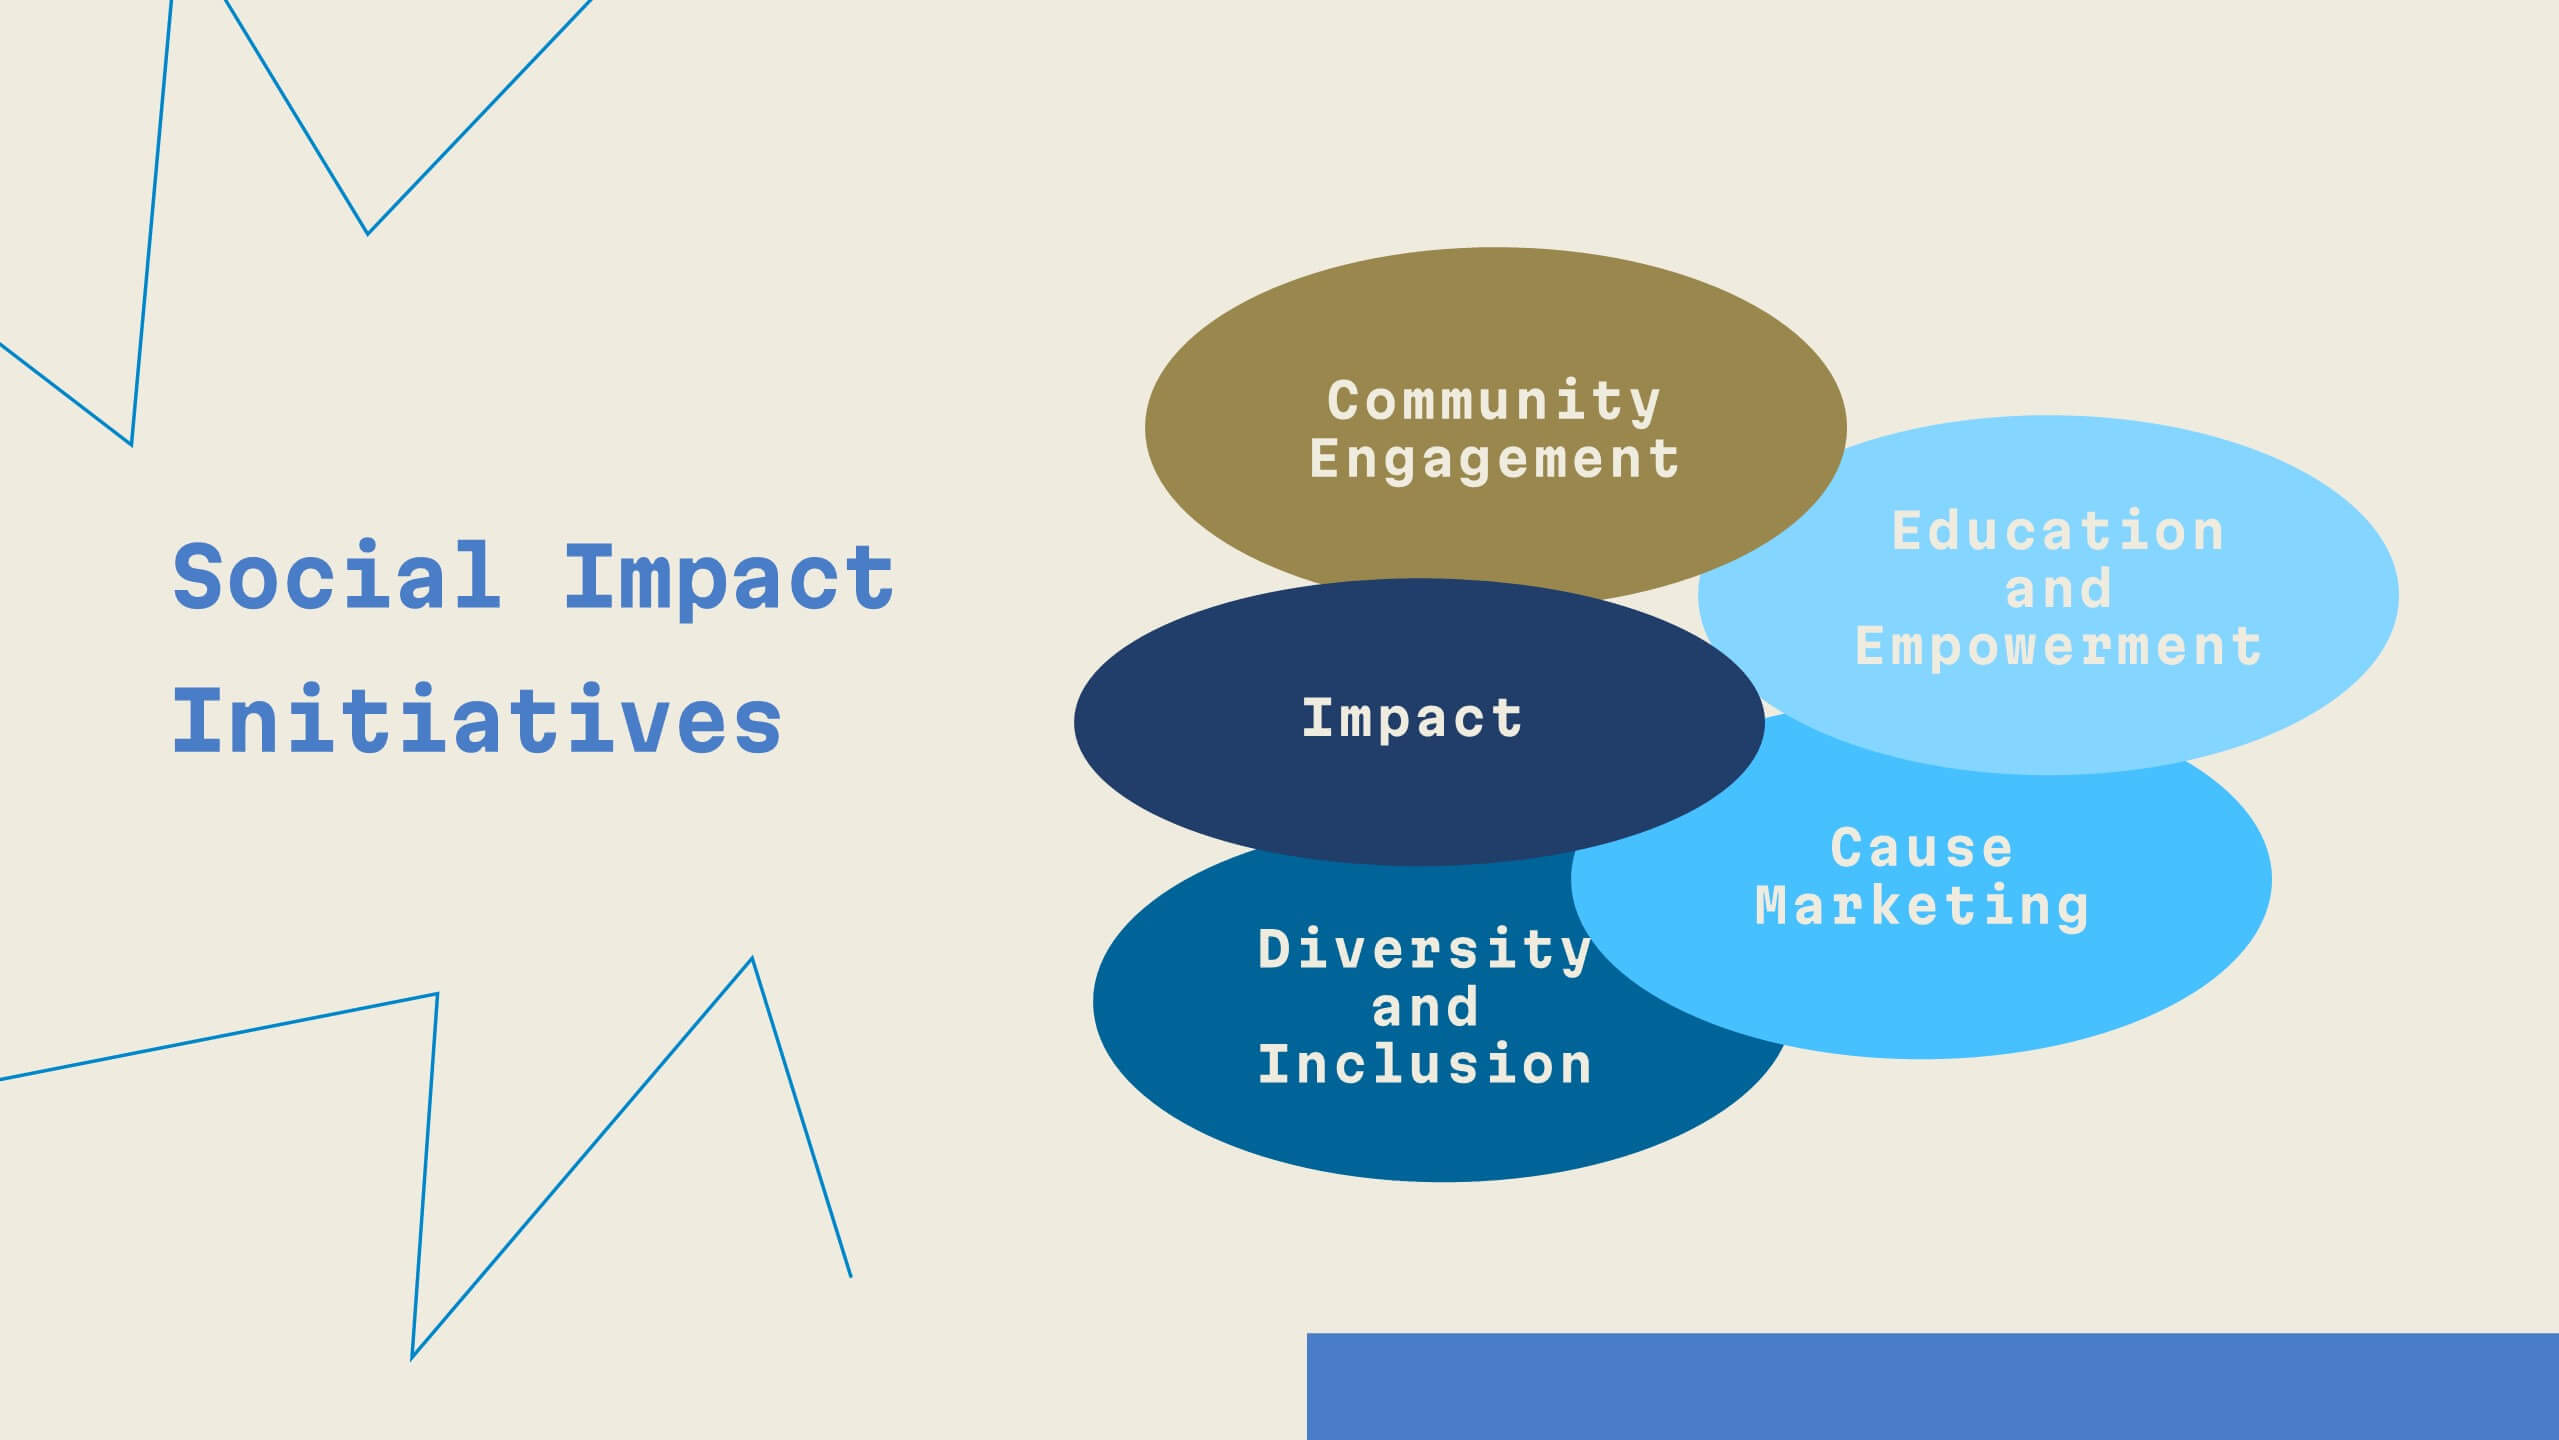
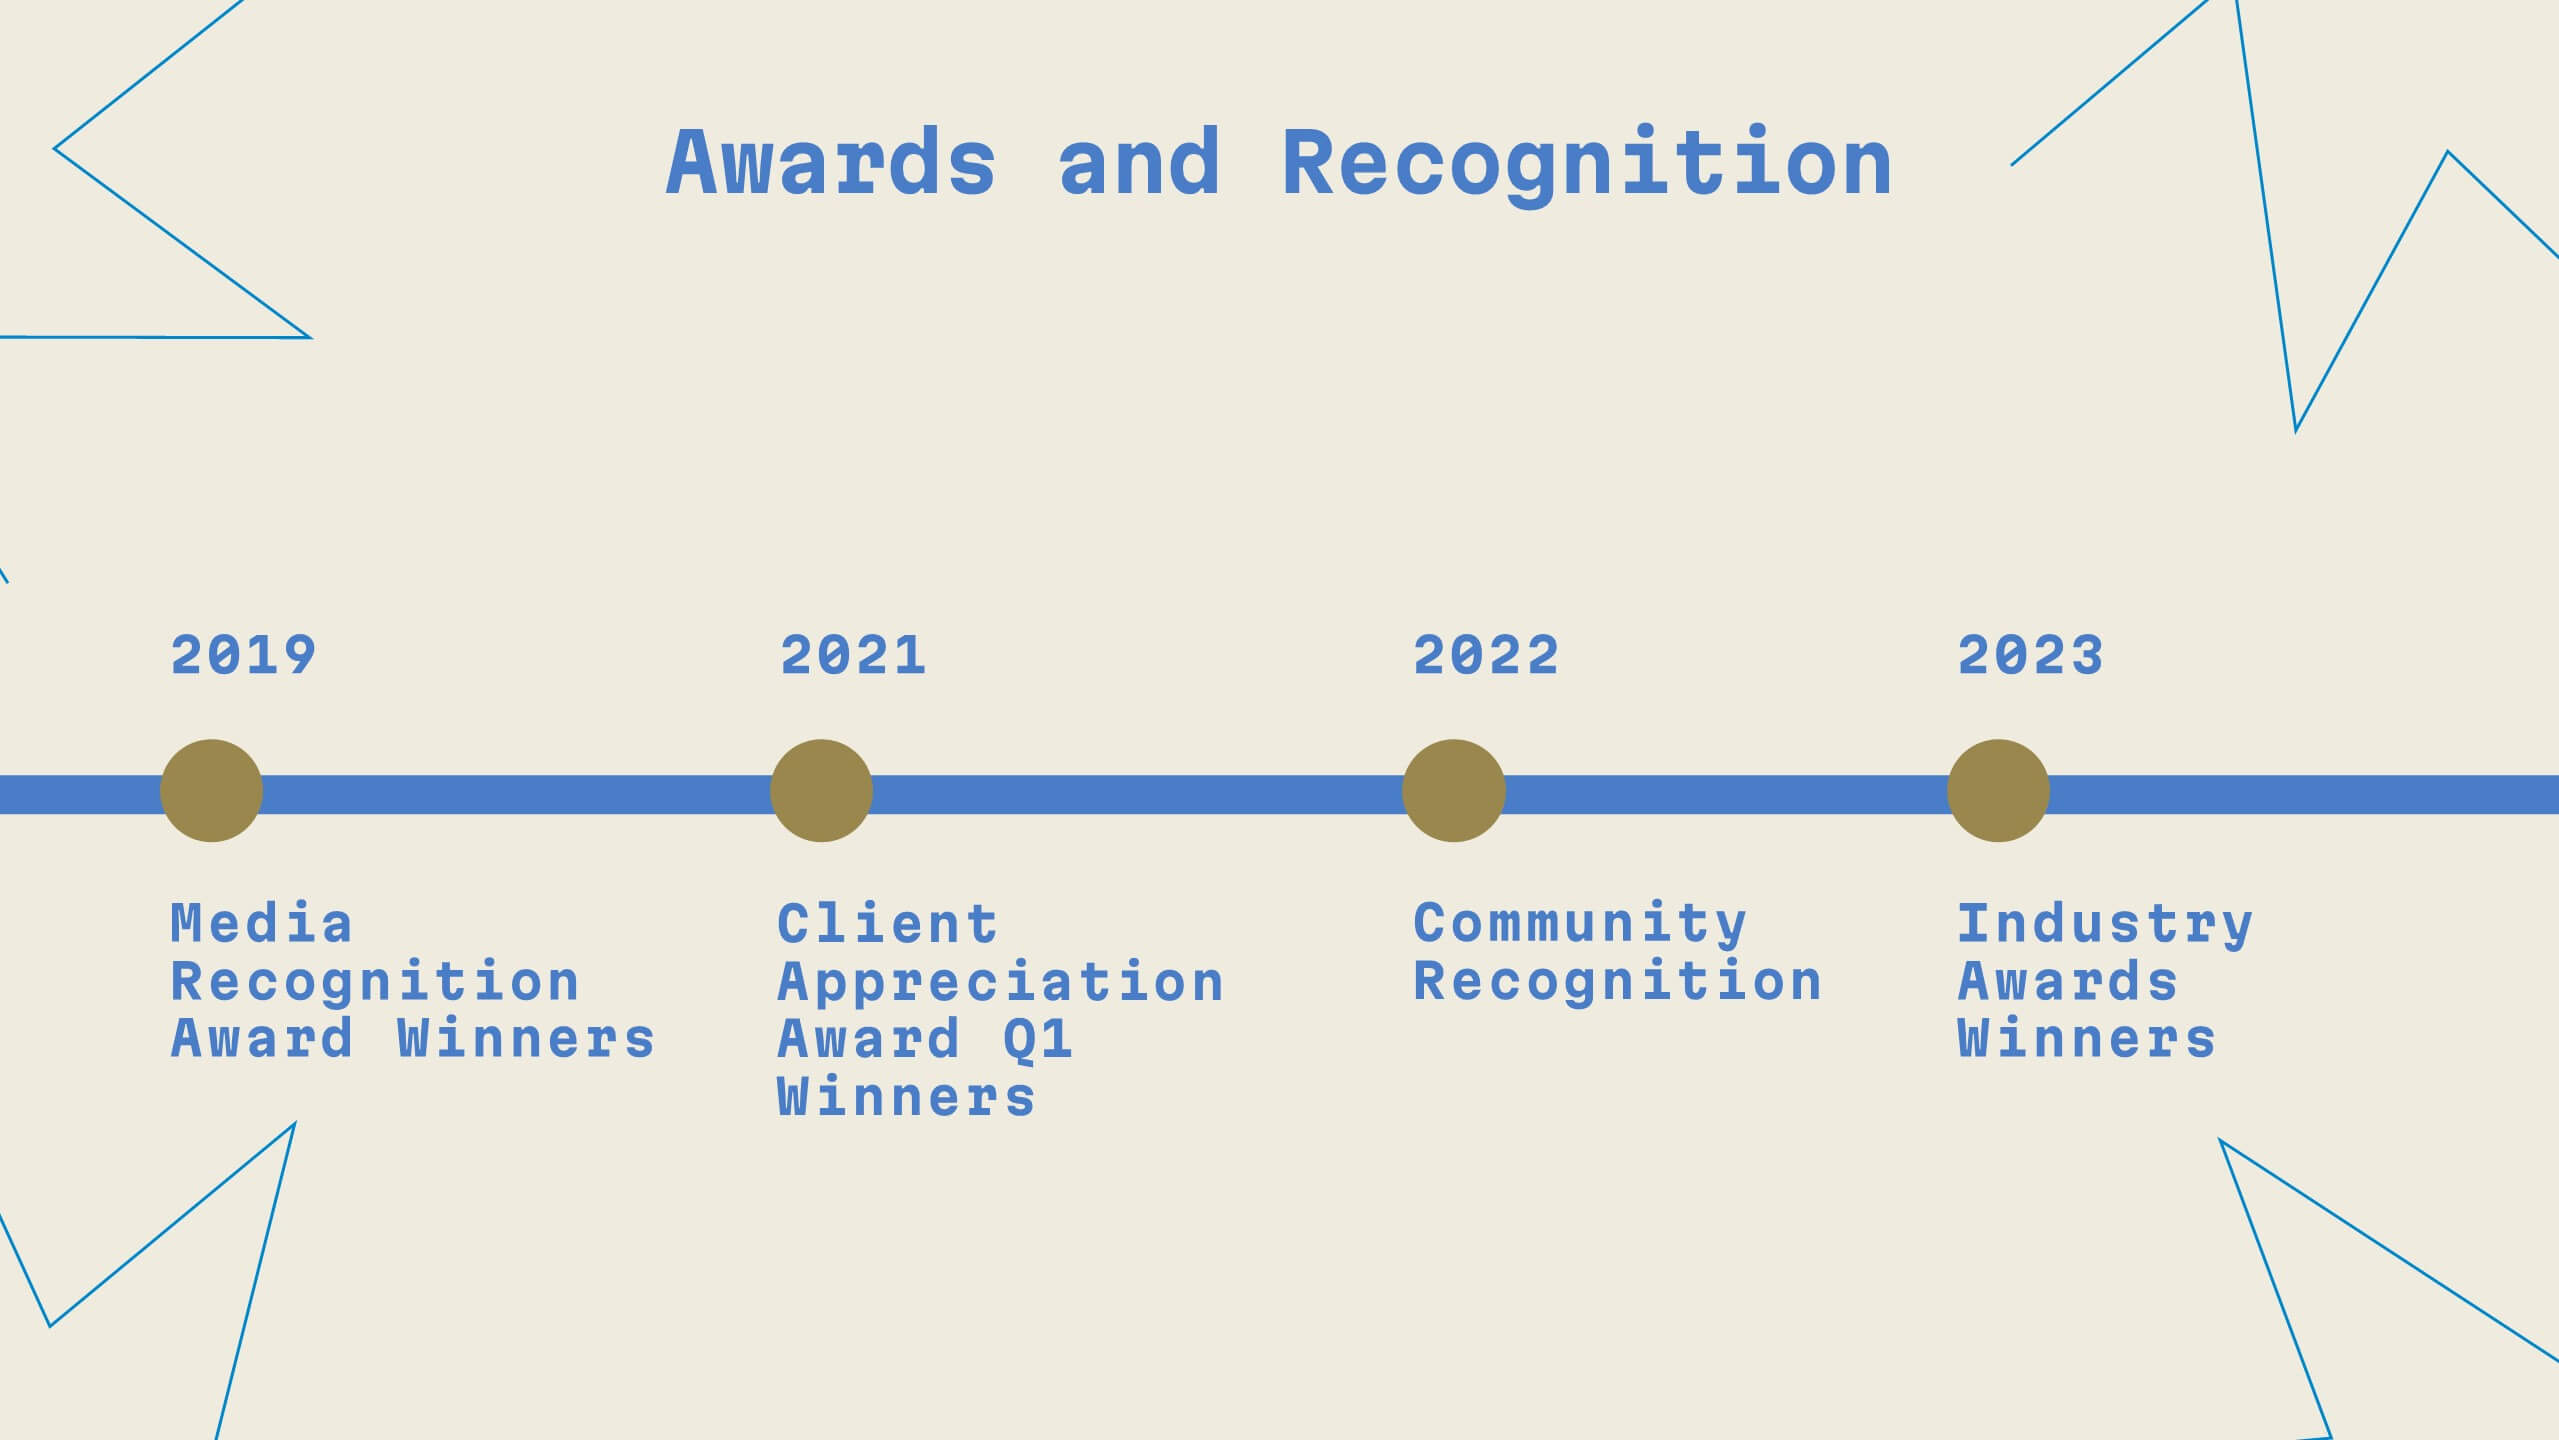
Unity Digital Agency Strategy Plan Presentation
Step into the future of digital marketing with this sleek template! From case studies to strategy development, it offers a comprehensive guide for creating impactful presentations. Highlight client success stories, industry trends, and creative processes with ease. Perfect for showcasing your agency's expertise. Compatible with PowerPoint, Keynote, and Google Slides.


6 slides
Evolution of an Industry Through Time Presentation
Visualize industry transformation with the Evolution of an Industry Through Time Presentation. This timeline-style layout is perfect for highlighting key milestones, technological shifts, or growth stages across decades. Ideal for consultants, educators, or corporate strategists. Fully editable in Canva, PowerPoint, Keynote, and Google Slides for easy adaptation.


6 slides
Geographic Asia Overview Template Presentation
Discover insights across Asia with a clean, professional layout that brings your regional data to life. Perfect for showcasing demographics, market distribution, or geographic highlights, this visual map design ensures clarity and impact in every slide. Fully compatible with PowerPoint, Keynote, and Google Slides for effortless editing and presentation.