


Features
- 6 Unique slides
- Fully editable and easy to edit in Microsoft Powerpoint, Keynote and Google Slides
- 16:9 widescreen layout
- Clean and professional designs
- Export to JPG, PDF or send by email


Do you have any questions?
Recommend


7 slides
Artificial Intelligence Presentation Template
An Artificial Intelligence infographic is a visual representation of information related to AI. This high-definition infographic is completely customizable and will allow you to see advances in AI and other networks. Artificial Intelligence, is evolving rapidly. It's important that we understand what's going on so that we can ensure the future of this technology is beneficial to society. In this informative infographic, you will be able to learn and inform about everything from the difference between artificial intelligence and the differences between expert systems by adding you own data.


7 slides
SCRUM Roles Infographic
Dive into the agile world with our SCRUM roles infographic. This template is designed to depict the various roles within the SCRUM framework, offering clarity and insight into the collaborative heart of agile methodologies. With a clean white canvas set against hues of blue, it provides a modern yet comprehensive overview of the roles. Ideal for agile coaches, trainers, and organizations transitioning to agile methodologies, this infographic is tailored to showcase the importance of each role. With its compatibility, spanning PowerPoint, Keynote, and Google Slides, presentations are bound to be a breeze, regardless of the platform you favor.


7 slides
Design Mockup Infographic
Present your creative projects with precision and style using this collection of design mockup templates. Each template is expertly crafted to showcase your graphic designs, digital art, or branding projects across multiple devices and settings, emphasizing both detail and context. Featuring sleek, modern layouts, these mockups integrate vibrant color schemes and dynamic typography to make your designs pop. Ideal for graphic designers, marketers, and creative agencies, these templates provide a professional setting for presenting web designs, app interfaces, and other digital products to clients and stakeholders. Customize these templates with ease, adding your own images and text to tailor the mockups to your specific project needs. Whether you're creating a portfolio, client presentation, or marketing materials, these mockups will help you display your work in the most effective and engaging way.


5 slides
HIV Prevention & Awareness Infographics
HIV Prevention and Awareness play a crucial role in combating the spread of the virus and reducing the impact of HIV/AIDS on individuals and communities. These infographic templates are designed to educate and raise awareness about HIV prevention and promote safer behaviors. These infographics provide a visually compelling way to present key information, statistics, and strategies related to HIV prevention and awareness. The templates features a range of eye-catching charts and icons that can be easily customized to suit your specific needs. Compatible with PowerPoint, Keynote, and Google Slides.


26 slides
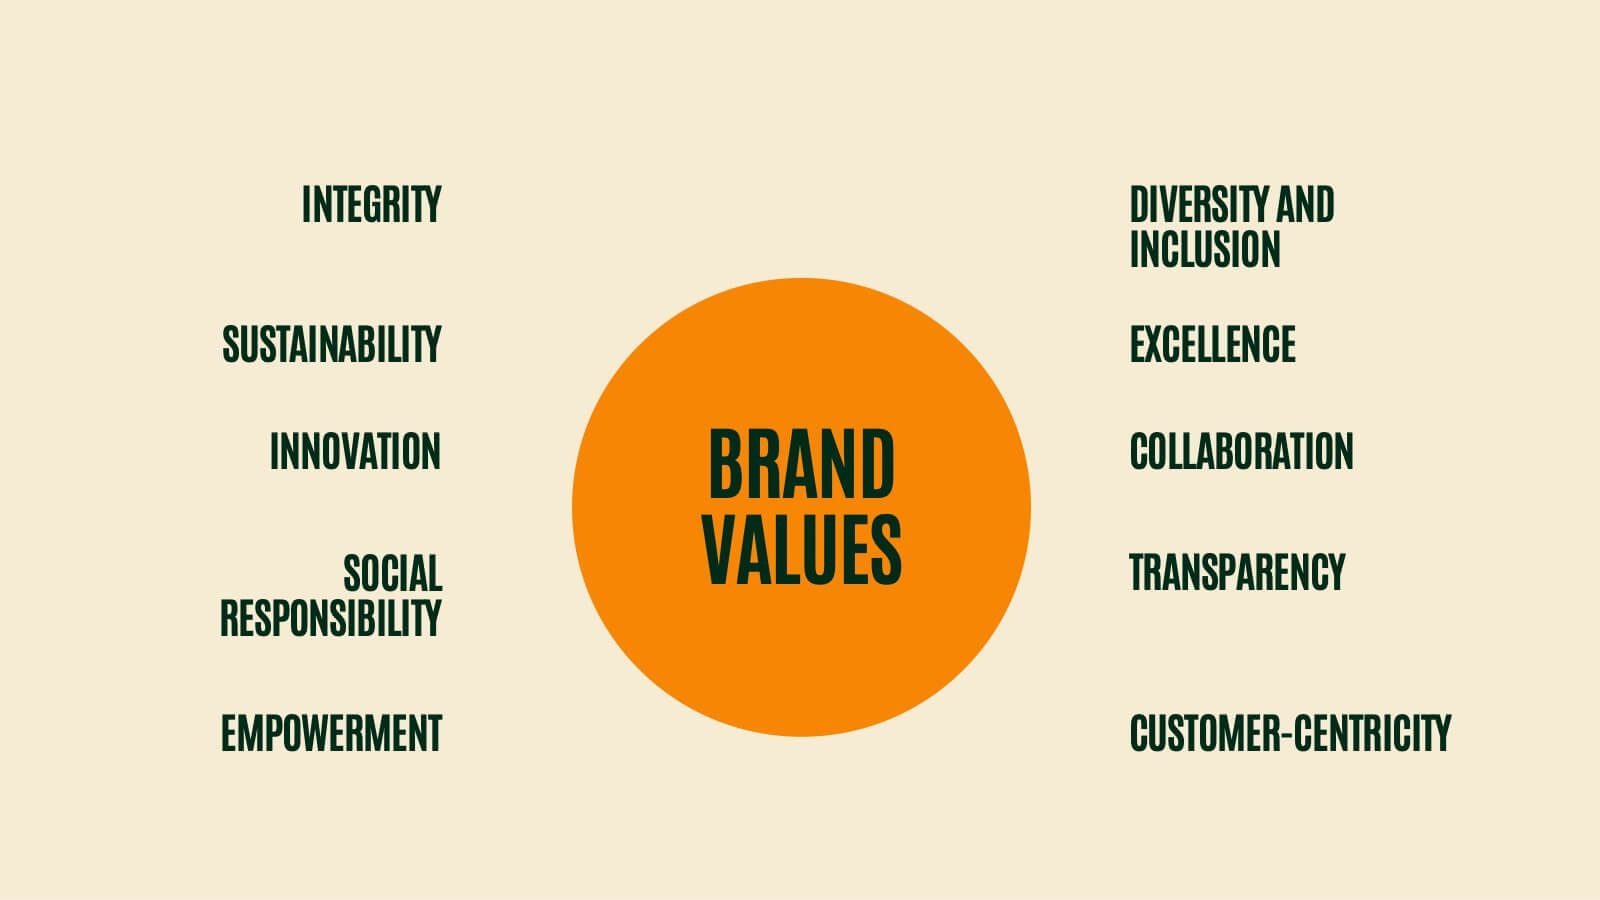
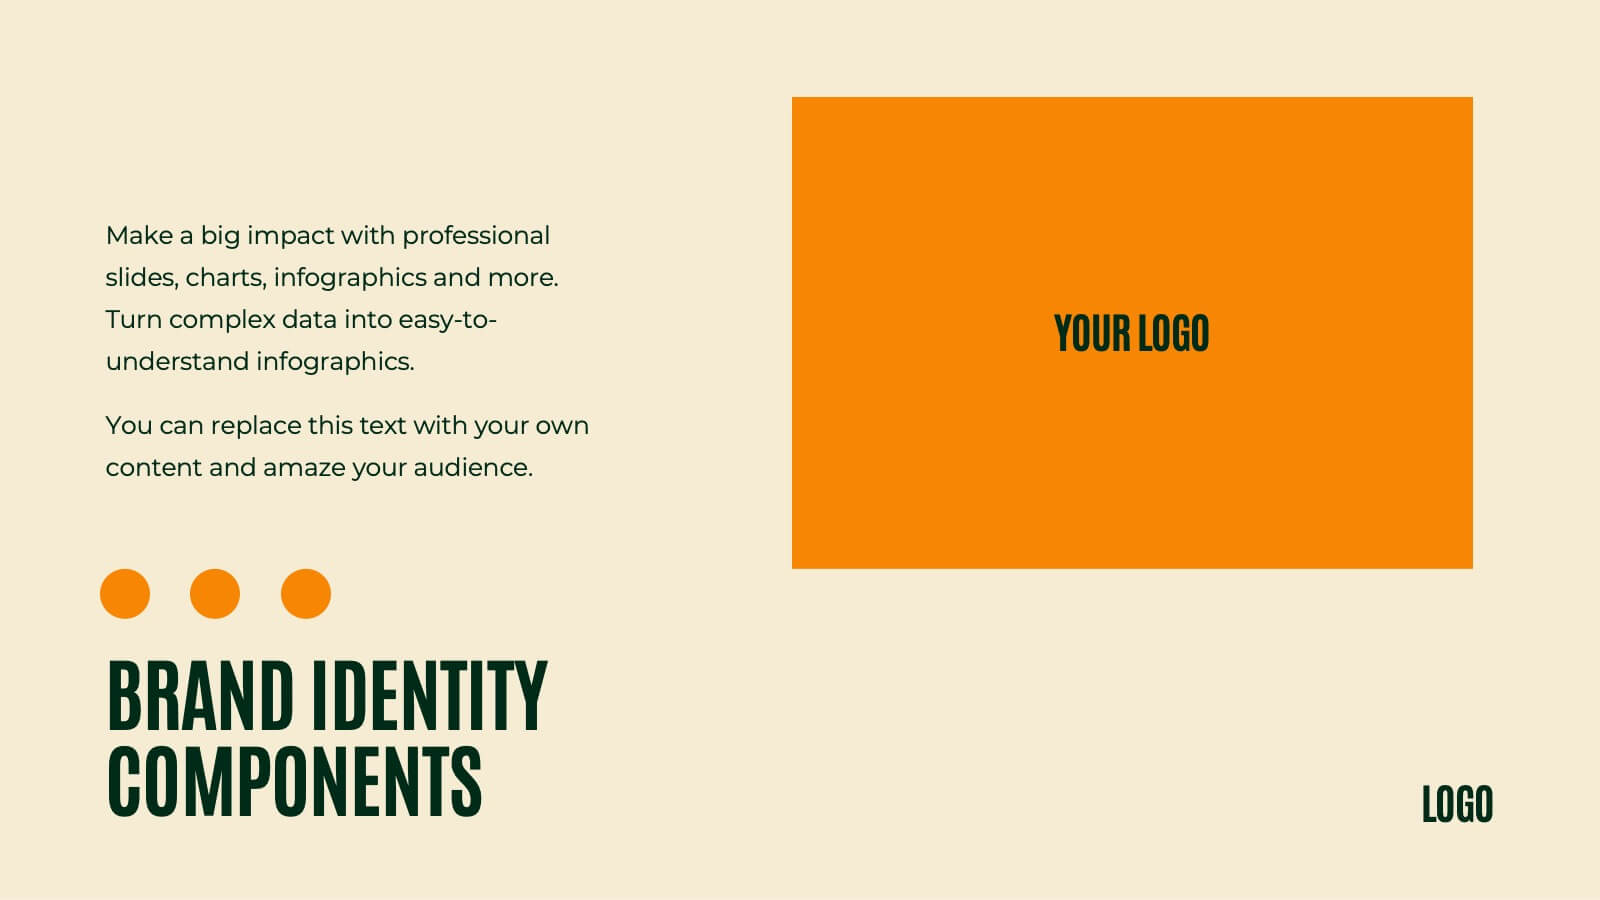
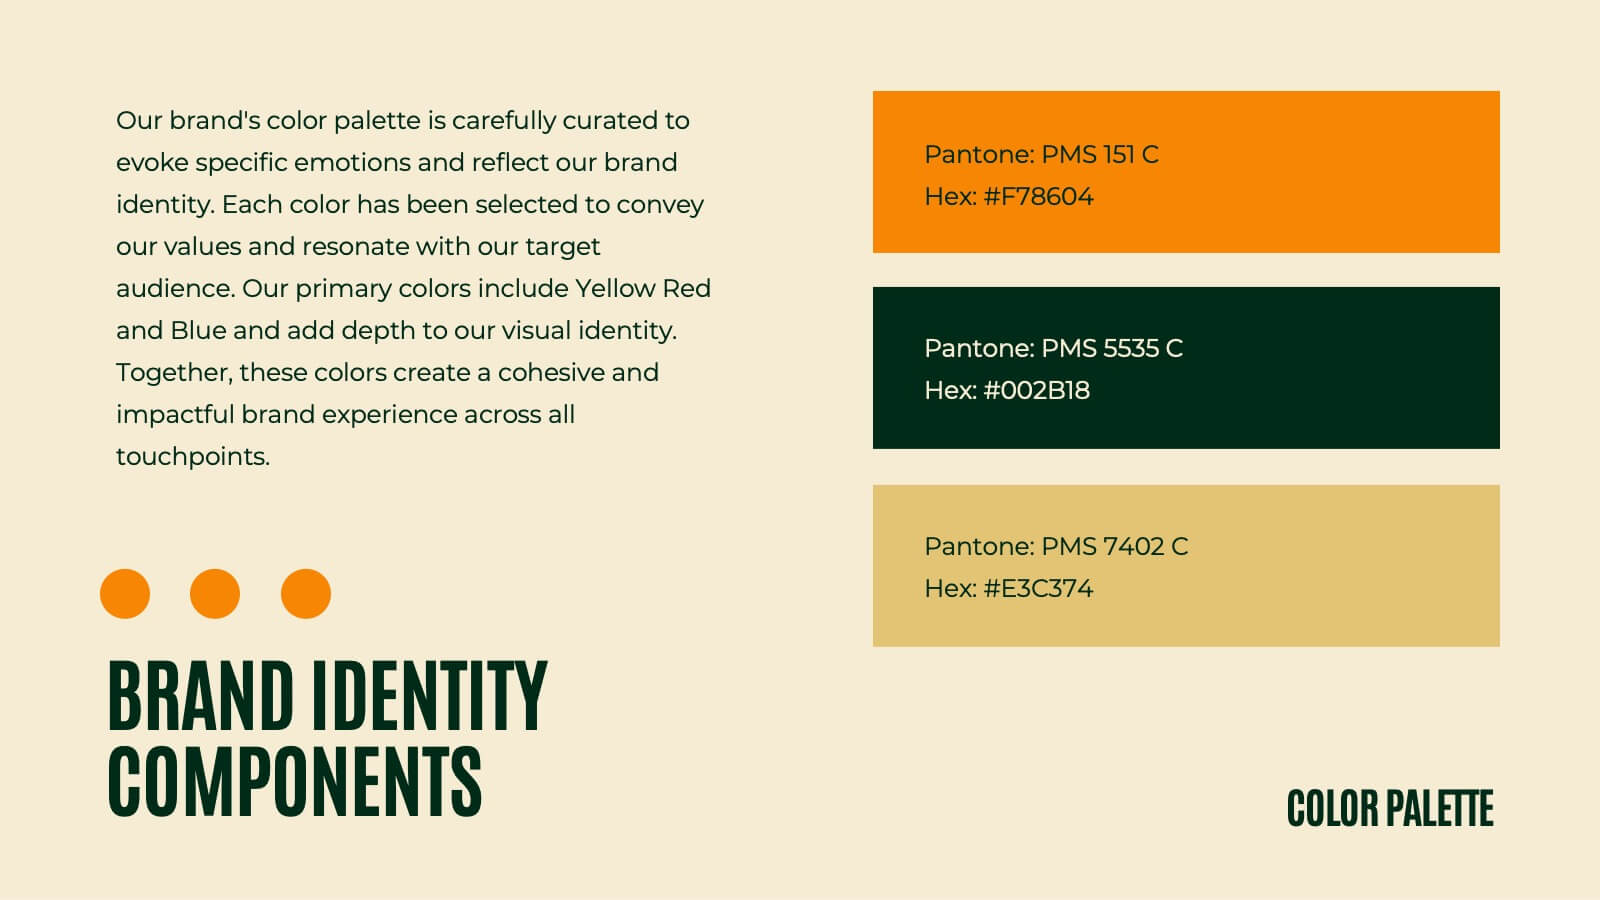
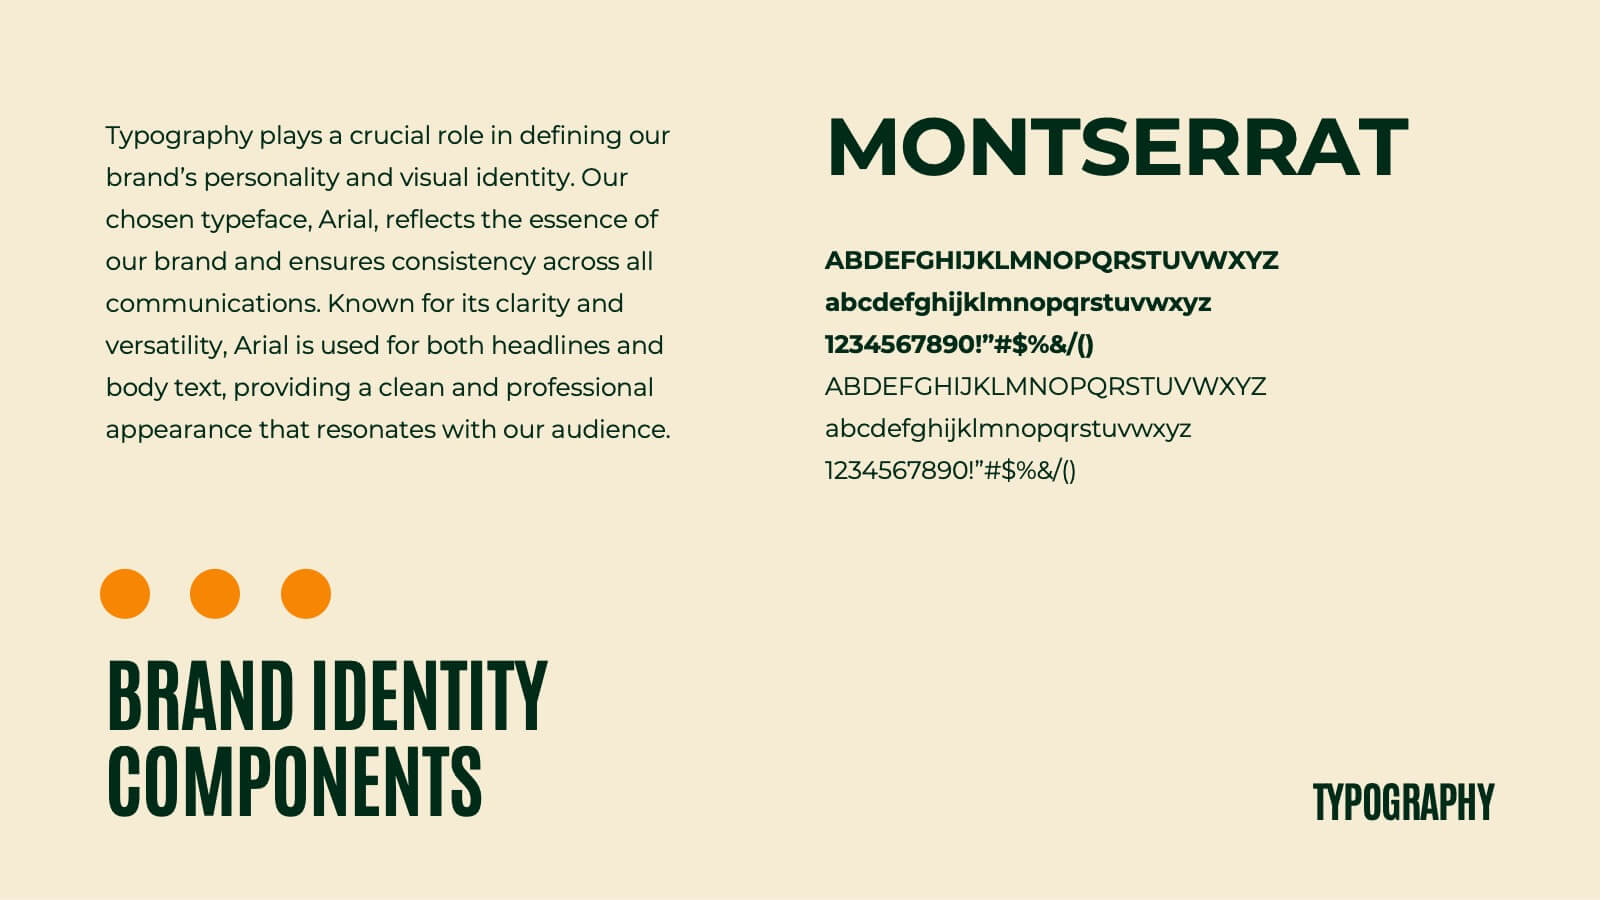
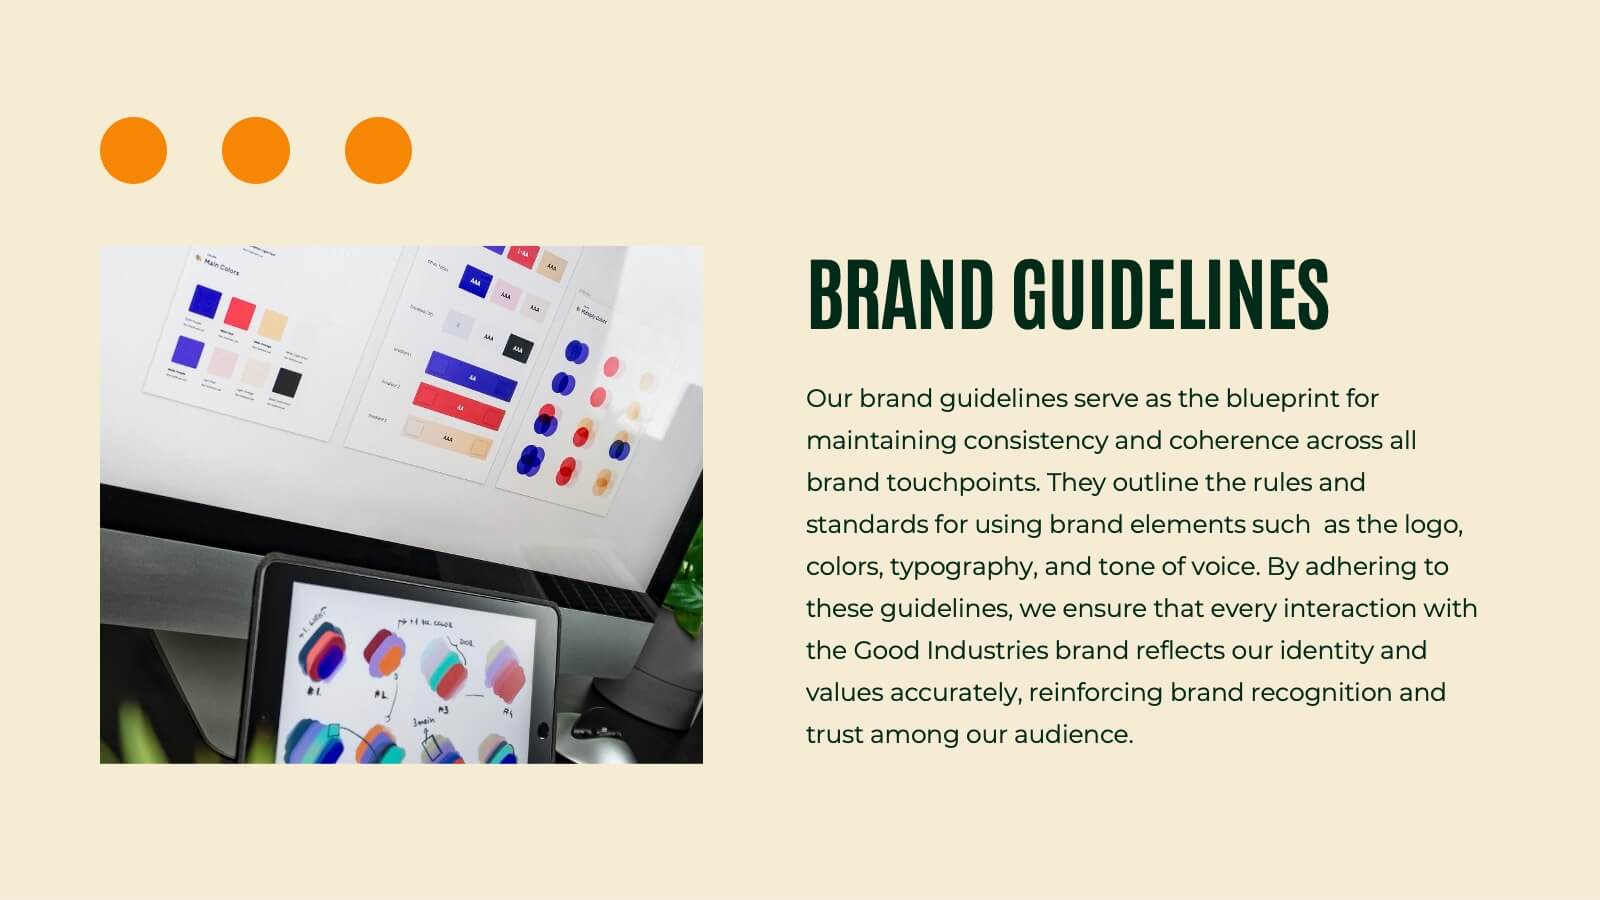
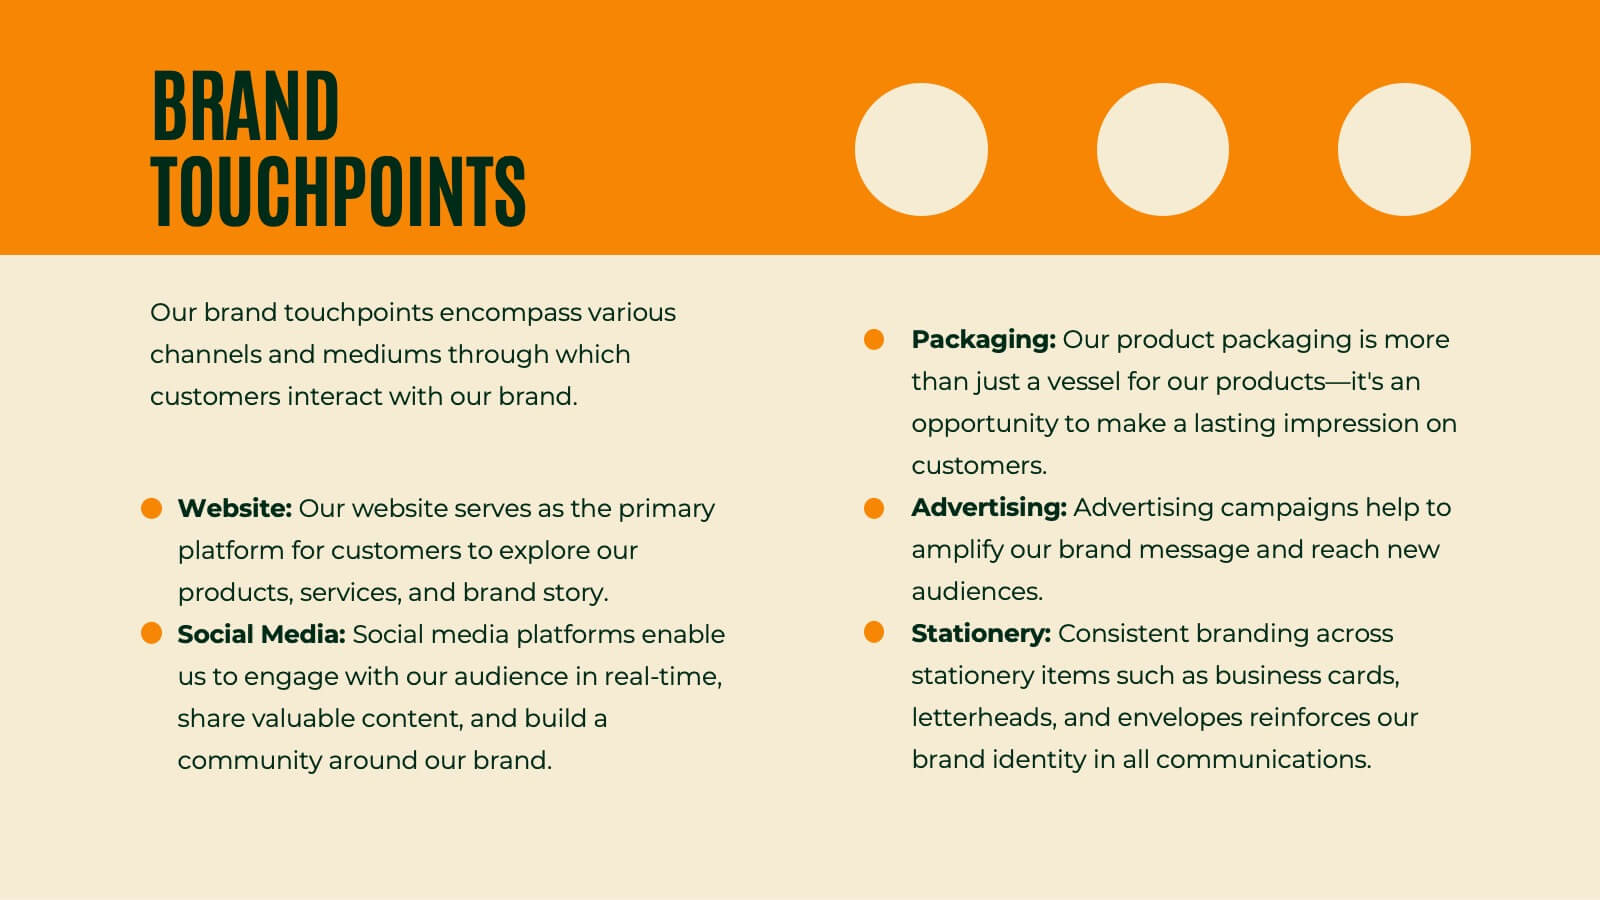
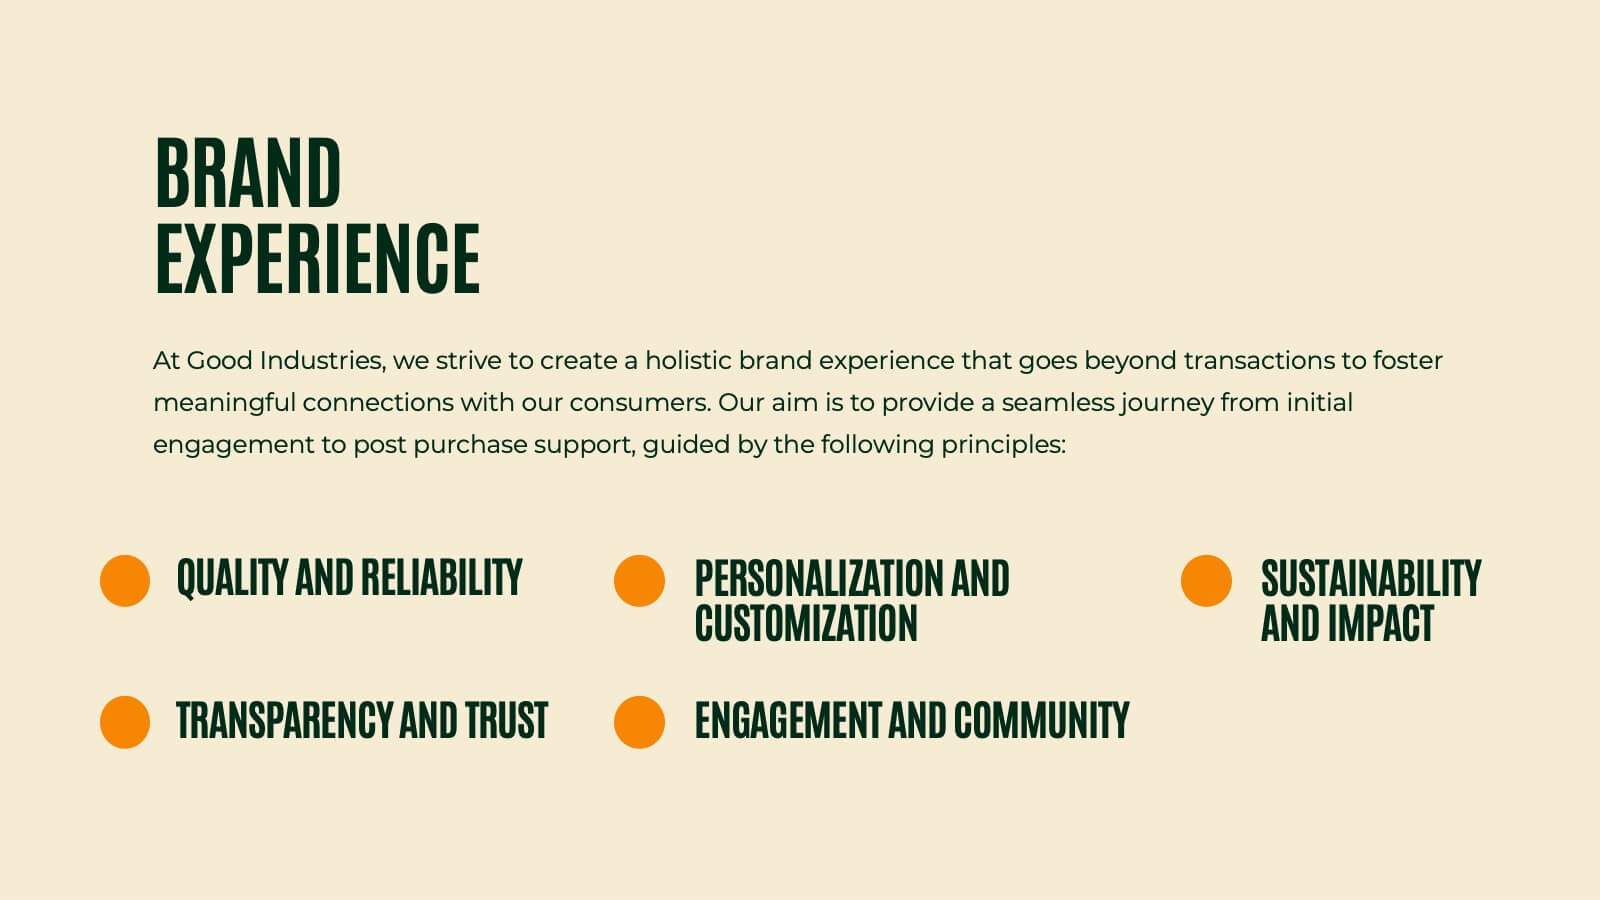
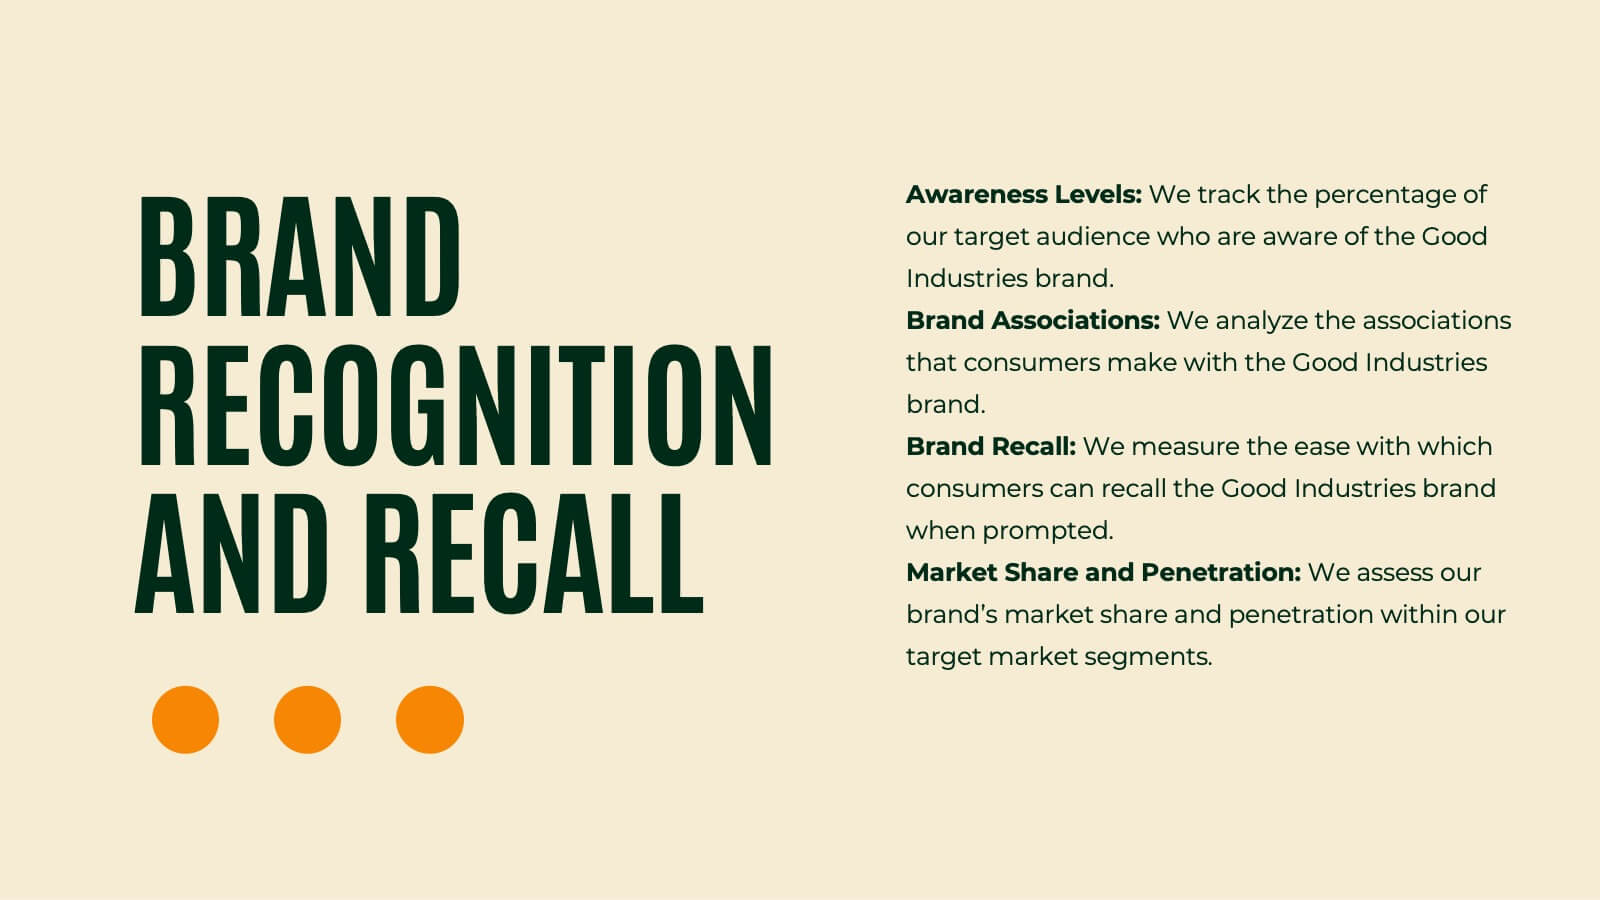
Tempo Brand Identity Presentation
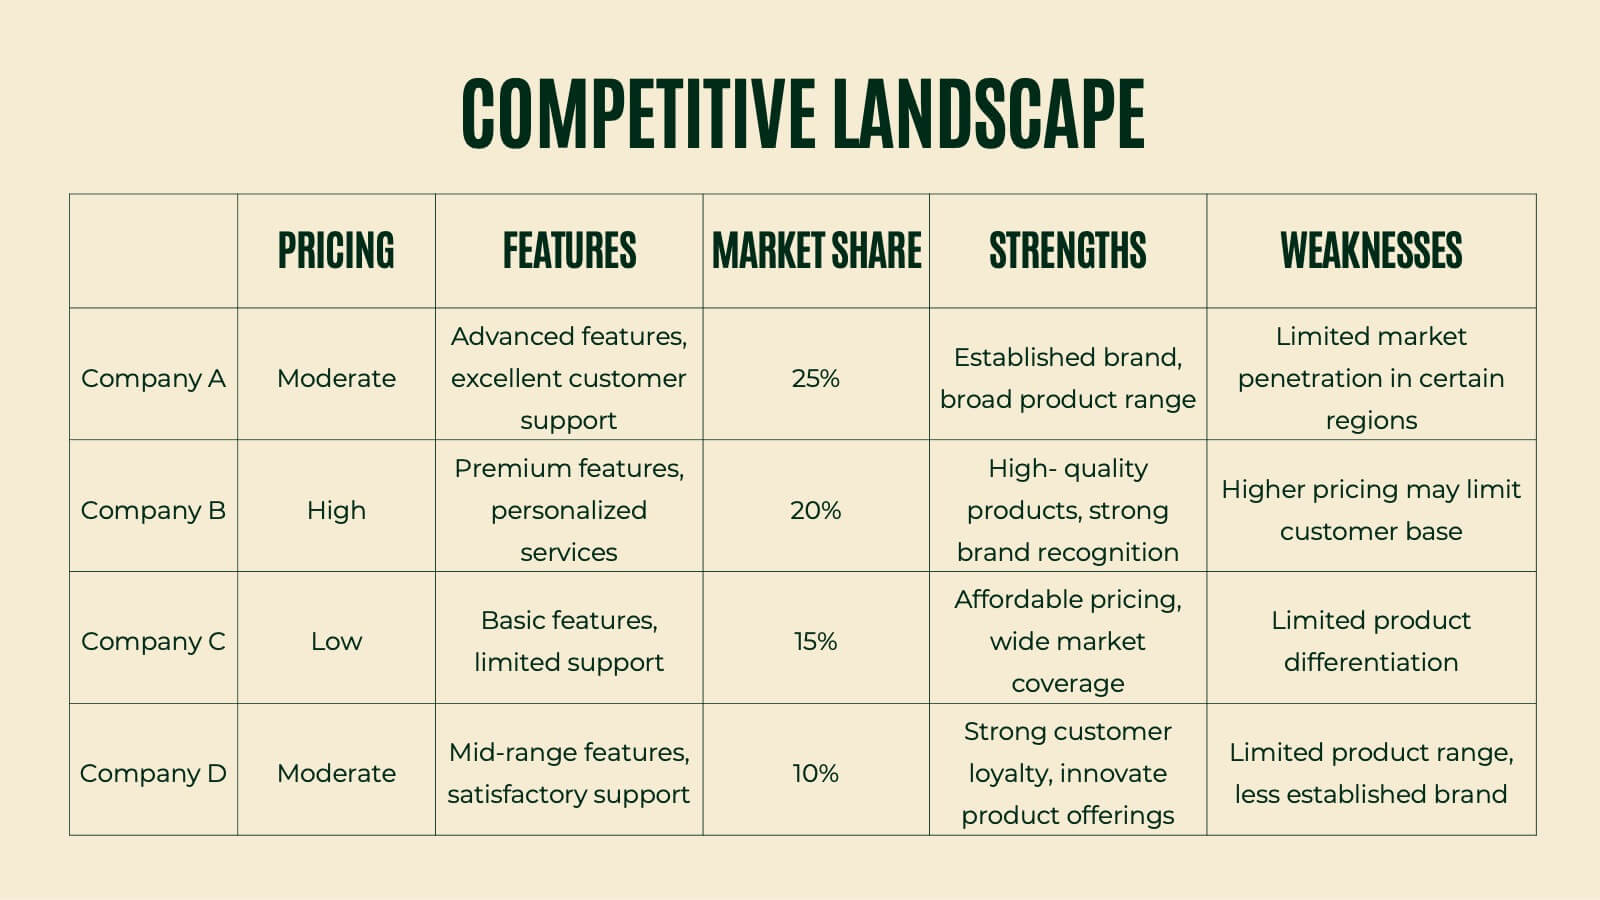
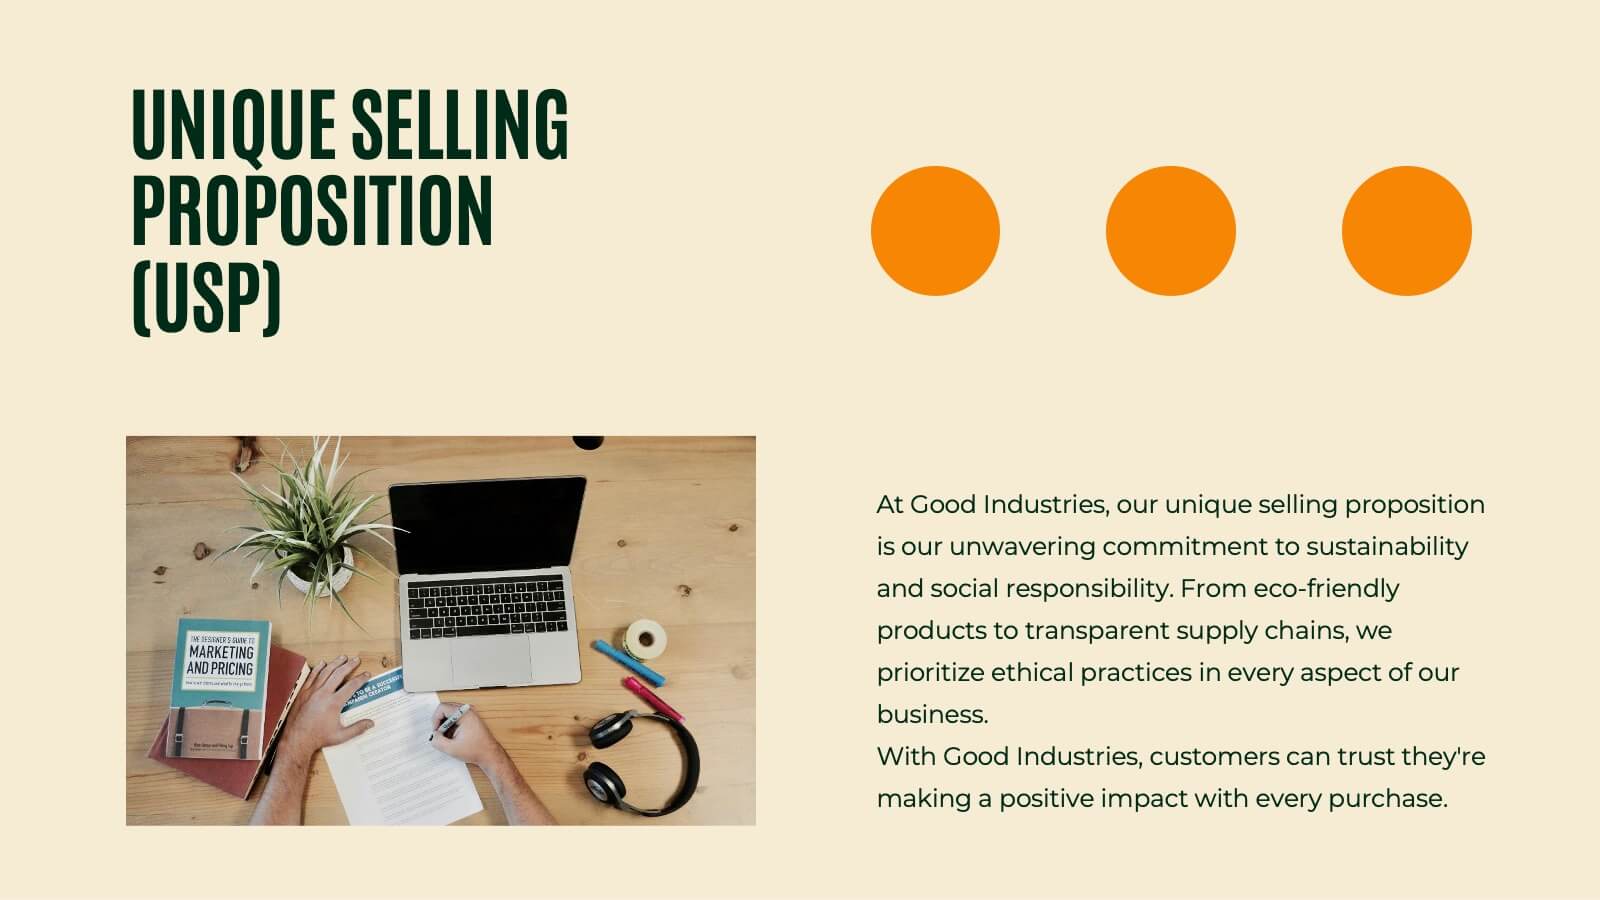
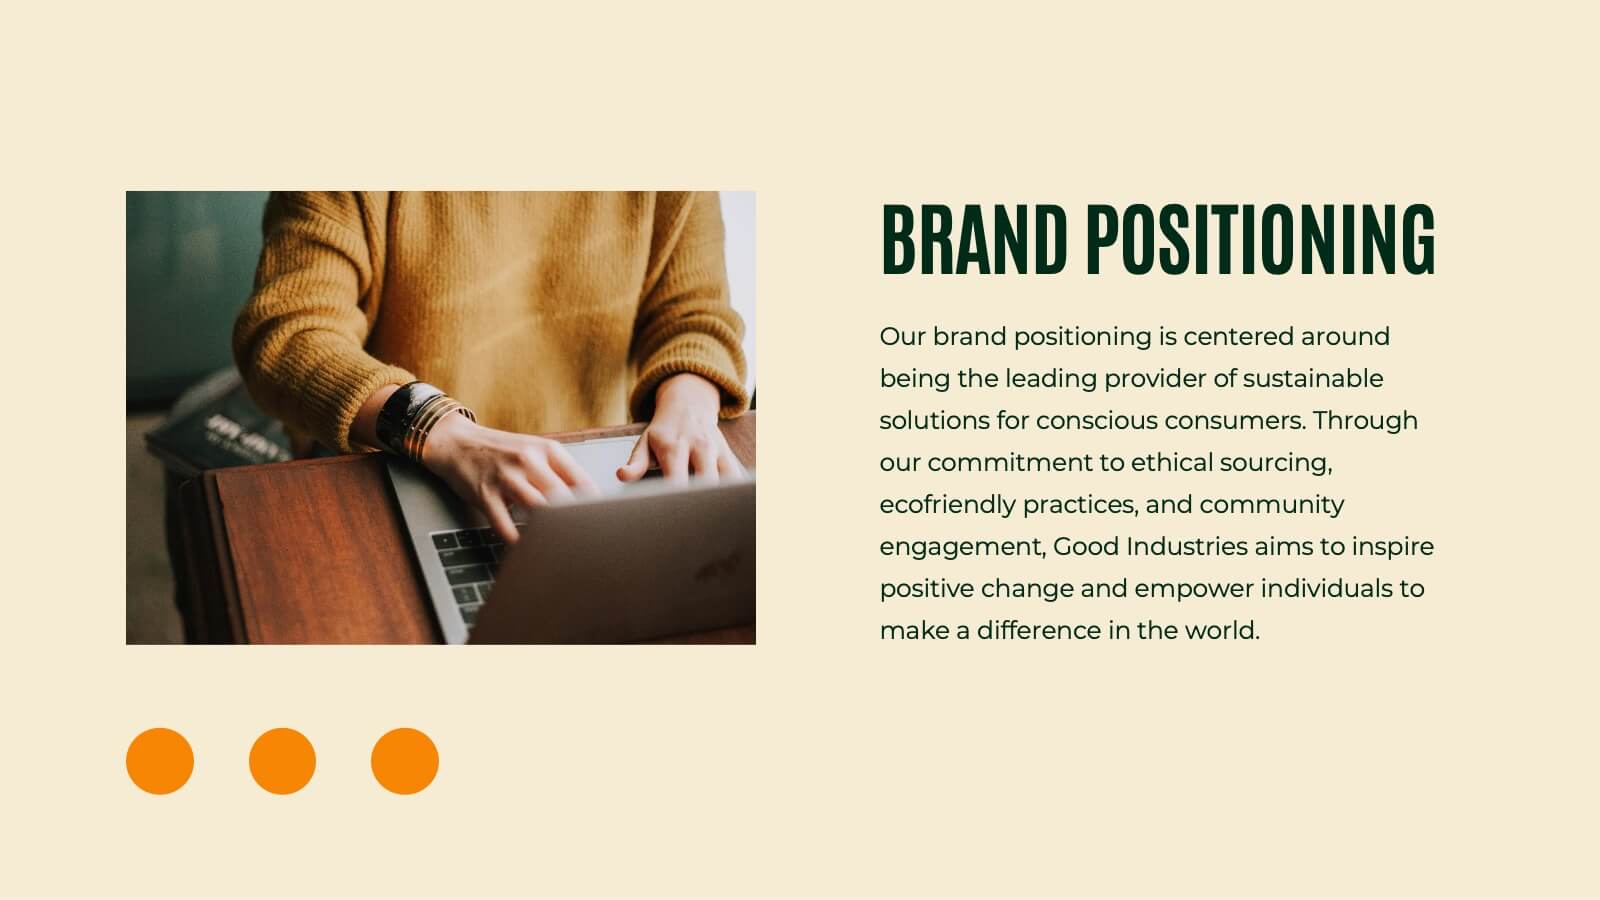
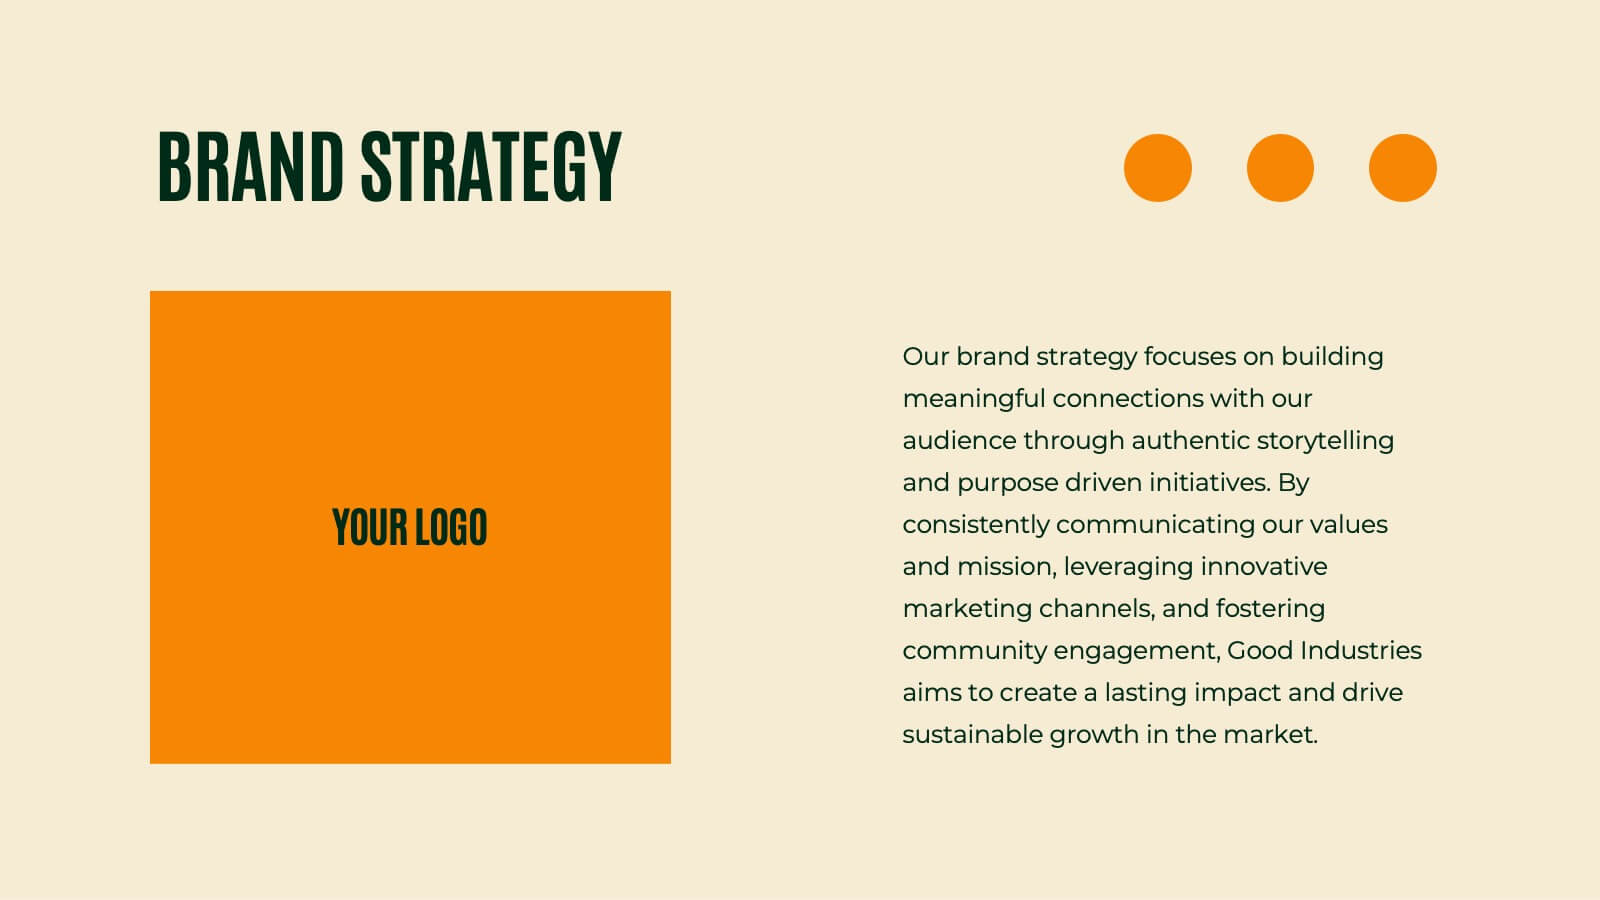
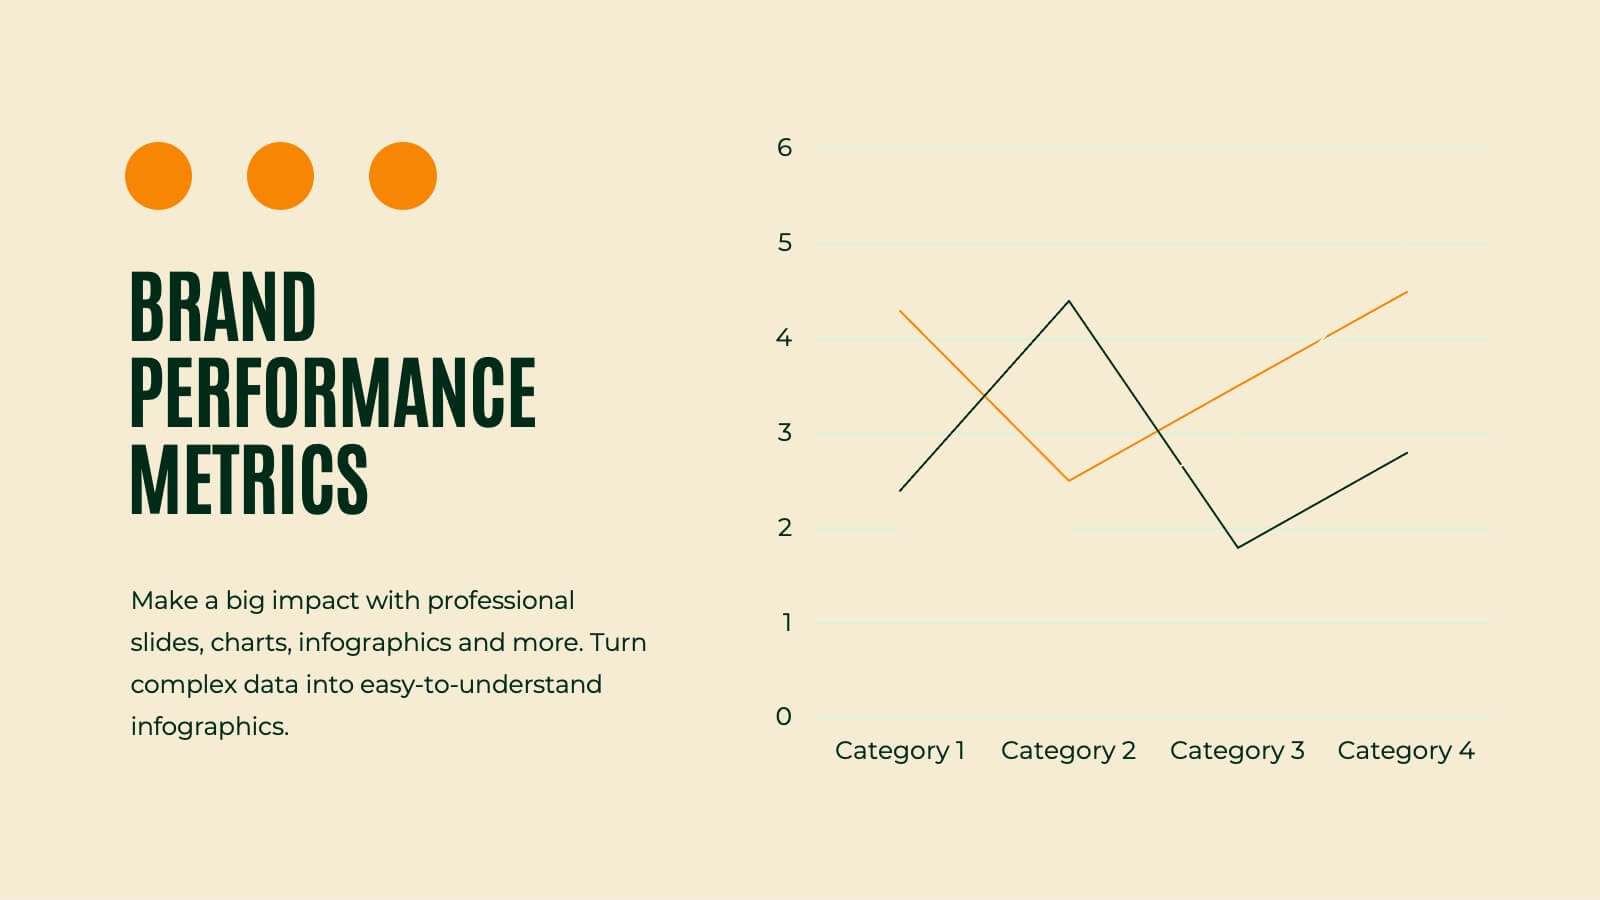
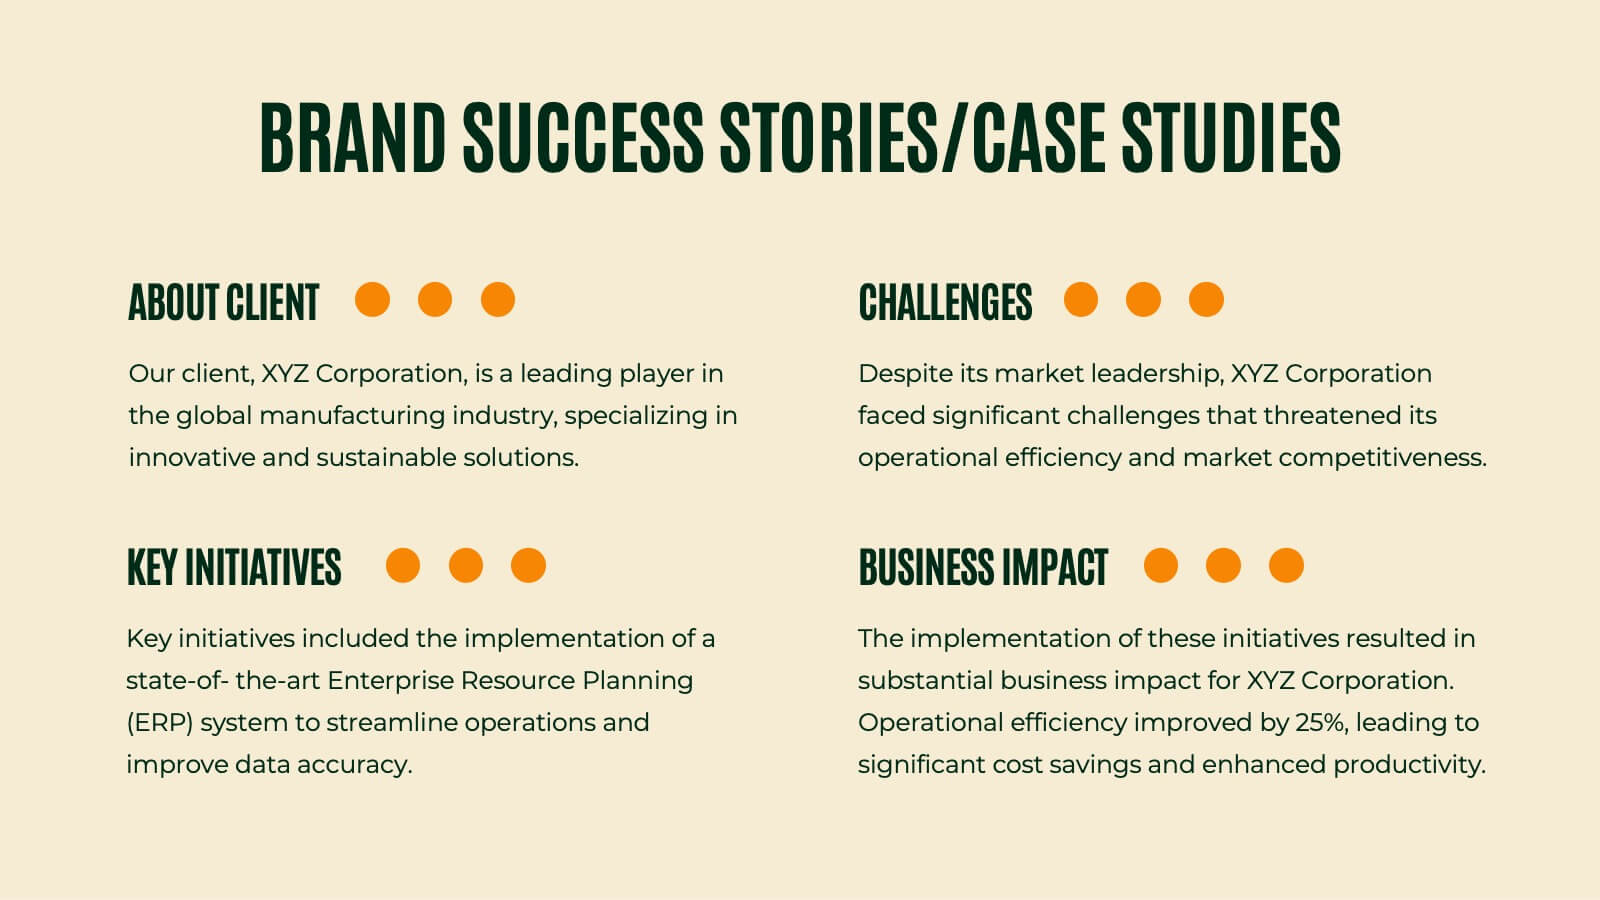
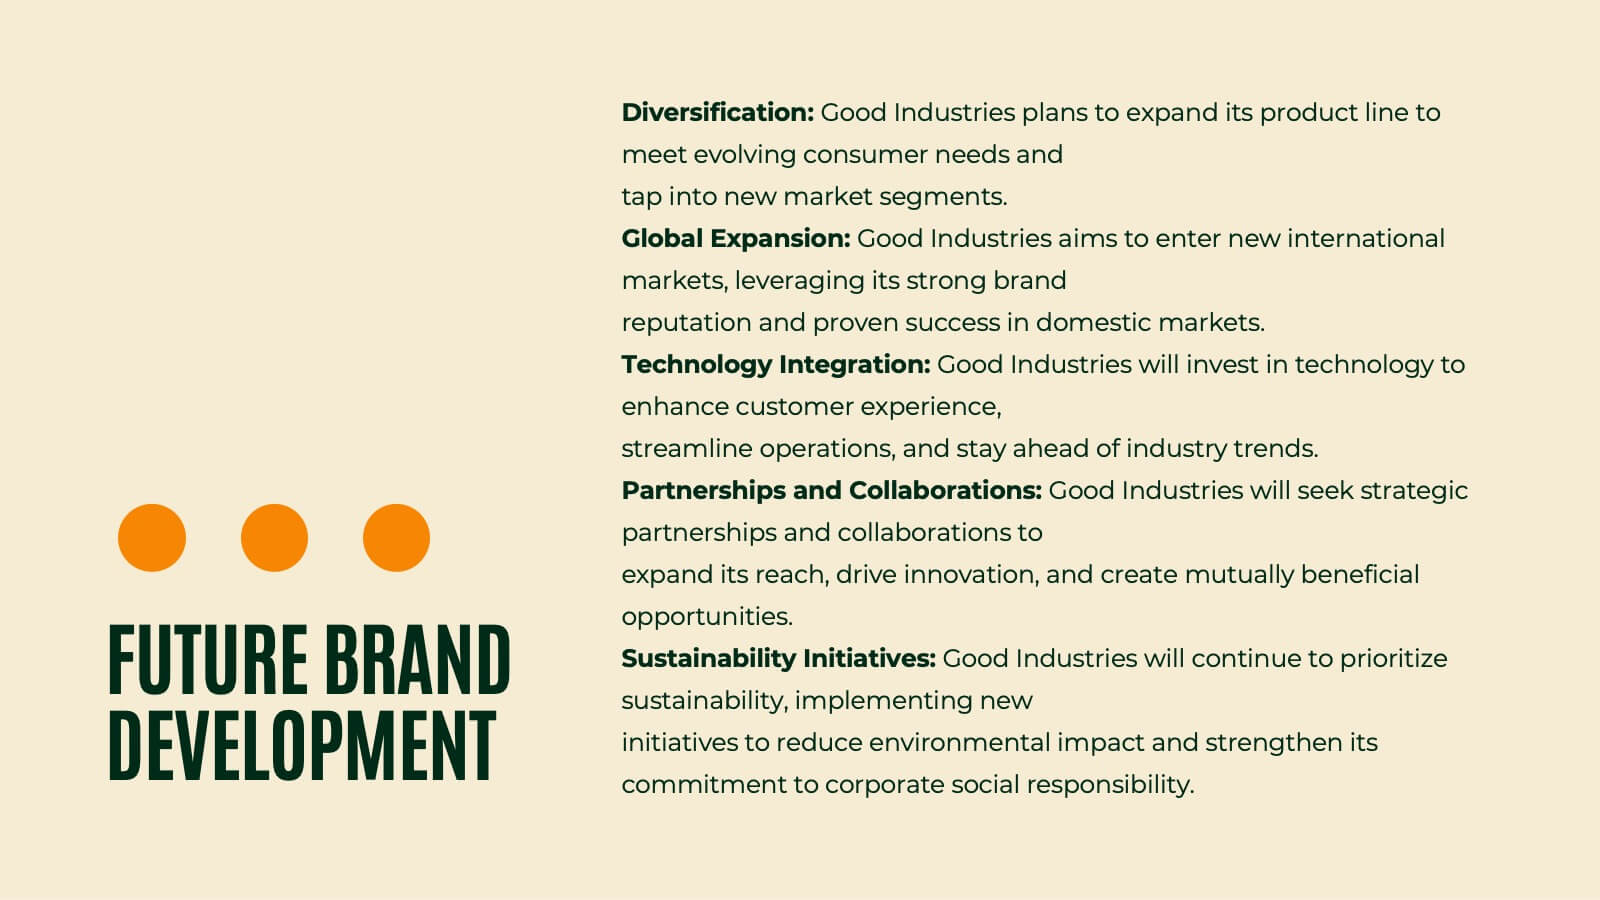
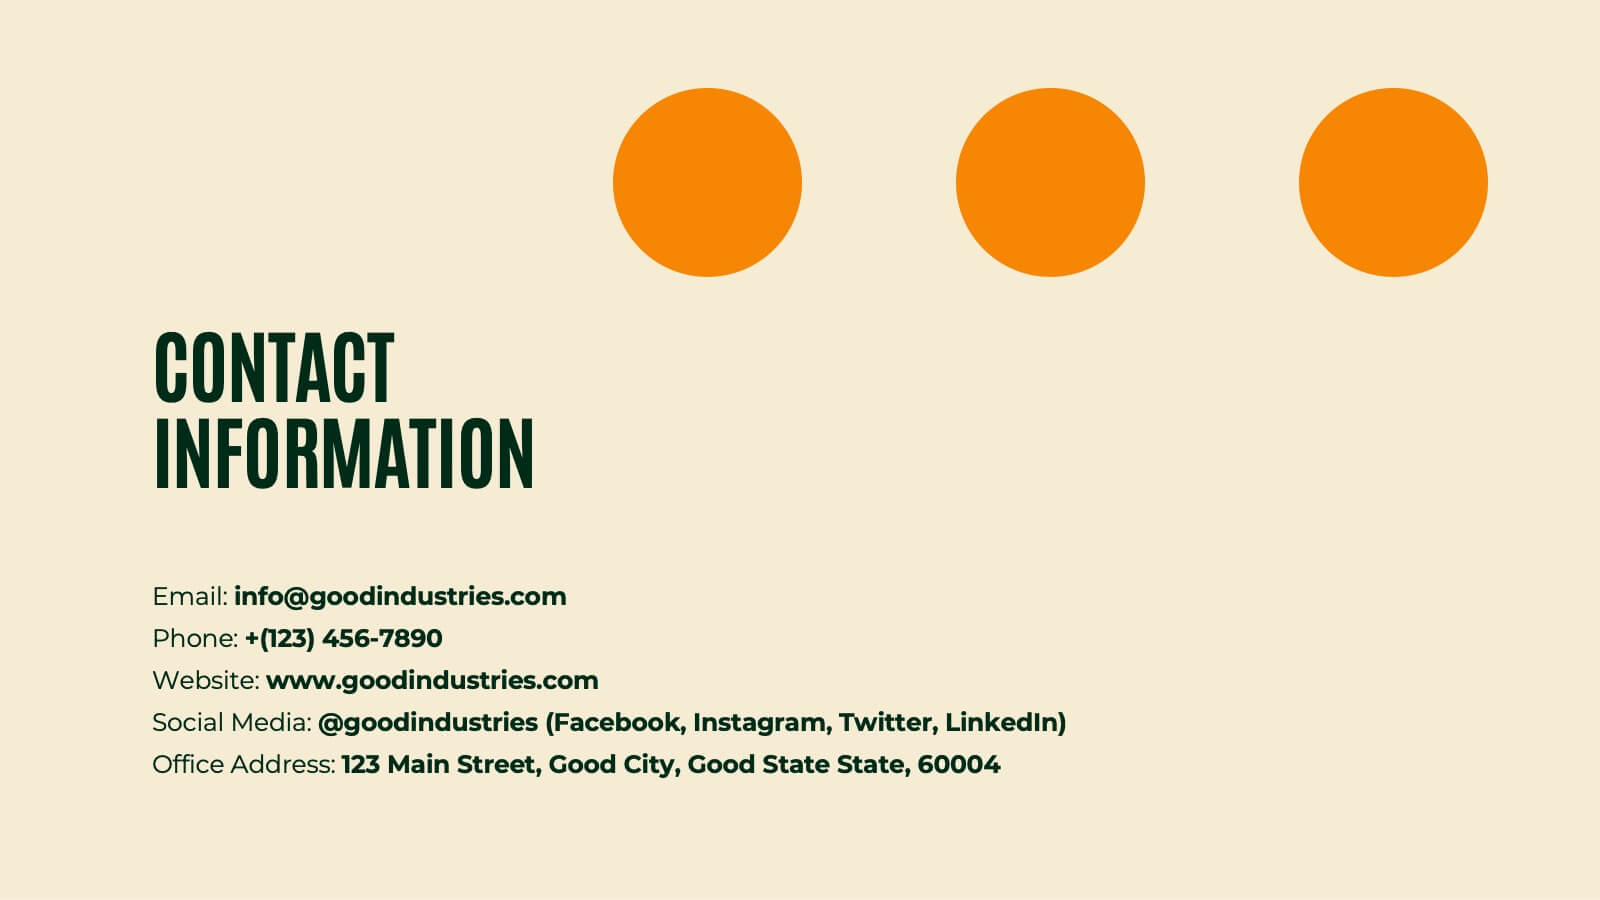
Introduce and elevate your brand with this versatile presentation template designed to reflect your company's vision and values. Perfect for businesses looking to showcase their brand strategy, components, and touchpoints with clarity and professionalism. This presentation features thoughtfully designed slides covering brand identity components, visual guidelines, target audience insights, and future development plans. Use dedicated sections to outline your unique selling proposition, positioning, and strategy. With its clean layout and attention to detail, it's ideal for presenting a cohesive and impactful brand narrative. Compatible with PowerPoint, Google Slides, and Keynote, this template is fully customizable. Edit colors, text, and images to align with your brand aesthetics and messaging. Deliver your presentation with confidence, ensuring your audience is inspired by a polished and professional brand identity.


4 slides
Value Innovation with Blue Ocean Strategy Presentation
Showcase the balance between value creation and innovation using this dual puzzle layout. Perfect for comparing customer benefits and strategic actions side by side. Each piece is icon-supported for clarity and visual appeal. Fully editable in PowerPoint, Keynote, and Google Slides—ideal for strategy, business development, or executive briefings.


6 slides
Green Business Practice Implementation Presentation
Showcase your sustainability strategy with this Green Business Practice Implementation Presentation. Featuring a segmented lightbulb diagram, this slide is ideal for outlining eco-friendly initiatives, sustainable development goals, or ESG compliance efforts. Perfect for corporate sustainability reports or green business planning. Fully compatible with PowerPoint, Keynote, and Google Slides.

26 slides
Griffin Rebranding Project Plan Presentation
Unleash the power of branding with this vibrant presentation template! This tool guides you through essential brand elements like identity, voice, and strategy. Perfect for marketers and brand managers aiming to make a memorable impact. Compatible with PowerPoint, Keynote, and Google Slides, it's a must-have for any branding project.


5 slides
Business Report Summary Slide Presentation
Deliver key metrics and insights with confidence using this Business Report Summary Slide. Featuring segmented graphs, percentage indicators, and a 6-part breakdown, this layout helps you highlight performance trends and action items clearly. Ideal for reporting, monthly reviews, or executive briefings. Fully editable in PowerPoint, Keynote, and Google Slides.


4 slides
UX Empathy Map Design Presentation
Spark deeper user understanding with a layout that turns thoughts, feelings, and behaviors into clear visual insights. This presentation helps teams explore customer motivation and improve product decisions through a simple, structured empathy-mapping framework. Fully compatible with PowerPoint, Keynote, and Google Slides.


8 slides
Business Problem Solution Presentation
Turn complex challenges into clear, visual insights with this sleek diagram designed to outline problems, root causes, and actionable solutions. Ideal for strategy meetings or proposal decks, it helps you communicate ideas with structure and impact. Fully compatible with PowerPoint, Keynote, and Google Slides for easy customization and presentation use.


26 slides
Austin Presentation Template
Sports photography captures the essence of sports and its participants by conveying a strong image. The photographer needs to carefully plan the timing of taking these photos. The Austin Template is perfect for displaying information about your products and services. Vivid and bold colors draw your audience's attention, while the creative sections provide all the relevant details. With an appealing layout and stylish design, you can present yourself in the best light possible. This template will give your site the professional look it deserves, and be sure to stand out to your clients.


5 slides
Product Life Cycle Strategy Framework Presentation
Bring structure and clarity to your business strategy with this clean circular infographic design. Ideal for showcasing product evolution, performance metrics, and planning stages, it helps visualize complex data in a professional, easy-to-follow format. Fully editable and compatible with PowerPoint, Keynote, and Google Slides for seamless customization.


4 slides
Project Workflow Steps and Flowchart Presentation
Map out each phase of your project with clarity using the Project Workflow Steps and Flowchart Presentation. This detailed template offers a visual grid layout for illustrating task sequences, decision points, and team responsibilities. Ideal for project managers, analysts, and operations teams. Fully editable and compatible with PowerPoint, Keynote, and Google Slides.


5 slides
RAPID Decision-Making Roles Overview Presentation
Clarify accountability and streamline decisions with the RAPID Decision-Making Roles Overview Presentation. This visual layout breaks down the five essential roles—Recommend, Agree, Perform, Input, and Decide—into a clear quadrant diagram. Ideal for project teams, leadership alignment, or decision-making workshops. Fully editable in PowerPoint, Google Slides, Keynote, and Canva.


5 slides
Meal Plan and Nutrition Guide Presentation
Simplify your nutrition strategy with the Meal Plan and Nutrition Guide Presentation. This visually engaging circular layout lets you outline five key nutrition pillars or daily meals with icons and editable titles. Ideal for dietitians, wellness coaches, or health brands. Compatible with PowerPoint, Canva, and Google Slides for seamless customization.


8 slides
Sustainable Operation & Ethical Practice Presentation
Illustrate your ethical initiatives and operational sustainability with this water drop flow diagram. Ideal for outlining four key actions or principles, it features a faucet visual and icon-based content drops. Fully customizable in PowerPoint, Keynote, and Google Slides—perfect for ESG reporting, CSR updates, and eco-conscious business presentations.