


Features
- 3 Unique Slides
- Fully editable and easy to edit in Microsoft Powerpoint, Keynote and Google Slides
- 16:9 widescreen layout
- Clean and professional designs
- Export to JPG, PDF or send by email


Do you have any questions?
Recommend


5 slides
Business Statistics Infographic Report Presentation
Present data with clarity using the Business Statistics Infographic Report presentation. This layout combines clean bar graphs, donut charts, and legends to showcase KPIs, progress benchmarks, and segmented insights. Ideal for quarterly reviews, executive updates, or client reporting. Fully editable in PowerPoint, Keynote, or Google Slides.


5 slides
North American Business Overview and Map Presentation
Showcase regional performance data across North America with this clean, data-driven map slide. Highlight four key statistics using pinpoint markers and modern percentage indicators. Ideal for market overview, financial reporting, or strategic insights. Fully customizable and compatible with PowerPoint, Keynote, and Google Slides for seamless business presentations.


10 slides
Competitive Advantage Blue Ocean Strategy Presentation
Gain a competitive edge with this Blue Ocean Strategy presentation template! Designed to help businesses identify new market opportunities, this layout focuses on the four key actions: eliminate, reduce, raise, and create. Perfect for strategic planning, innovation workshops, and business growth discussions. Fully customizable and compatible with PowerPoint, Keynote, and Google Slides.


7 slides
Milestones Credit Card Infographic Presentation
A Milestones Infographic is a visual representation of significant events, accomplishments, or achievements in a project, business, or individual's life. This template include timelines, graphs, diagrams, and other visual elements to help convey important information. You can use this infographic to cover many different topics, including project management, business growth, personal achievements, or company history. This template is useful for businesses or individuals who want to showcase their accomplishments, highlight important dates or events, or just share progress updates.


5 slides
Social Myths & Facts Infographics
A Social Myth might be a certain belief, while a Social Fact would be the correct answer with data. This engaging and informative Infographics template is designed to help you dispel common misconceptions and provide accurate information on various social topics. With this template you can cover stereotypes, challenge myths, or present facts to promote understanding and awareness. The template features a modern design with vibrant colors and captivating visuals, making it visually appealing and easy to navigate. It includes a variety of design elements such as icons, illustrations and timelines that can all be customized.


5 slides
Work From Home Setup and Time Management Presentation
Master productivity from your living room with this Work From Home Setup and Time Management presentation. Featuring a modern, illustrated layout with five clear steps, this slide helps communicate best practices for workspace organization, focus habits, and time-blocking techniques. Ideal for remote onboarding, virtual team training, or self-discipline coaching sessions. Fully customizable in PowerPoint, Keynote, and Google Slides.


6 slides
Aviation Classes Infographics
Discover the world of Aviation Classes with our customizable infographic template. This template is fully compatible with popular presentation software like PowerPoint, Keynote, and Google Slides, allowing you to easily customize it to illustrate and communicate various aspects of aviation education and training. The Aviation Classes infographic template offers a visually engaging platform to outline the types of aviation courses, training programs, career opportunities, and the importance of aviation education. Whether you're an aviation student, educator, aspiring pilot, or simply interested in aviation, this template provides a user-friendly canvas to create informative presentations and educational materials. Enhance your understanding of Aviation Classes with this SEO-optimized infographic template, thoughtfully designed for clarity and ease of use. Customize it to showcase different aviation disciplines, training institutions, certification requirements, and the role of education in the aviation industry. Ensure that your audience gains valuable insights into the world of aviation education. Start crafting your personalized infographic today to explore the realm of Aviation Classes.


4 slides
Lifecycle Strategy for Product Management Presentation
Present the complete journey of a product with clarity using the Lifecycle Strategy for Product Management presentation. This slide illustrates each phase—Introduction, Growth, Maturity, and Decline—along a progressive path, making it ideal for showcasing product timelines, strategic decisions, and forecasting. Each stage includes editable icons and text for easy customization. Fully compatible with PowerPoint, Keynote, and Google Slides.


6 slides
Title Hierarchy Infographic
The collection of slides is designed to efficiently convey key themes with a striking visual appeal, ensuring that crucial topics are presented with clarity and emphasis. Each slide utilizes bold typography and a unique color palette to draw attention and maintain viewer engagement. The designs incorporate dynamic shapes and minimalist layouts, enhancing the presentation's readability while emphasizing important content. This set is ideal for professionals aiming to present complex ideas in a clear and memorable way during meetings or in corporate documents. It supports various communicative goals, such as introducing concepts, outlining challenges, or promoting organizational initiatives, making it a versatile tool for enhancing message delivery in any professional setting.


4 slides
Work From Home Bests Practices Presentation
Bring remote work to life with a clean, modern layout that helps teams stay focused, organized, and productive. This presentation highlights key habits, routines, and strategies for working efficiently from home, offering clear visuals that simplify every point. Fully editable and compatible with PowerPoint, Keynote, and Google Slides.


6 slides
WFH Tools and Productivity Tips
Level up your work-from-home game with this modern visual wheel that breaks down essential tools and actionable tips to boost productivity. Perfect for remote teams, solo entrepreneurs, or virtual training sessions, this layout keeps key info easy to digest and visually engaging. Fully compatible with PowerPoint, Keynote, and Google Slides.


7 slides
SWOT Analysis Marketing Infographic Presentation
SWOT Analysis is a simple, but powerful strategic planning method. It helps identify your company’s strengths, weaknesses, opportunities and threats as you plan a course for the future. This template includes everything you need for your next project, including data and insight about your business. This template comes with 7 slides. It includes a title for each infographic and allows you to build your swot charts, add icons and convert the text into bullet points. You have complete control over all elements within each slide and can easily add, delete or modify content at any time!


26 slides
Remote Work Best Practices Creative Presentation
Navigate the world of telecommuting with our Remote Work Best Practices presentation template, available for Powerpoint, Google Slides, and Keynote. This template is specially designed for the modern remote work environment, incorporating a blend of professional and engaging visuals that reflect the flexibility and innovation of working from home. The template features customizable slides for outlining communication tools, scheduling, and mental health tips. Whether you're onboarding new staff or refining your company's remote policies, this template will help you present a comprehensive guide to succeeding in the remote work landscape.


5 slides
Suicide Awareness Stats Infographics
Navigate the sensitive topic of suicide with the suicide awareness stats infographics template. Crafted with care in shades of blue, white, and purple, this vertical, informative infographic serves as a profound educational tool. It is essential for mental health advocates, educational institutions, and community outreach programs, offering a respectful yet impactful way of presenting statistics and information. The template includes thoughtfully designed graphics, relevant icons, and placeholders for real-world images, ensuring the data speaks volumes in raising awareness, promoting prevention, and supporting life-affirming actions within various communities.


10 slides
Milestone Roadmap Infographic Presentation
Track progress with clarity using this Milestone Roadmap Infographic template. Designed to highlight key achievements and project phases, it’s perfect for presentations, team updates, and strategic planning. Editable in PowerPoint, Keynote, and Google Slides, it's an efficient way to visualize goals, timelines, and accomplishments.


6 slides
Big Data Analytics Presentation
The "Big Data Analytics Presentation" template is expertly designed to visualize global data analytics strategies across different regions. The map highlights key areas in distinct colors, drawing attention to where data initiatives are being implemented or where significant market trends are observed. Each region on the map corresponds to specific titles that can be customized to represent various analytical focuses such as market penetration, user demographics, or revenue growth. Accompanying the map are percentage circles that quantify planning, execution, and success rates, making this template invaluable for analysts, data scientists, and corporate strategists who need to present complex data in an easily digestible format. This visual tool is perfect for enhancing presentations, strategic meetings, and reports with a clear, concise, and visually engaging representation of data-driven insights.


21 slides
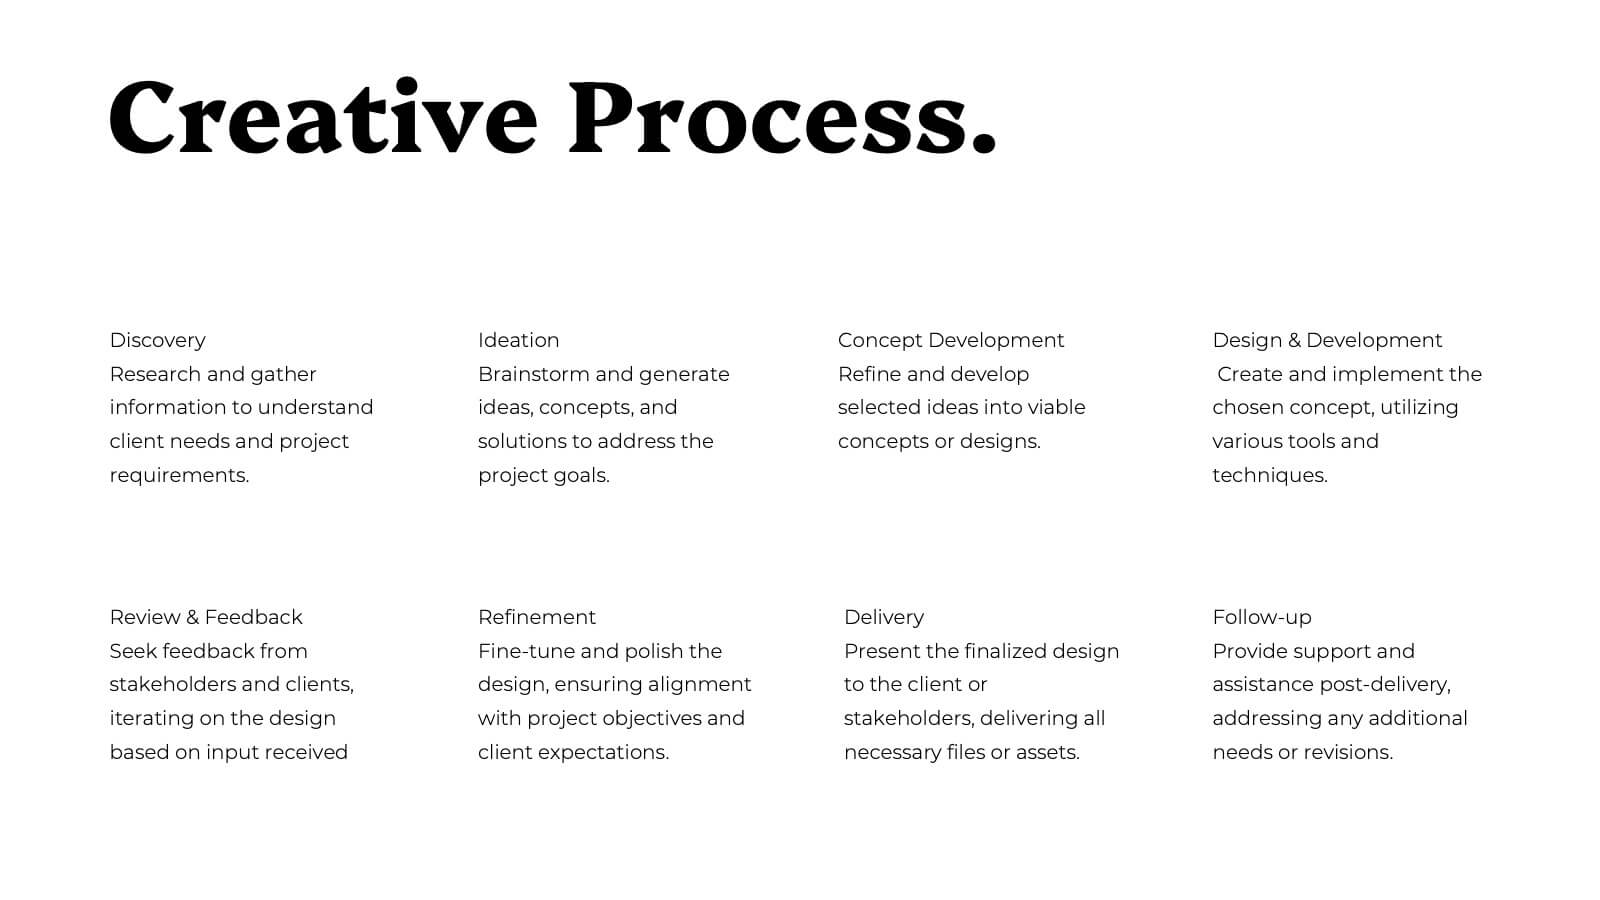
Arcadian Photography Portfolio Template Presentation
Showcase your best work with this sleek and stylish photography portfolio presentation template! It’s perfect for presenting your featured projects, creative process, and client testimonials in a visually stunning way. This template is fully customizable and offers a professional touch to your portfolio, making it ideal for both personal and client presentations. Compatible with PowerPoint, Keynote, and Google Slides.