


Features
- 4 Unique slides
- Fully editable and easy to edit in Microsoft Powerpoint, Keynote and Google Slides
- 16:9 widescreen layout
- Clean and professional designs
- Export to JPG, PDF or send by email


Do you have any questions?
Recommend


6 slides
Cultural Ecology Infographics
The "Cultural Ecology" infographic template is an insightful and captivating tool, expertly tailored for PowerPoint, Keynote, and Google Slides. This template is a valuable resource for anthropologists, environmentalists, and educators aiming to showcase the intricate relationship between human cultures and their environments in a visually compelling way. This template elegantly maps out the principles of cultural ecology, illustrating how cultural practices, societal developments, and environmental factors are interwoven. It highlights key concepts such as adaptation, sustainability, and the impact of human activities on ecosystems. The layout is designed to facilitate a deep understanding of the ways in which human cultures shape and are shaped by their natural surroundings. The design is as rich and diverse as the field it represents, with a color scheme that echoes the vibrancy of different cultures and the richness of various ecosystems. This not only makes the presentation visually striking but also reinforces the interconnectedness of culture and ecology. Whether used in academic lectures, environmental conferences, or cultural exhibitions, this template ensures that the complex and fascinating world of "Cultural Ecology" is presented in an engaging, educational, and visually arresting manner.


5 slides
Procurement Strategy Presentation
ChatGPT PlusBring clarity and structure to your business process with this modern, visually engaging presentation. Perfect for outlining purchasing plans, supplier relationships, and cost-saving strategies, it helps convey information with precision and flow. Fully customizable and compatible with PowerPoint, Keynote, and Google Slides for seamless editing and professional results.


6 slides
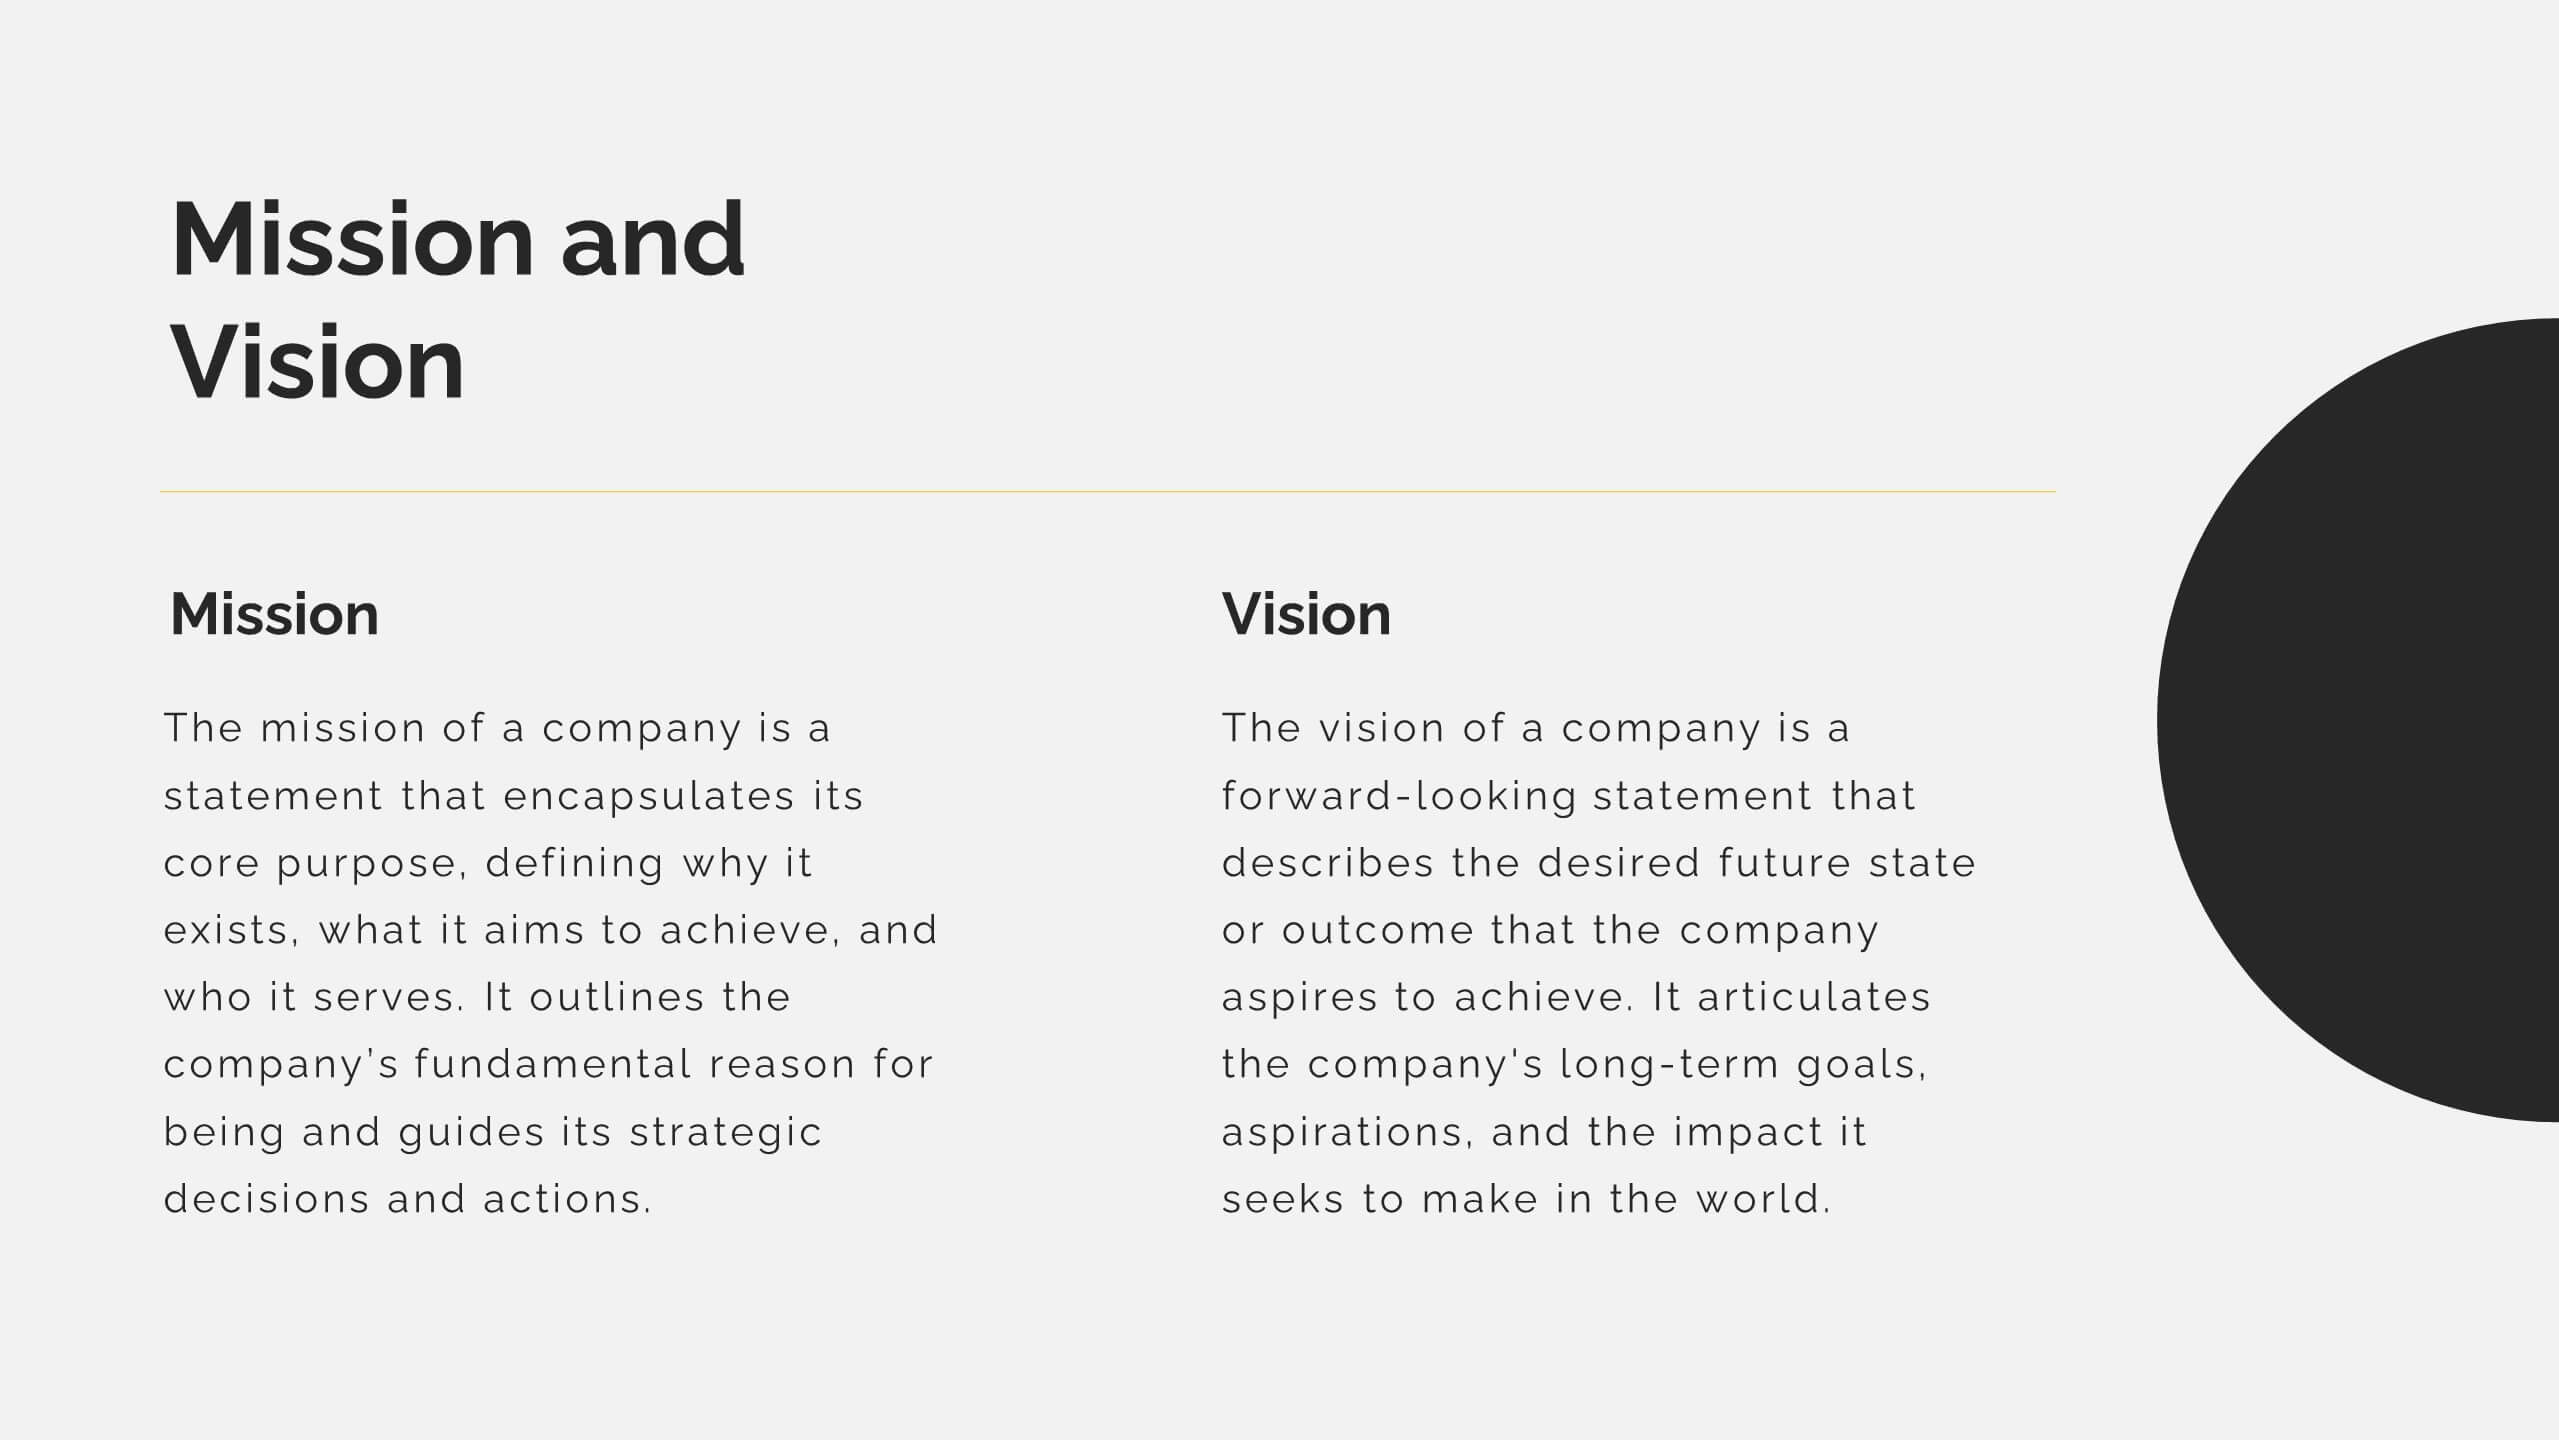
Vision Statement Infographic
Define and share your organization's aspirations with our Vision Statement Infographic Template. Designed for impact and clarity, this template offers a modern, sleek way to communicate your company's vision to team members, stakeholders, and the public. With its clean lines and focused layout, it provides the perfect backdrop to highlight your strategic intentions. This template features a series of customizable slides, each structured to help you articulate different elements of your vision statement. Utilize engaging icons, bold color blocks, and concise text to make your message resonate. It’s ideal for integrating into annual reports, company presentations, or onboarding materials, ensuring that your vision is not only shared but also inspires. Tailor each slide to suit your corporate identity, adjusting colors and fonts for consistency with your brand aesthetics. This tool is essential for leaders looking to instill a sense of purpose and direction throughout their organization.


22 slides
Mirage Startup Funding Proposal Presentation
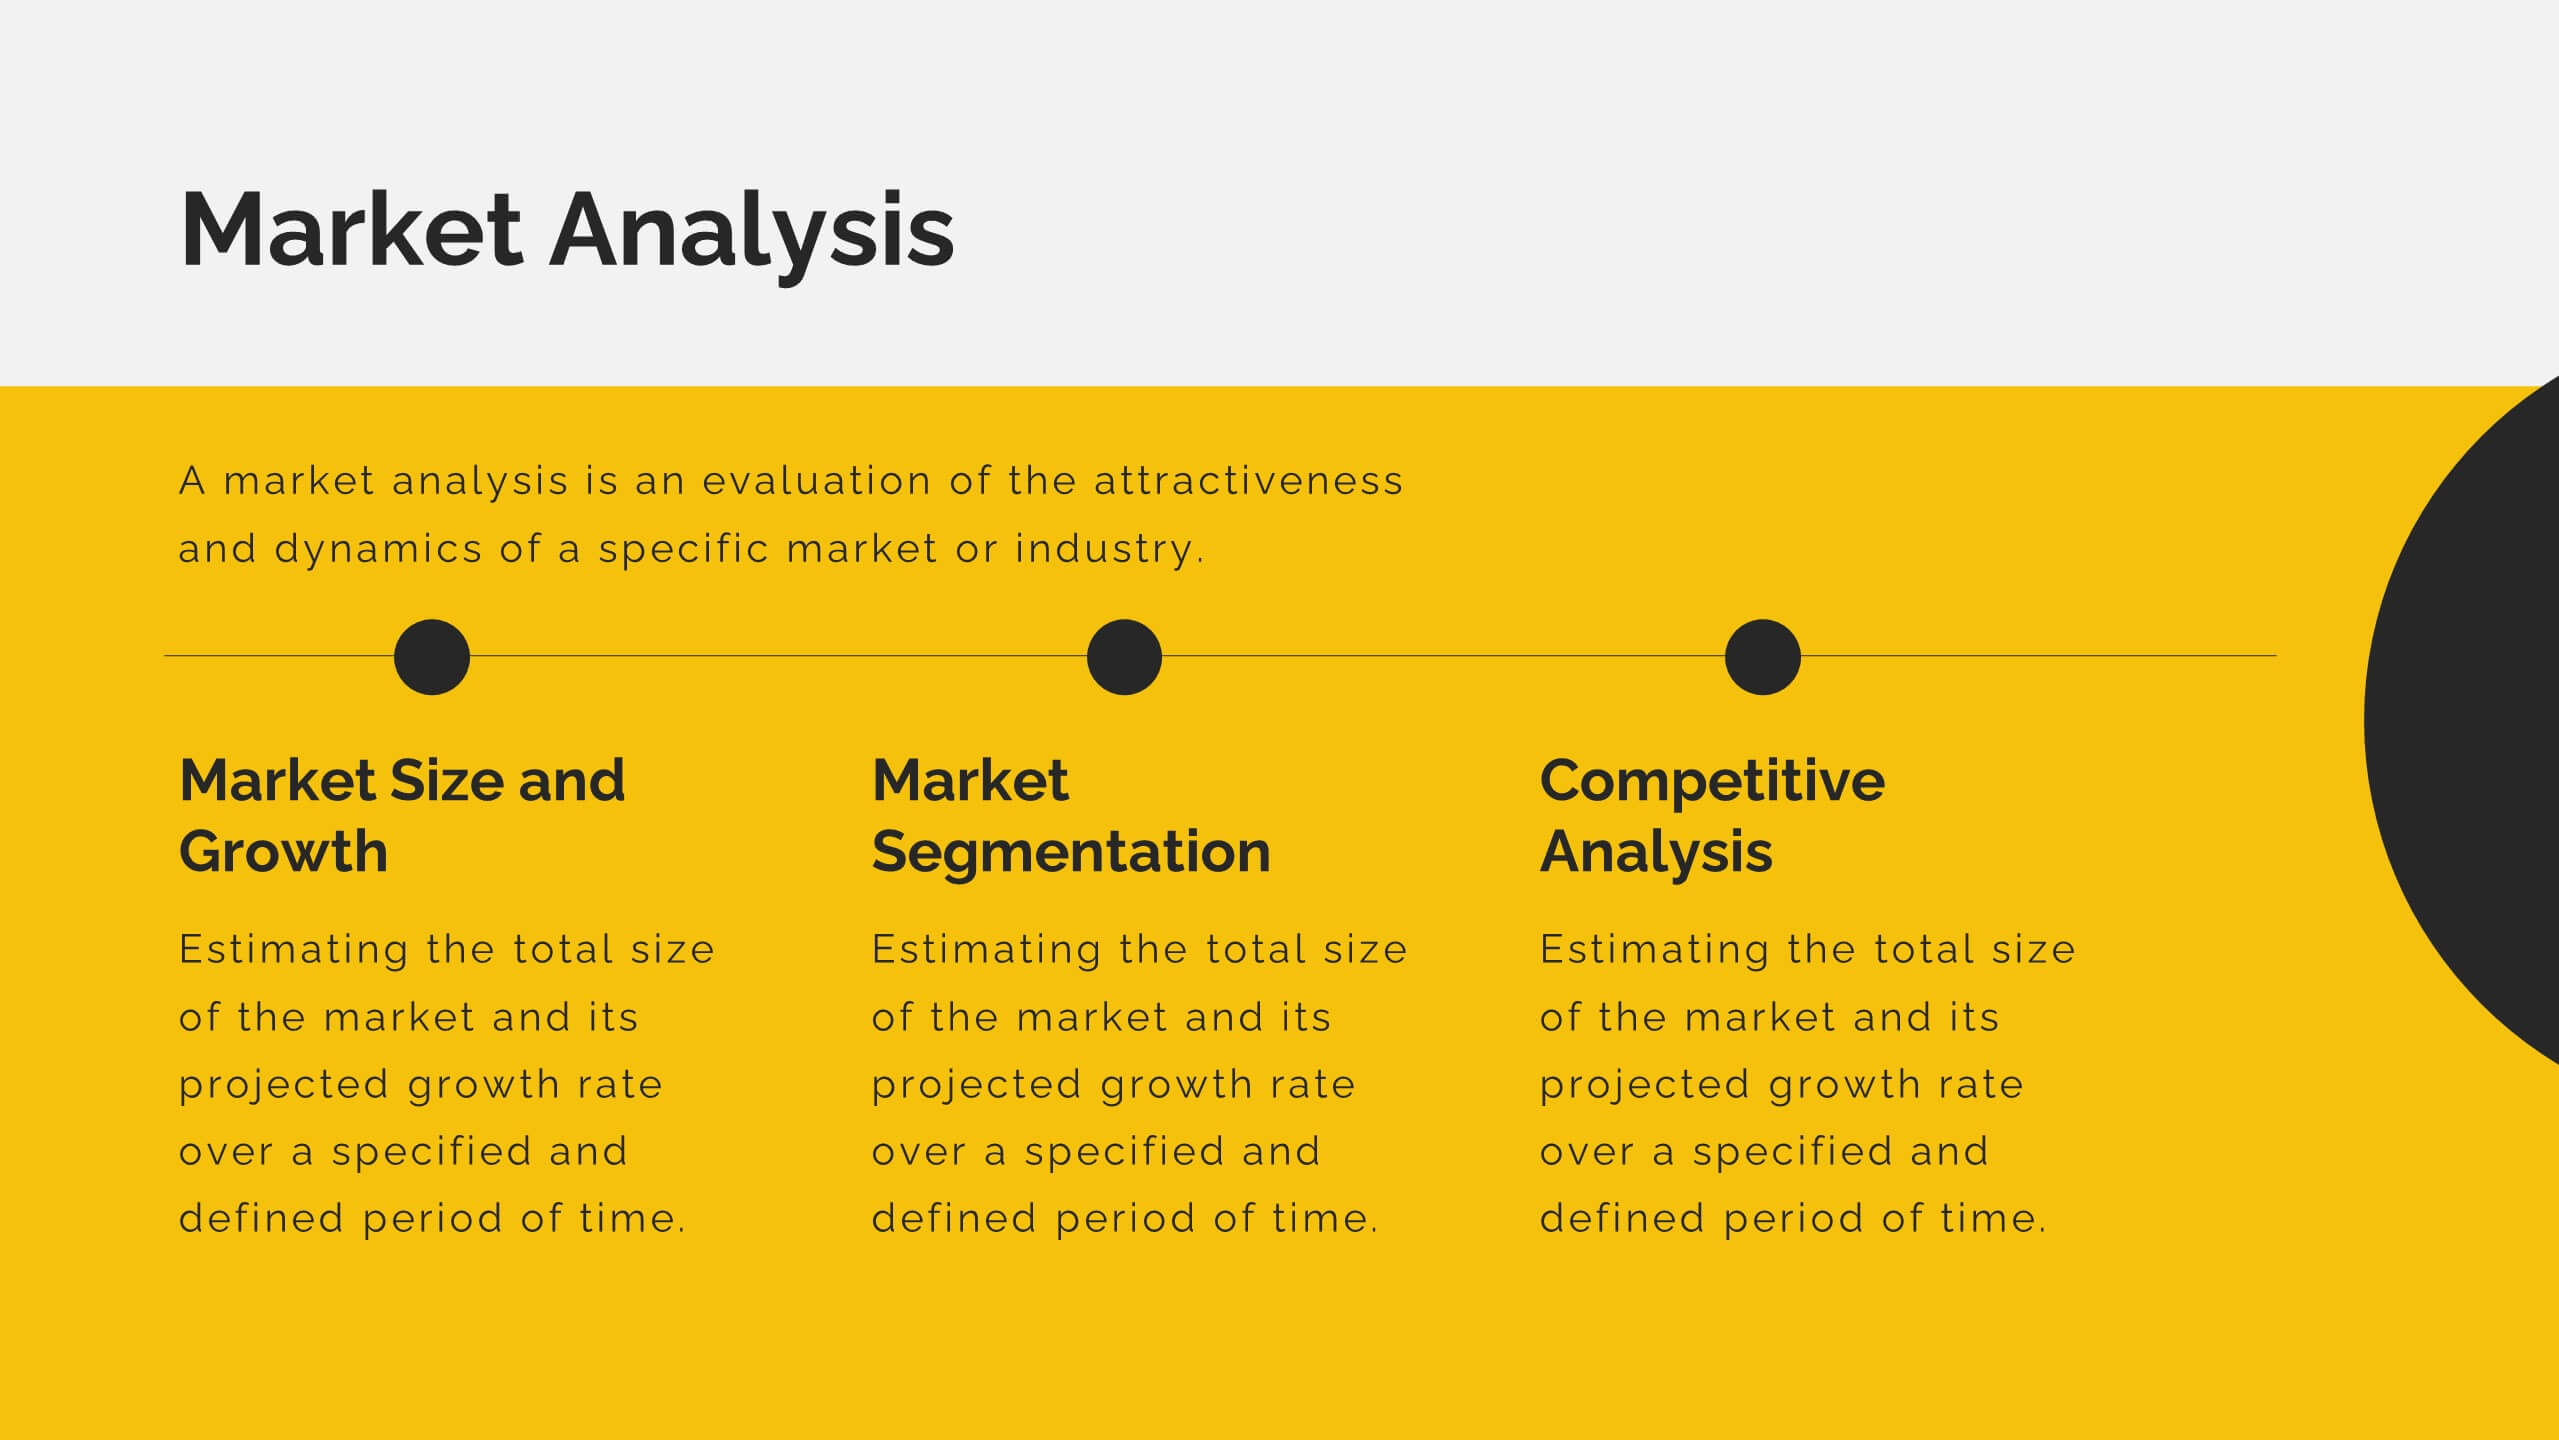
Secure funding with this dynamic startup proposal template! Perfect for presenting your mission, vision, business model, and market analysis. Ideal for entrepreneurs aiming to impress investors and stakeholders. Compatible with PowerPoint, Keynote, and Google Slides, this template ensures your proposal is clear, professional, and compelling. Achieve your startup goals today!


4 slides
Modern Company Profile Layout Presentation
Bring your brand to life with this clean and modern layout built to highlight your company’s mission, values, and team. Its balanced design and easy-to-read sections make every detail stand out beautifully. Fully editable and compatible with PowerPoint, Keynote, and Google Slides for smooth customization and professional presentations.


5 slides
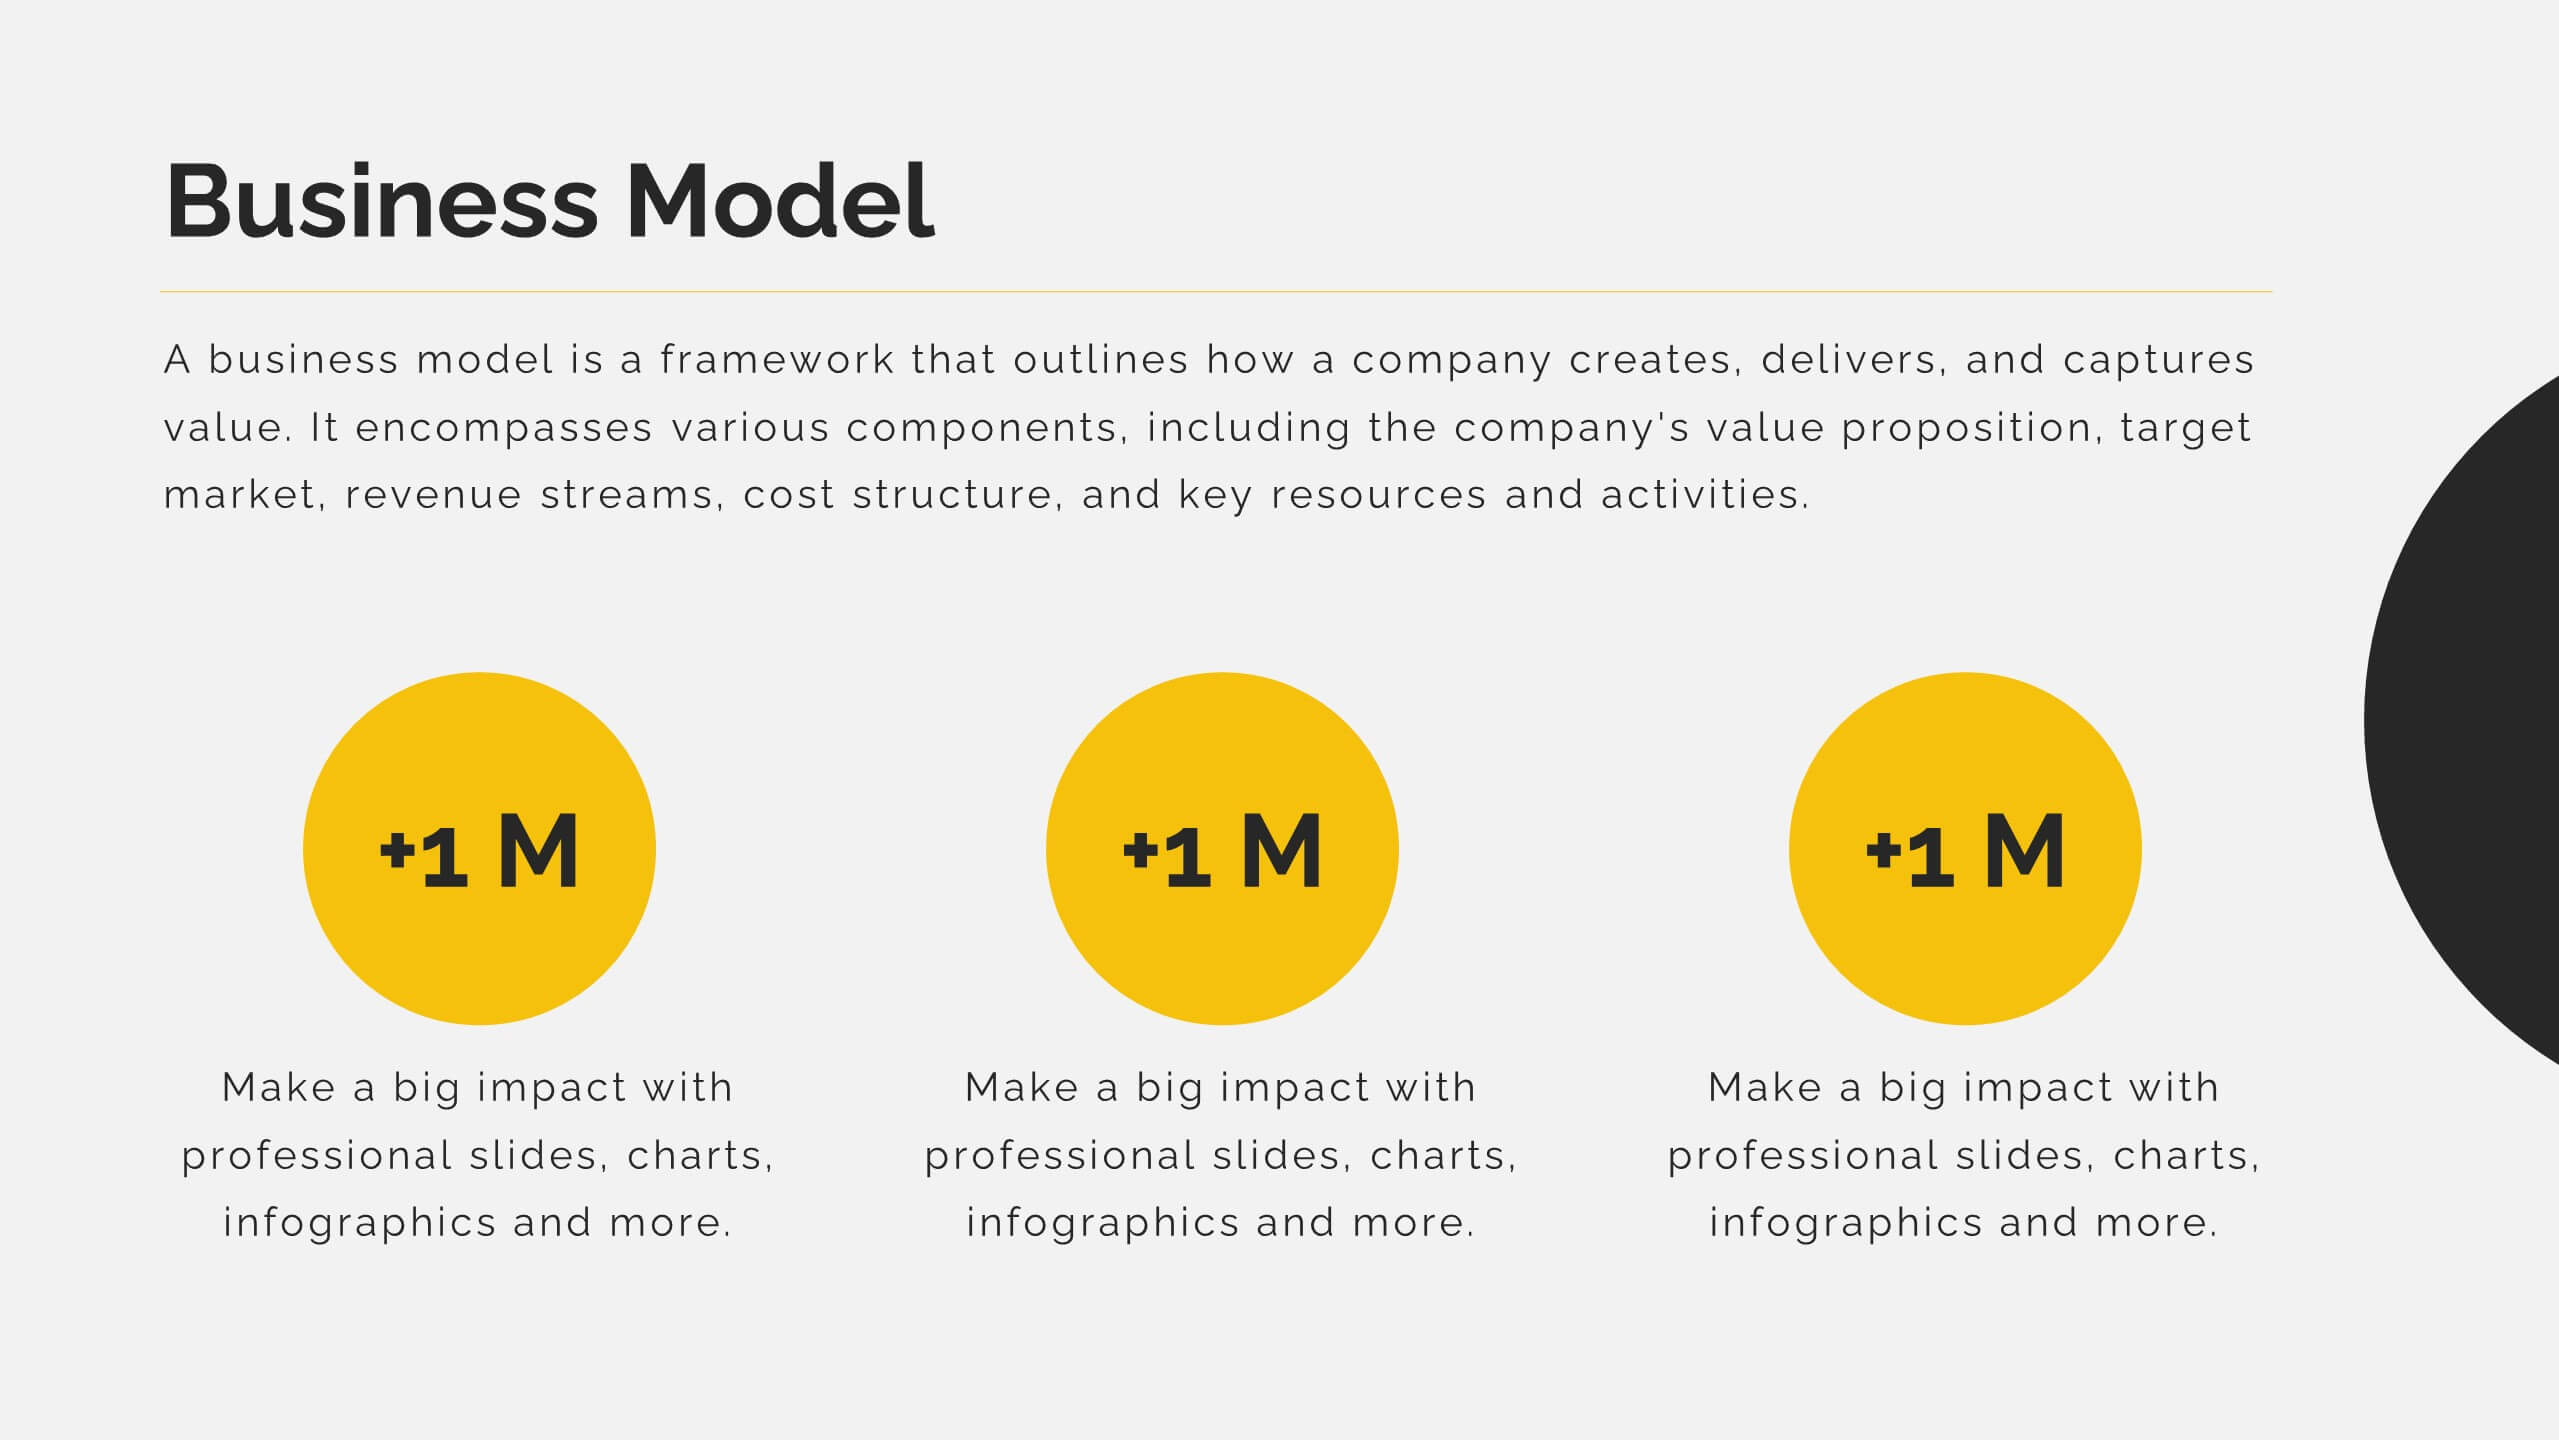
Business Model Canvas and Strategy Presentation
Visualize your entire business model in one clean, structured slide. This presentation template breaks down key areas—Partners, Activities, Value Propositions, Customers, Channels, Costs, and Revenue—into a color-coded layout for strategic clarity. Perfect for startups, consultants, or internal strategy teams. Fully editable in PowerPoint, Keynote, and Google Slides.


4 slides
Data Table Infographic Presentation
Organize complex information clearly with the Data Table Infographic Presentation. This slide design features a structured table layout paired with icon-labeled column headers for visual clarity. Ideal for presenting statistics, performance metrics, survey data, or structured comparisons. Highlighted headers draw attention to key sections, making your data easy to digest. Fully editable in PowerPoint, Keynote, and Google Slides.


5 slides
Contracts and Law Obligations Infographics
Contracts and Law Obligations are crucial aspects of legal systems and business transactions. These infographic templates are designed to help you communicate complex legal concepts in an easy-to-understand format, making it suitable for legal professionals, businesses, or anyone seeking to educate others about contract law. These infographics features a unique, vintage law design with customizable layouts, visually appealing icons, and color schemes that can be tailored to match your presentation needs. It is compatible with PowerPoint, Keynote, and Google Slides, providing flexibility in editing.


5 slides
Global Warming Impacts Infographics
Global Warming refers to the long-term increase in Earth's average surface temperature due to human activities, primarily the emission of greenhouse gases. This is a visually engaging infographic template that highlights the impacts of global warming on the environment, ecosystems, and human societies. This template is made to create an understanding of the consequences of climate change and raise awareness about the urgent need for action. The eye-catching visuals and impactful messaging, make these infographics ideal for presentations, educational material, or awareness campaigns related to global warming and environmental sustainability.


7 slides
United States Map Infographic Presentation Template
The United States is a country in North America, consisting of 50 states. Besides the 48 conterminous states that occupy the middle latitudes of the continent, the United States includes the state of Alaska, at the northwestern extreme of North America, and the island state of Hawaii, in the mid-Pacific Ocean. This map template is a great way to kickstart your project, add a clean and professional look with it. This template can be used to display any type of data or information you need in your presentations. Use this map template to show where the states are and what they're known for.


8 slides
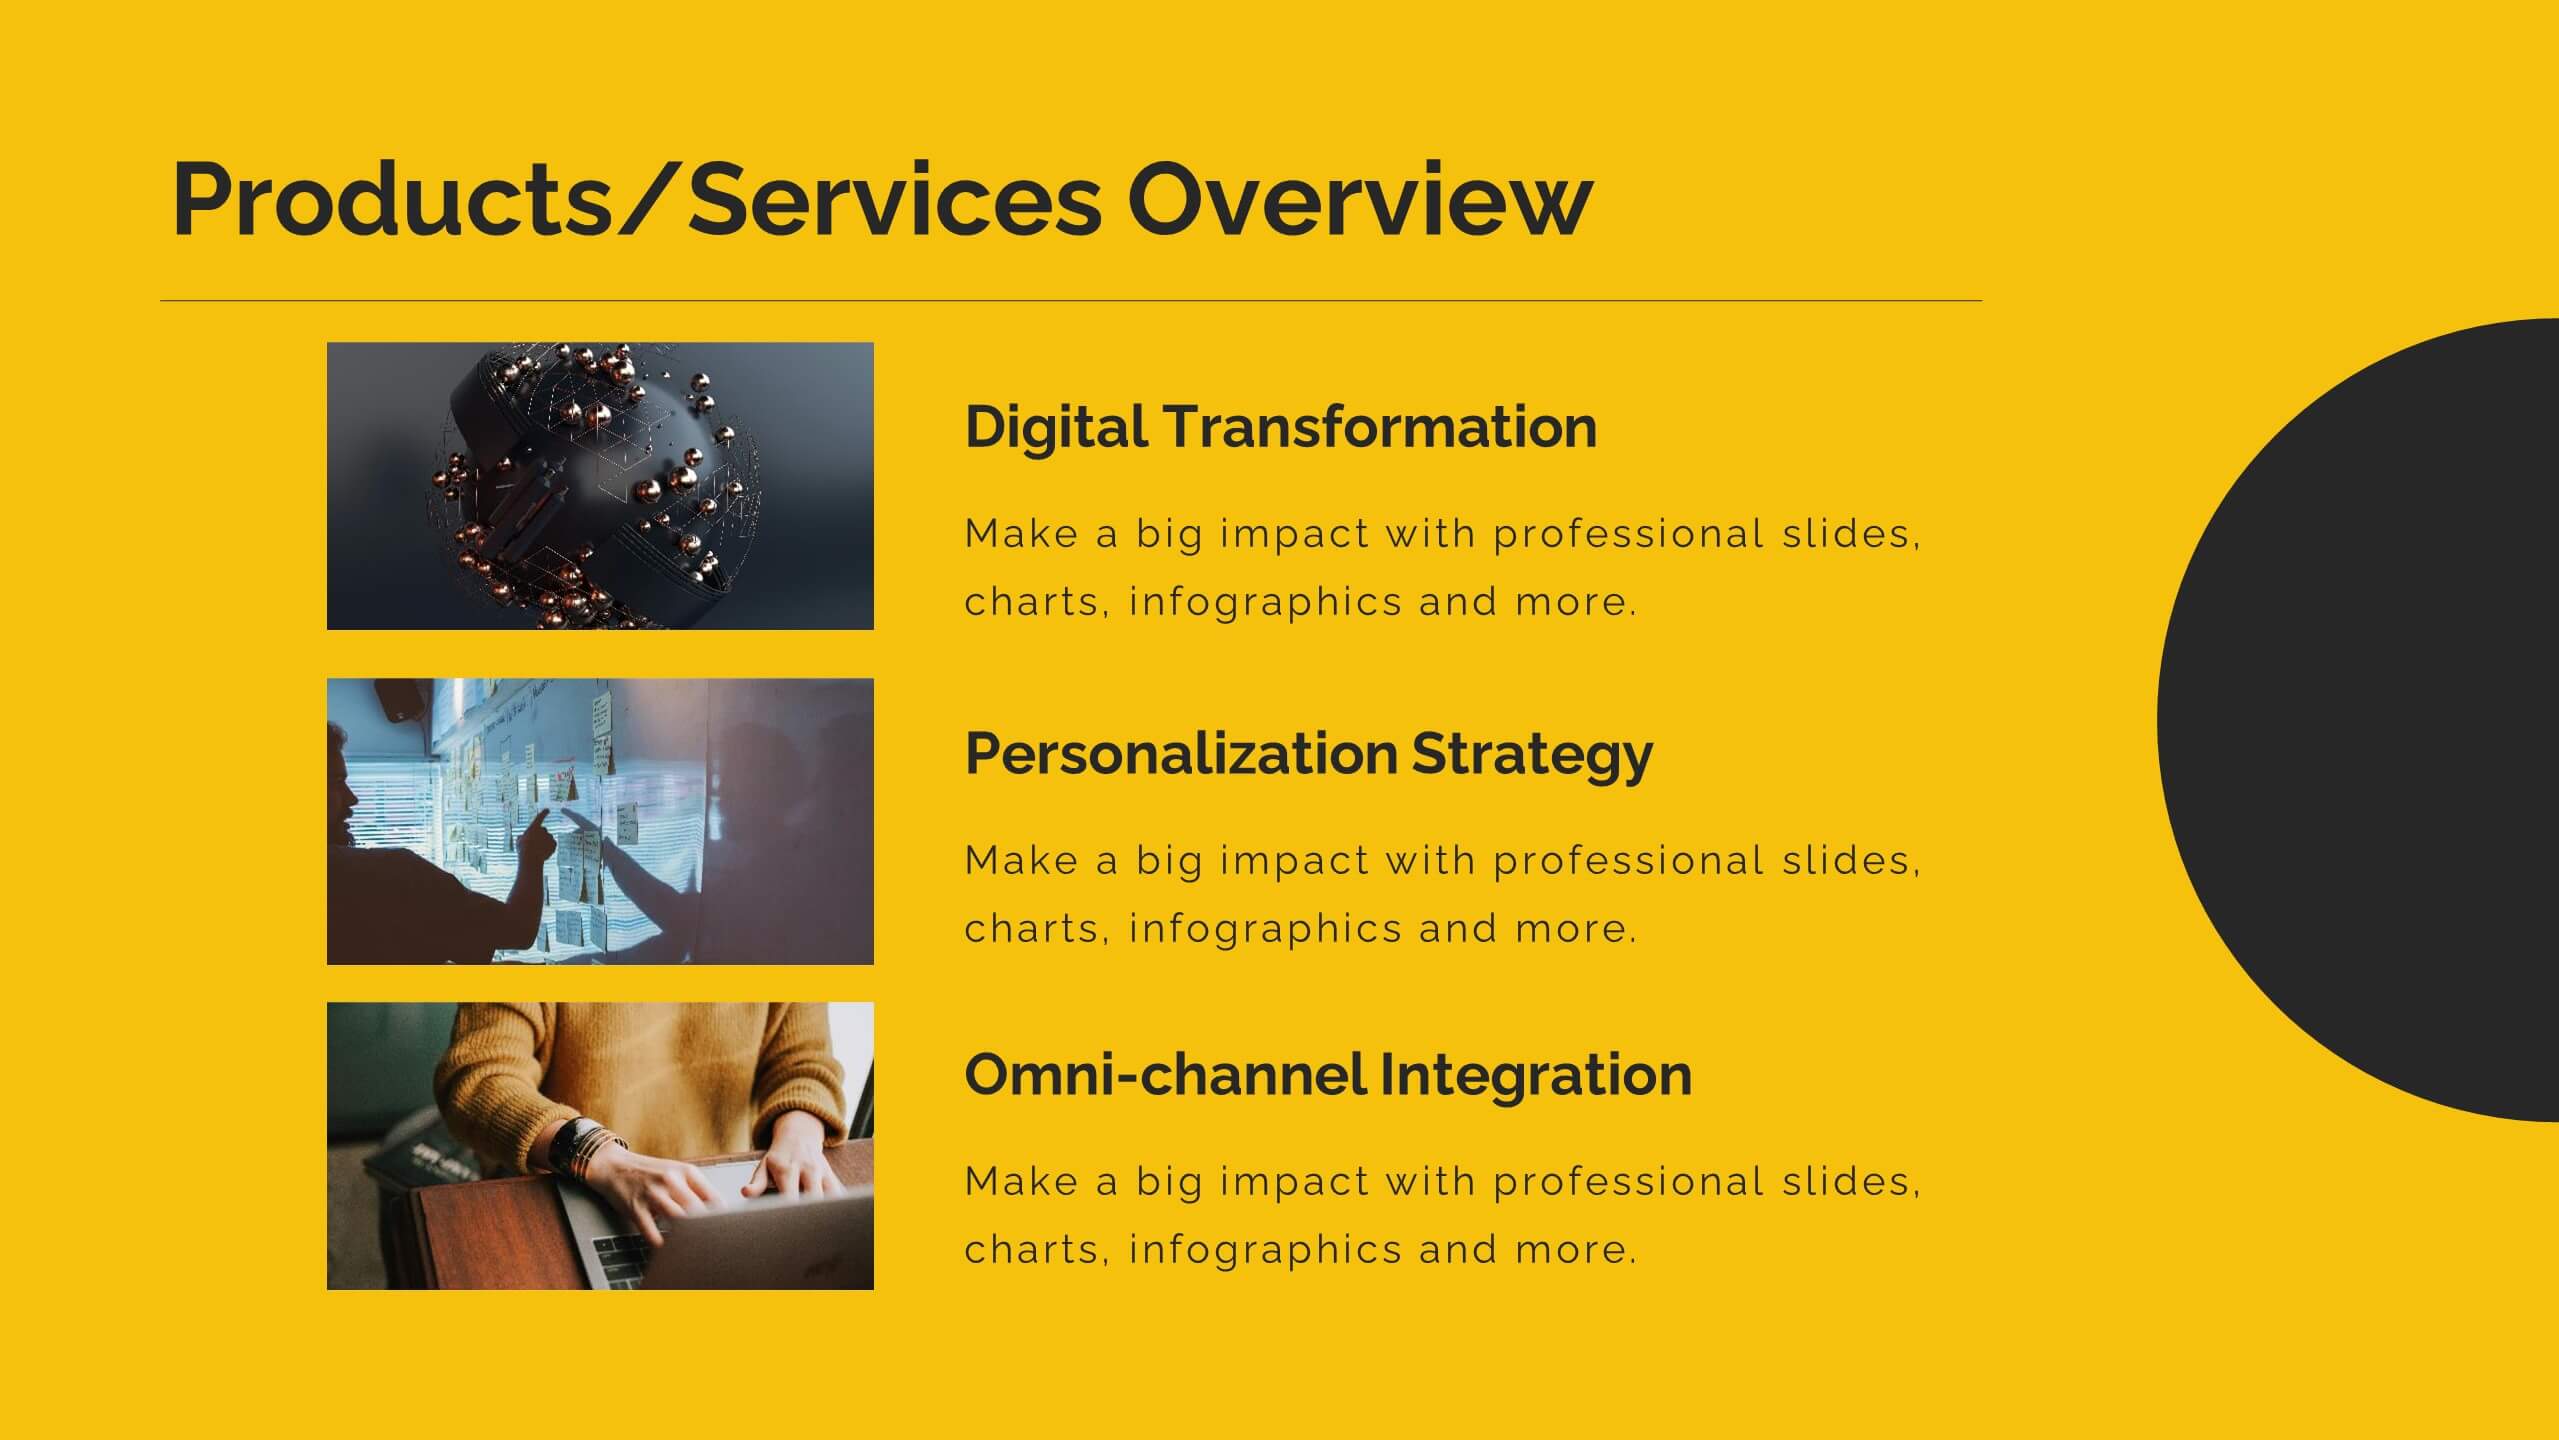
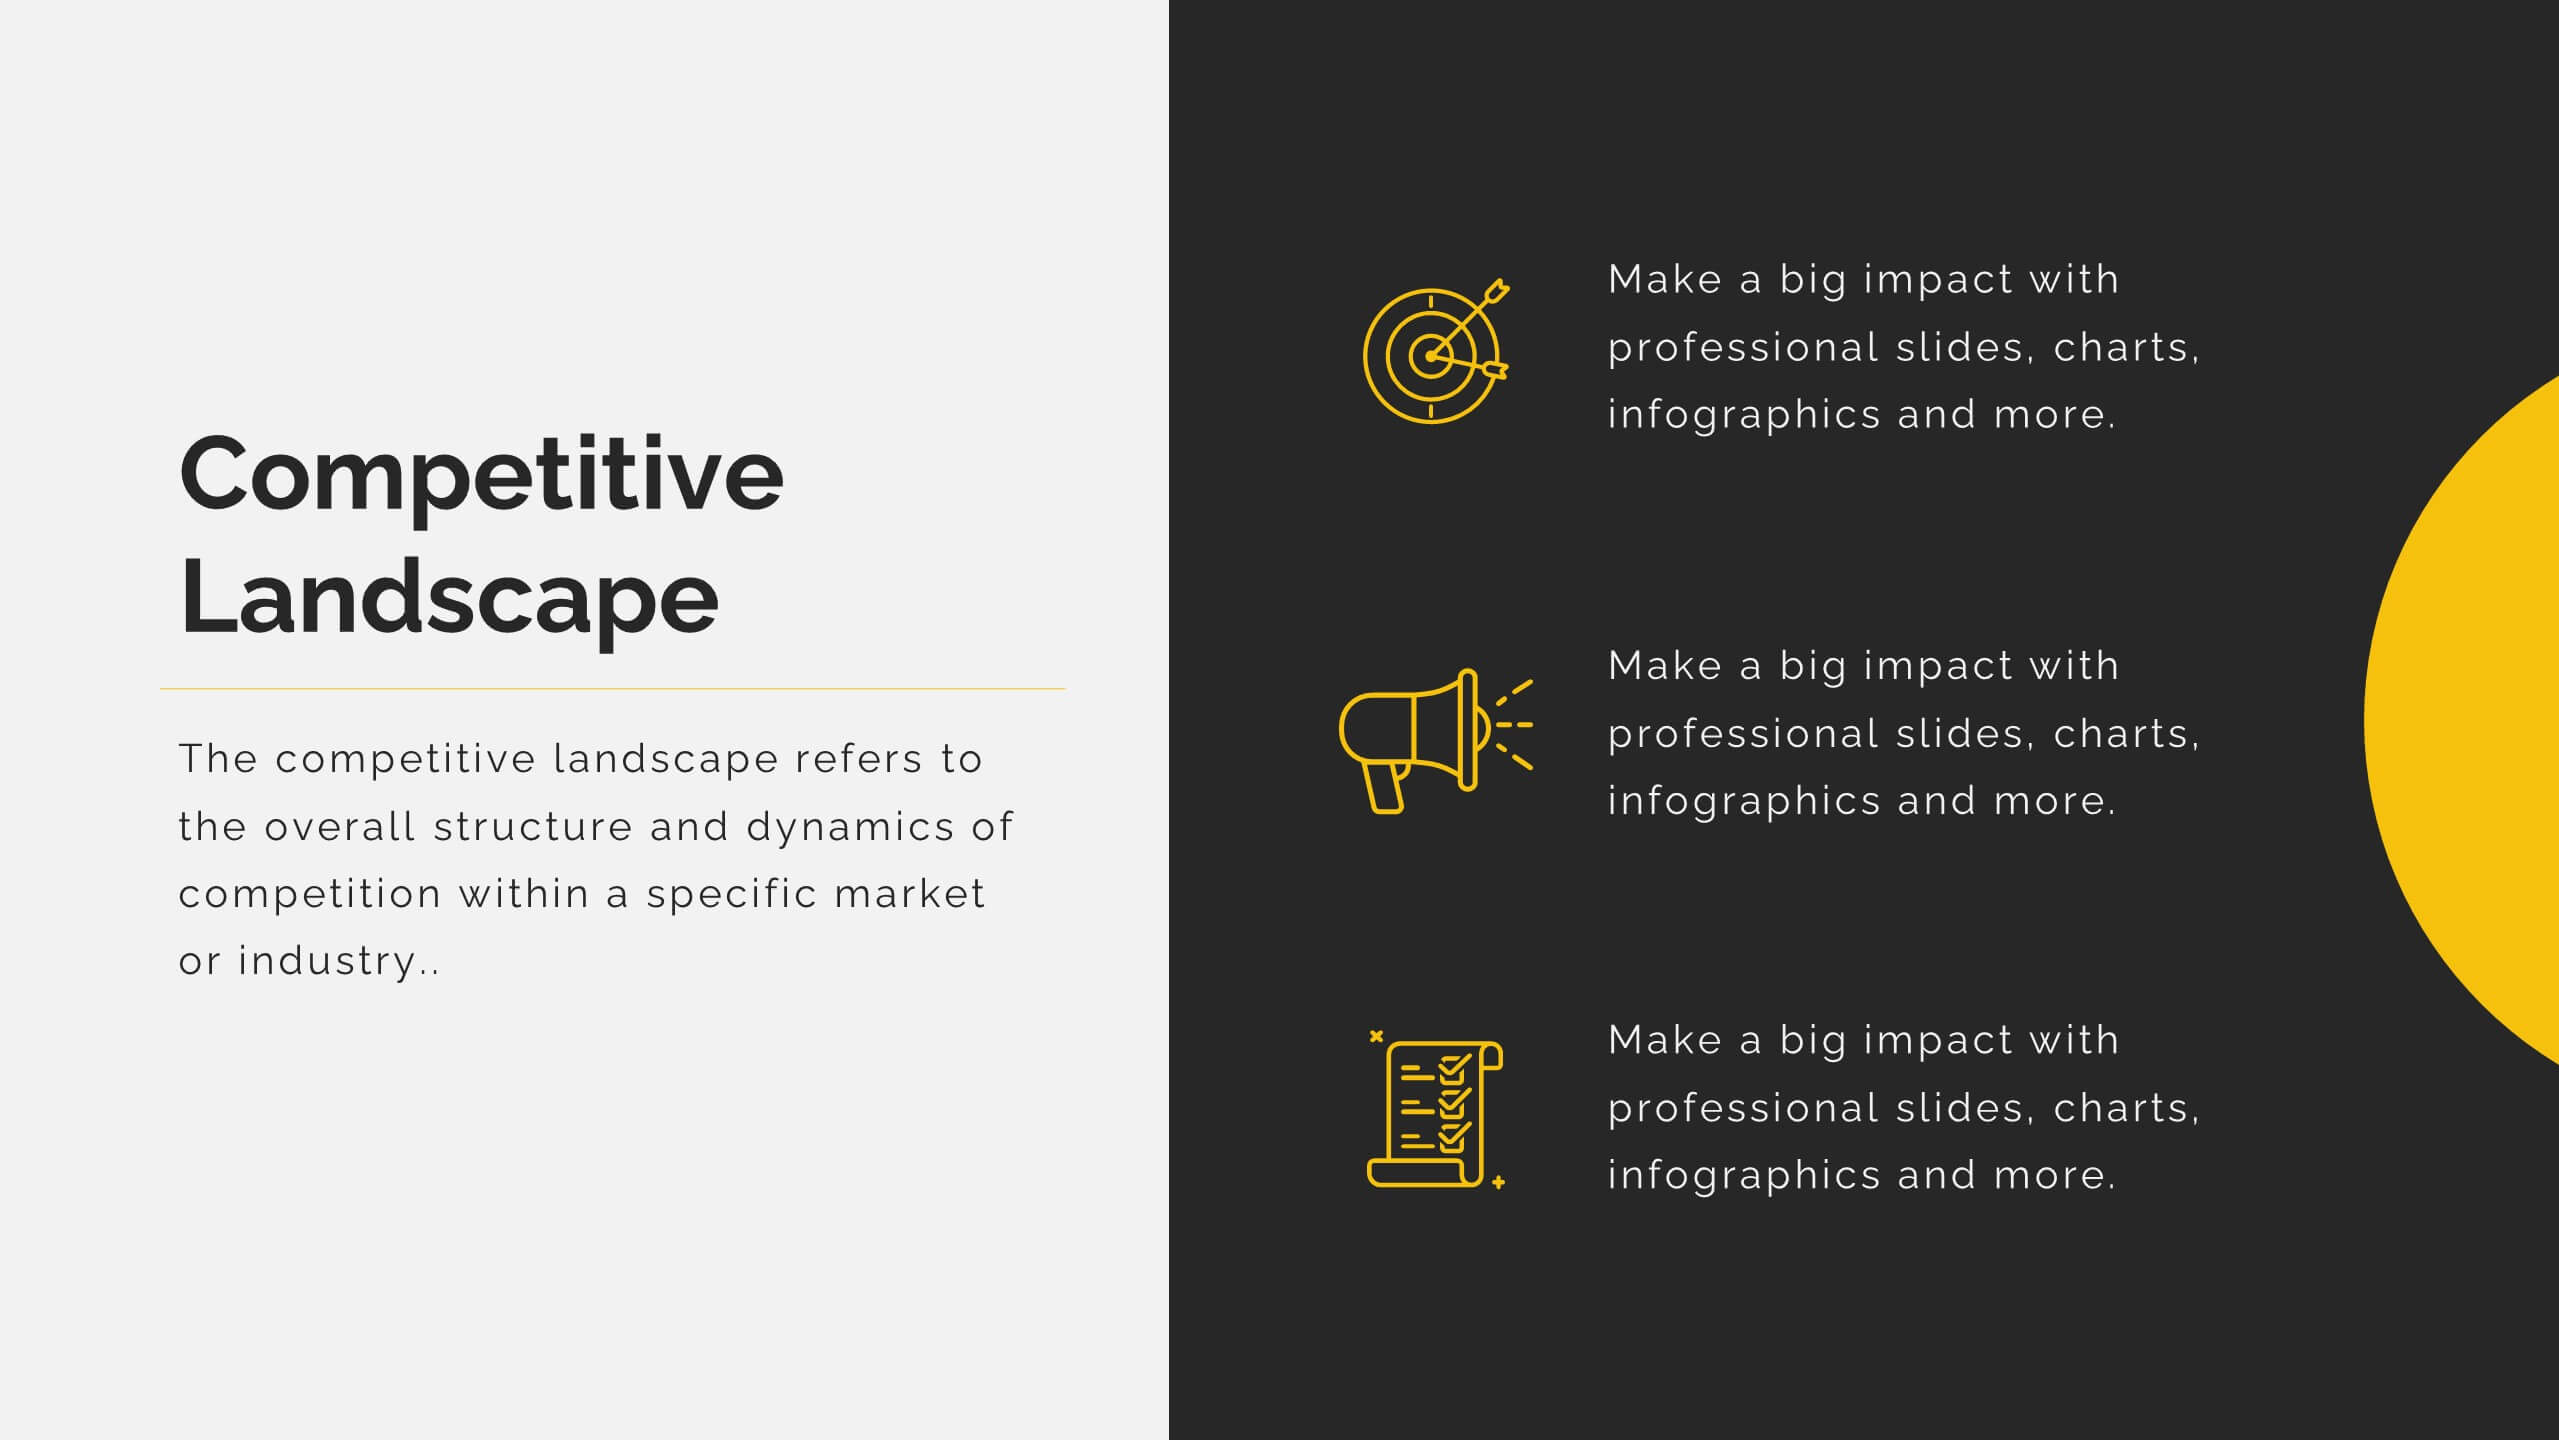
Value Chain Optimization and Analysis Presentation
Streamline Your Business for Maximum Efficiency with this Value Chain Optimization and Analysis presentation template. This visually engaging template is designed to map, analyze, and enhance the key activities in your value chain, helping businesses identify opportunities for cost reduction, performance improvements, and strategic advantages. Featuring a clean flowchart layout, intuitive color-coded sections, and editable placeholders, this template is ideal for business analysts, consultants, and executives. Fully compatible with PowerPoint, Keynote, and Google Slides, ensuring seamless customization and professional delivery.


6 slides
Effective Communication Infographics
Master the art of Effective Communication with our customizable infographic template. This template is fully compatible with popular presentation software like PowerPoint, Keynote, and Google Slides, allowing you to easily customize it to illustrate and communicate various aspects of effective communication. The Effective Communication infographic template offers a visually engaging platform to outline the principles, strategies, and skills needed to communicate effectively in various contexts, whether it's in business, personal relationships, or public speaking. Whether you're a professional communicator, leader, or someone looking to improve their communication skills, this template provides a user-friendly canvas to create informative presentations and educational materials. Optimize your communication skills with this SEO-optimized Effective Communication infographic template, thoughtfully designed for clarity and ease of use. Customize it to showcase the importance of active listening, nonverbal communication, effective messaging, and overcoming communication barriers, ensuring that your audience gains valuable insights into this essential skill. Start crafting your personalized infographic today to become a more proficient and confident communicator.


10 slides
Buyer Persona Journey Presentation
Understand your audience better with the Buyer Persona Journey Presentation. This intuitive layout showcases the key stages of your ideal customer’s experience—from discovery to decision-making. Great for marketing campaigns, product development, and sales alignment. Fully editable and compatible with PowerPoint, Keynote, and Google Slides.


5 slides
Innovative Concept Pitch Presentation
Present your big ideas with impact using this lightbulb puzzle infographic. Perfect for concept development, product ideation, or startup pitches. The layered segments help structure your content clearly. Fully customizable in PowerPoint, Keynote, and Google Slides—ideal for innovation roadmaps, creative planning, or visualizing business concepts.


21 slides
Frost Design Proposal Presentation
Present your design proposal with sophistication and clarity using this elegant template! Perfect for outlining your project summary, objectives, and proposed solutions, this template covers everything from scope of work and budget breakdowns to deliverables and team expertise. Fully compatible with PowerPoint, Keynote, and Google Slides, it's designed for seamless, professional presentations.
7 slides
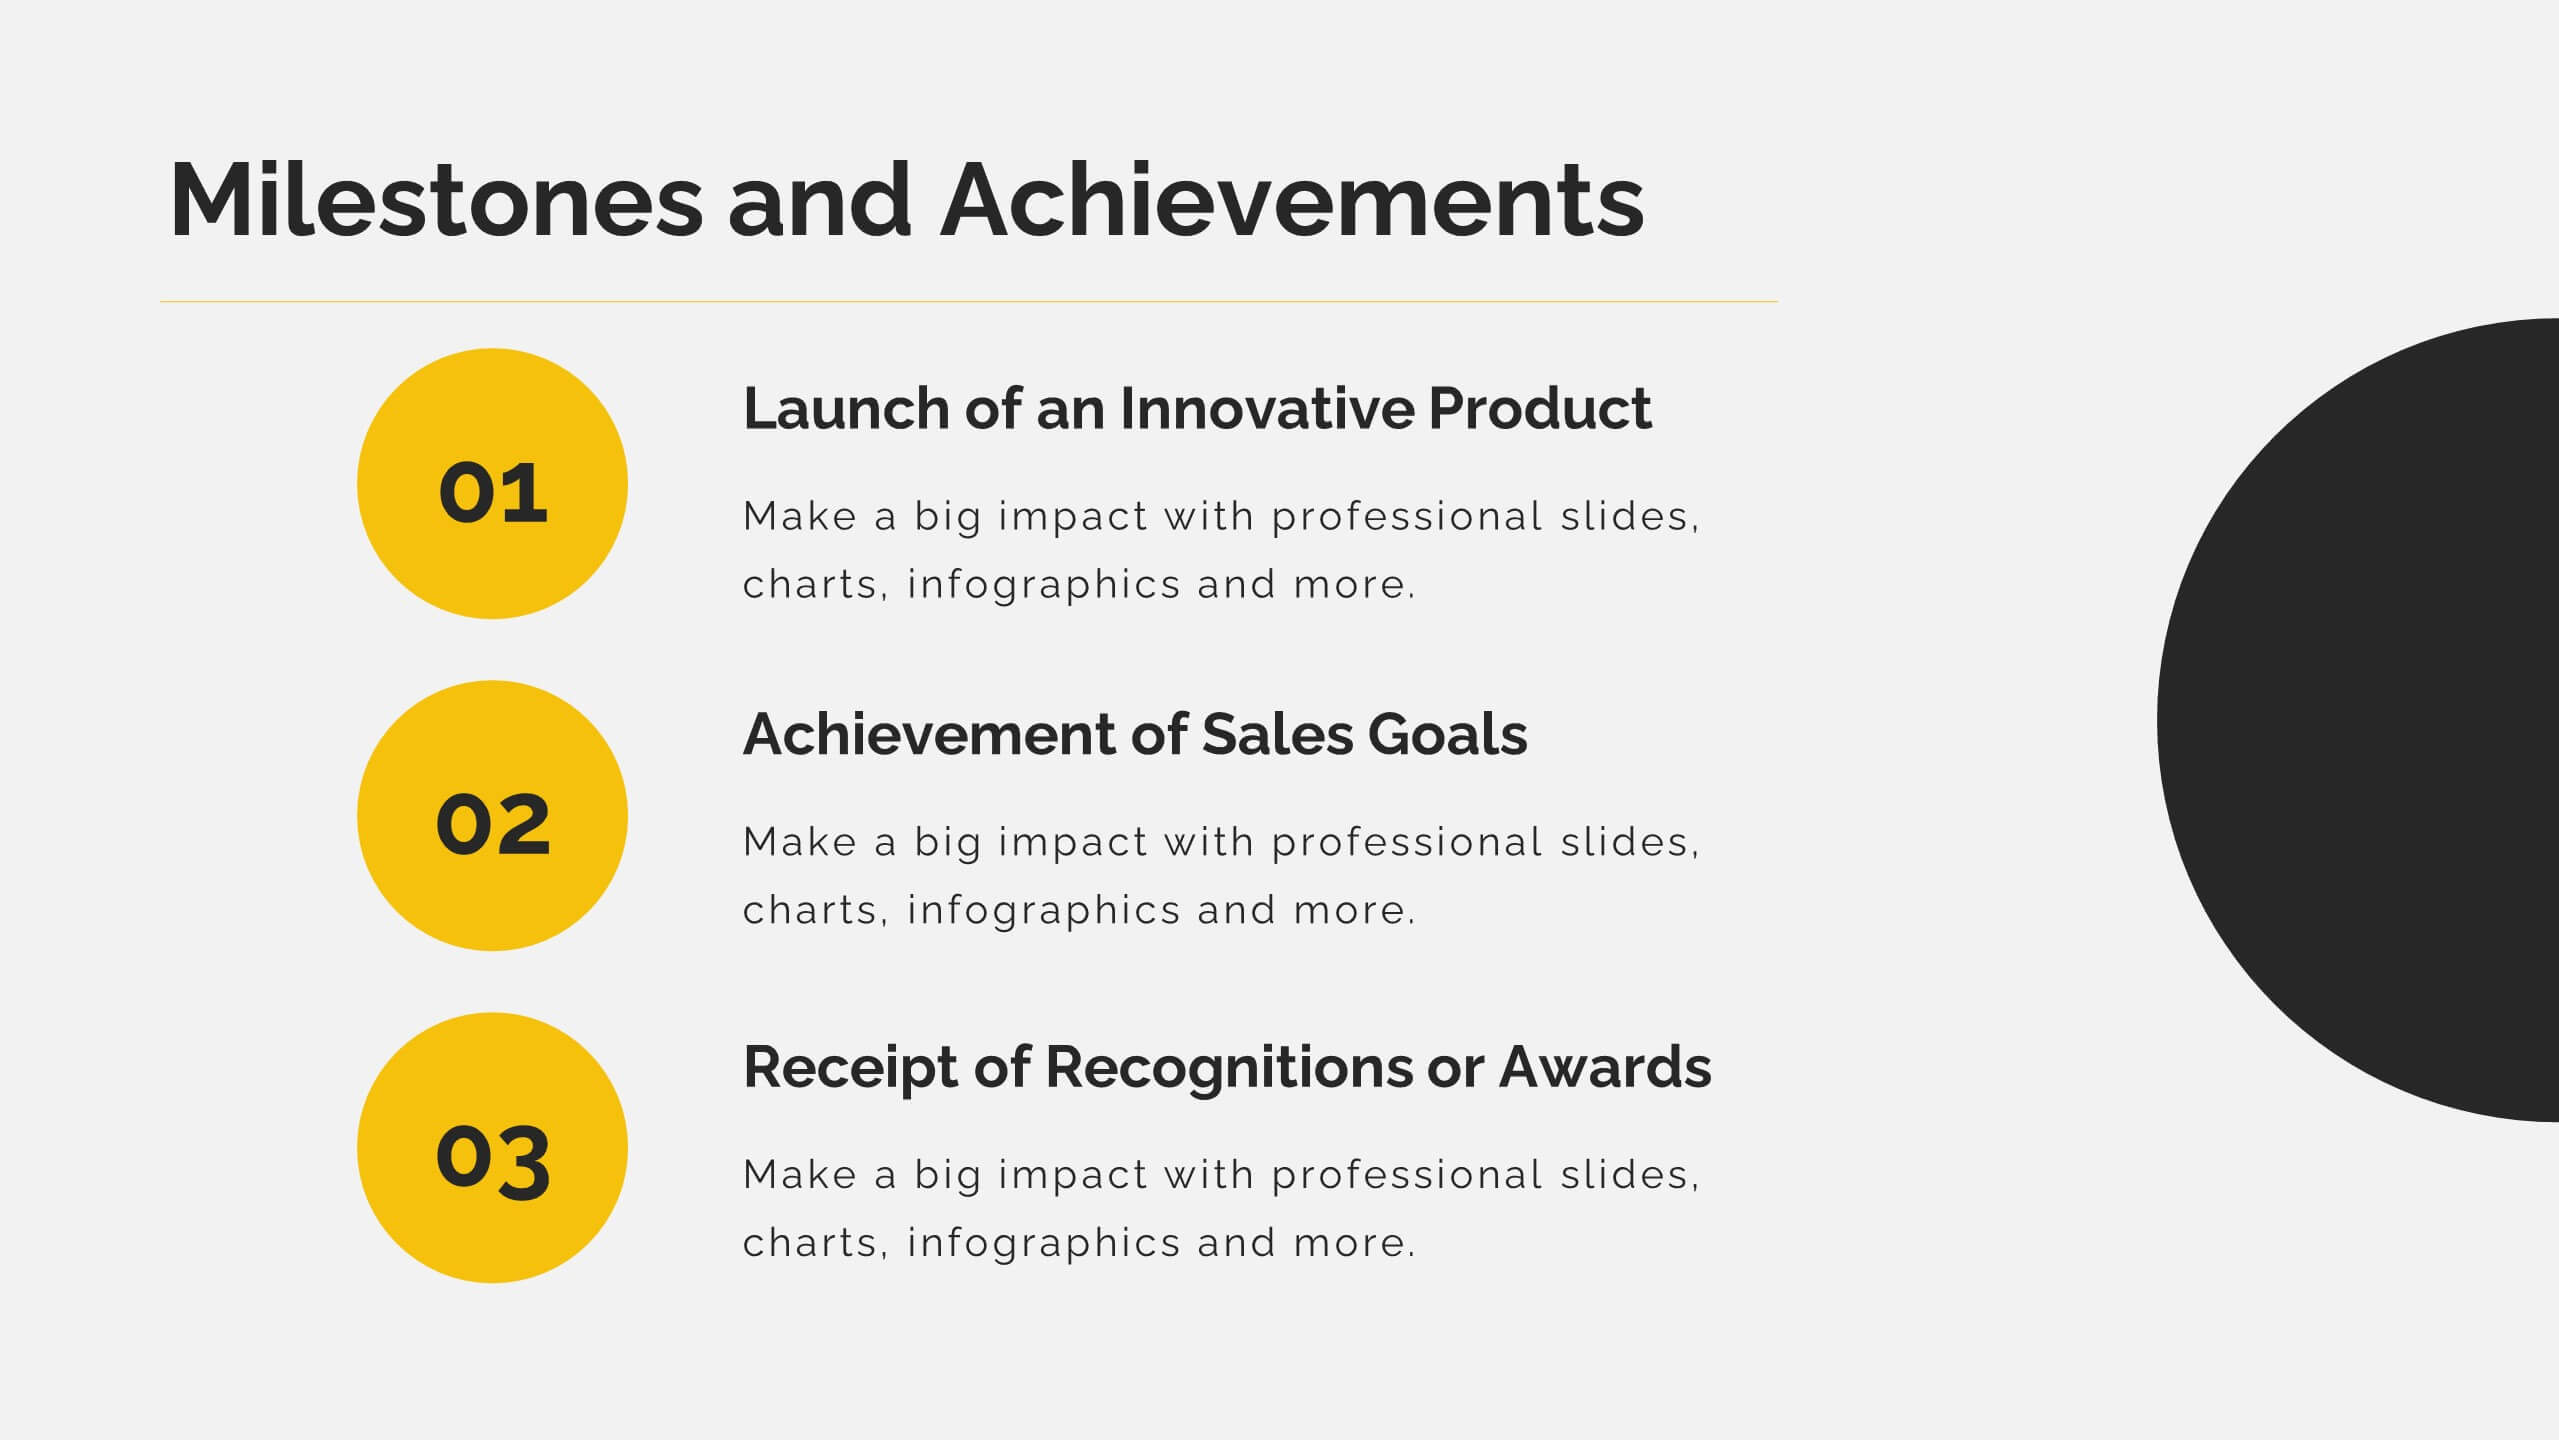
Project Milestone Tracking Presentation
Efficiently monitor key project milestones with our "Project Milestone Tracking" presentation templates. These visually clear and user-friendly tools are perfect for project managers to showcase task completions, priority levels, due dates, and overall project progress, ensuring that every team member is aligned and informed. Compatible with PowerPoint, Keynote, and Google Slides, these templates streamline project updates and enhance team coordination.


7 slides
Flow Chart Diagram
A flowchart diagram is a visual representation that illustrates a process or system by using different symbols and shapes to depict the steps, decisions, and actions involved. Our flow chart diagram infographic is the compass to navigate your concepts into concrete actions. It's a visual roadmap that simplifies complex processes, helping you illustrate the steps in a sequence. This Infographic is your trusted tool for transforming processes into a visually appealing and understandable journey. This tool is designed to be used in various fields, including software development, business process analysis, education, and more, to depict the logical flow.