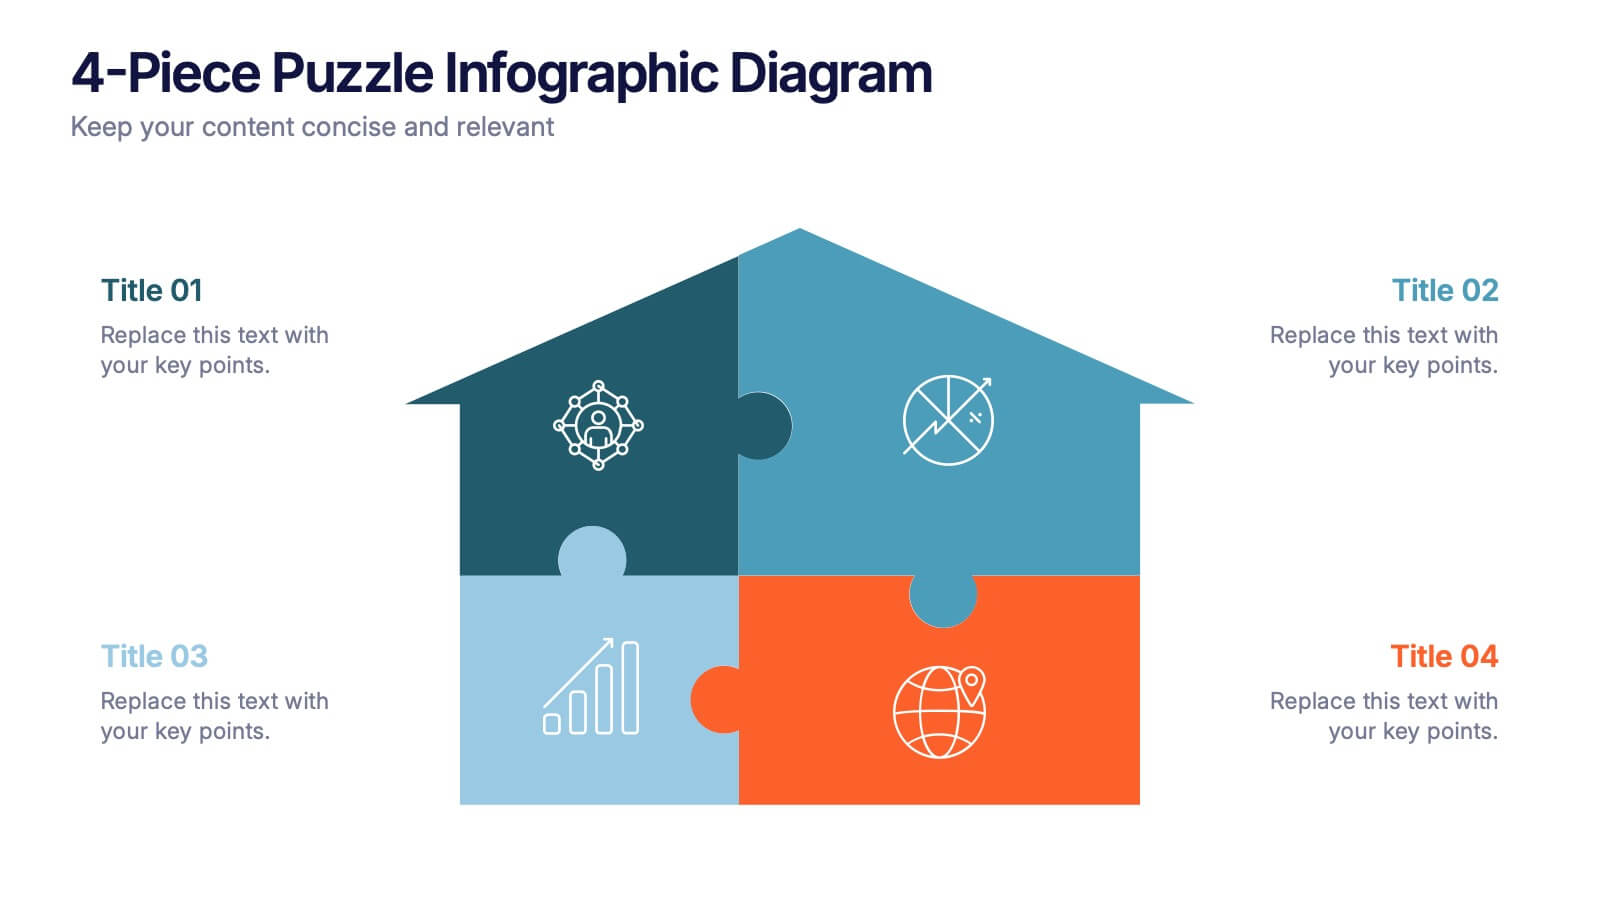

Features
- 4 Unique slides
- Fully editable and easy to edit in Microsoft Powerpoint, Keynote and Google Slides
- 16:9 widescreen layout
- Clean and professional designs
- Export to JPG, PDF or send by email


Do you have any questions?
Recommend


7 slides
Adventure Challenge Infographic
The Adventure Challenge is a concept or product designed to encourage individuals or groups to step out of their comfort zones and embrace new, exciting experiences. This infographic template is designed to spark your inner explorer and conquer new horizons. This infographic is your compass to discover, challenge, and triumph in the realm of adventure. Compatible with Powerpoint, Keynote, and Google Slides. Illustrate the metaphorical mountains you'll climb during your adventure journey. This infographic will showcase various checkpoints of your adventure, guiding you as you chart your course and achieve milestones.


4 slides
Financial KPI Analysis Presentation
Present key financial metrics with clarity using the Financial KPI Analysis slide. This layout highlights four essential indicators—MRR, Customer Count, Gross Profit Margin, and NPM—each with colorful data blocks and corresponding mini charts. A dynamic line graph and column chart provide deeper insight into monthly and categorical performance. Fully editable in PowerPoint, Keynote, and Google Slides for streamlined reporting.


8 slides
Interactive Digital Learning Experience Presentation
Make your content more engaging with the Interactive Digital Learning Experience Presentation. This layout blends quiz-style visuals and educational icons, helping you present learning modules, assessments, or training checkpoints in a fun and intuitive way. Use it to simplify information, boost audience interaction, or highlight multiple-choice content. Fully editable in Canva, PowerPoint, Keynote, and Google Slides.


7 slides
Business Law Infographic
Demystify the intricate world of business law with our Business Law Infographic. Set against a crisp white backdrop, accented with authoritative purple, trustworthy blue, and attention-grabbing yellow, our template encapsulates the gravity and nuance of legalities in the corporate sphere. Furnished with clear-cut infographics, symbolic icons, and pertinent image placeholders, it decodes legal jargon into an easily comprehensible visual format. Precisely crafted for Powerpoint, Keynote, or Google Slides. An indispensable guide for business owners, legal consultants, corporate trainers, or any entity navigating the maze of business legislation.


21 slides
Vibrant Startup Pitch Deck Presentation
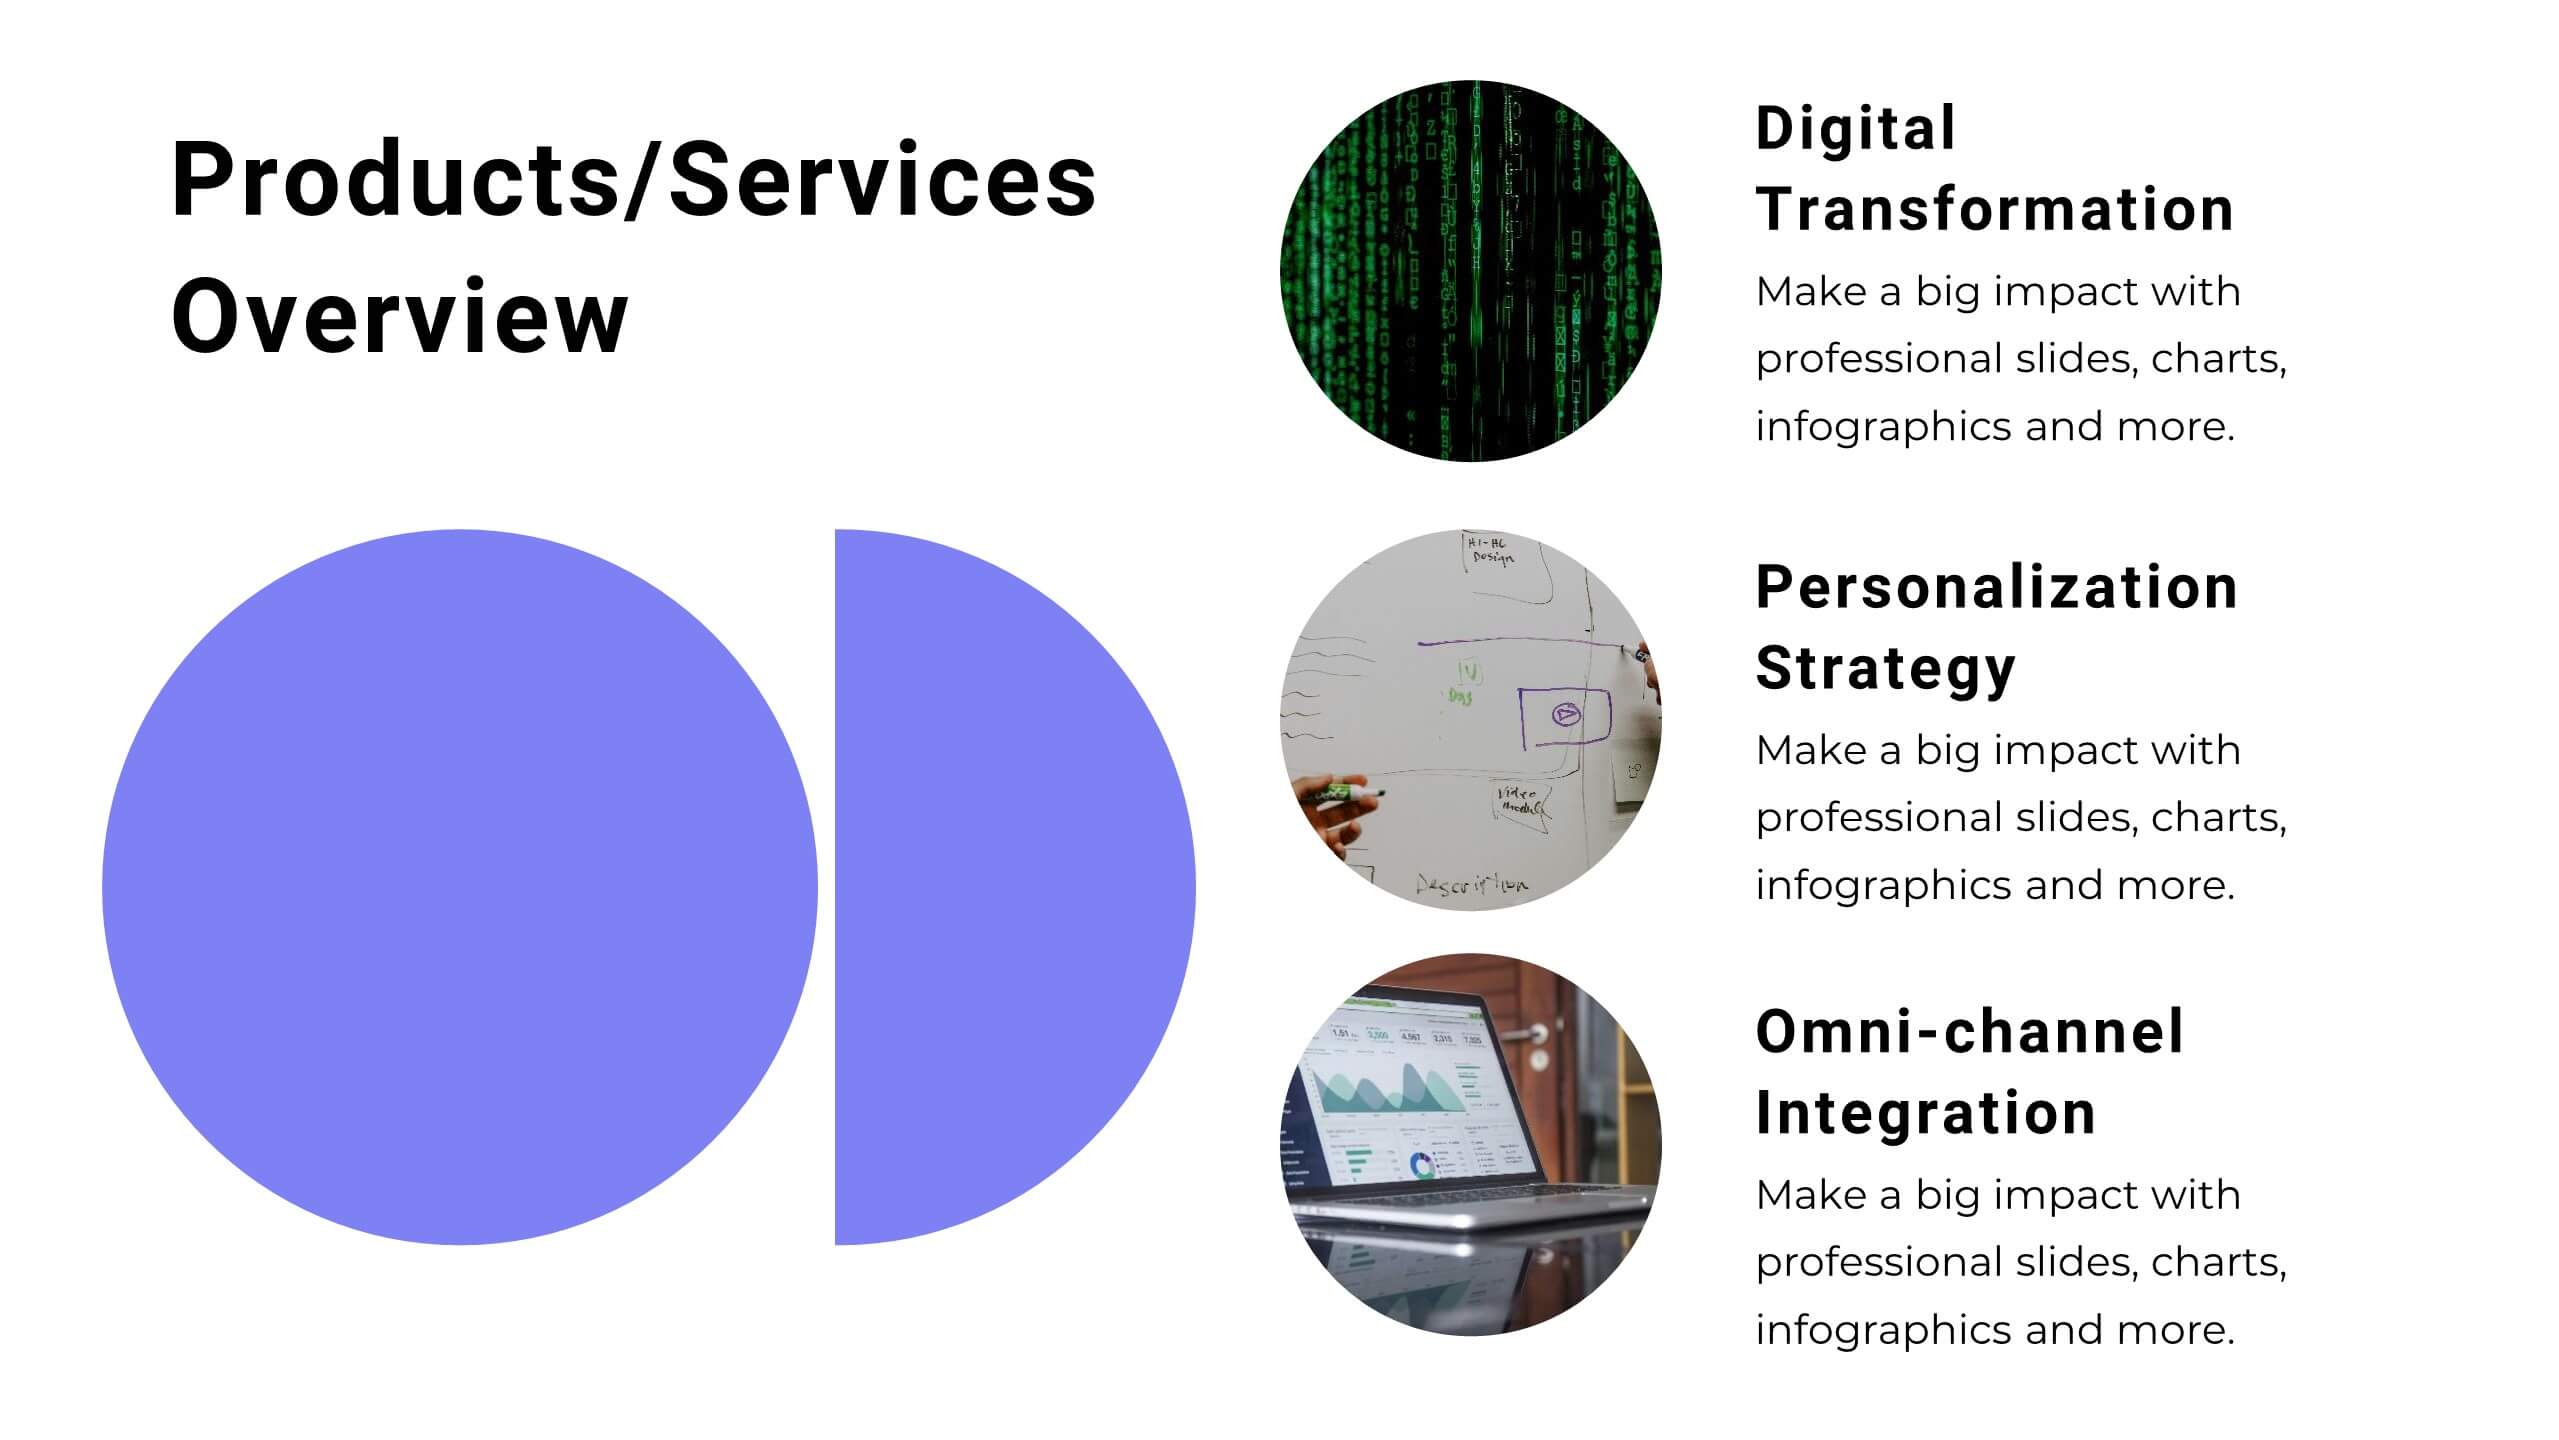
This dynamic and modern Startup Pitch Deck template is perfect for showcasing your startup's vision, strategy, and growth potential. Featuring a sleek design with bold visuals, this template guides you through key sections such as mission and vision, product/service overview, target market, and financial projections. It’s tailored to help you tell a compelling story that resonates with investors and stakeholders. The template is fully customizable in PowerPoint, Keynote, or Google Slides, ensuring you can adapt it to your specific needs and create a memorable presentation that leaves a lasting impression.


5 slides
Business SWOT Infographics
Dive deep into organizational analysis with our business SWOT infographics. Crafted in engaging shades of blue and pink, this collection is an essential tool for businesses aiming to uncover their strengths, weaknesses, and threats. This template, brimming with creative graphics and icons, is specifically designed for business strategists, educational instructors, and company executives who are keen to present SWOT analysis with clarity. Compatible with Powerpoint, keynote, and Google Slides. Its vertical, creative styling makes complex information digestible, fostering understanding and strategic thinking in your business planning sessions.


6 slides
International Law Infographics
Our International Law infographic is a versatile and informative tool for professionals and educators to incorporate into presentations on Powerpoint, Keynote, and Google Slides. It's specially crafted to elucidate the complexities of international law, making it an indispensable aid for lawyers, law students, and legal analysts. The infographic is thoughtfully designed to summarize the principles, mechanisms, and impact of international law on global relations. It provides a visual breakdown of treaties, jurisdiction, and the functions of international legal bodies. The layout is intended to guide the audience through the intricacies of international legal processes in a straightforward and comprehensible manner. Utilizing this infographic will enhance your ability to communicate the nuances of international legal frameworks effectively. It's particularly useful for lectures, seminars, or presentations that require a concise yet thorough explanation of international legal concepts. By presenting this graphic, you can foster a better understanding of how legal norms are applied across borders, promoting a more informed discussion on the subject.

21 slides
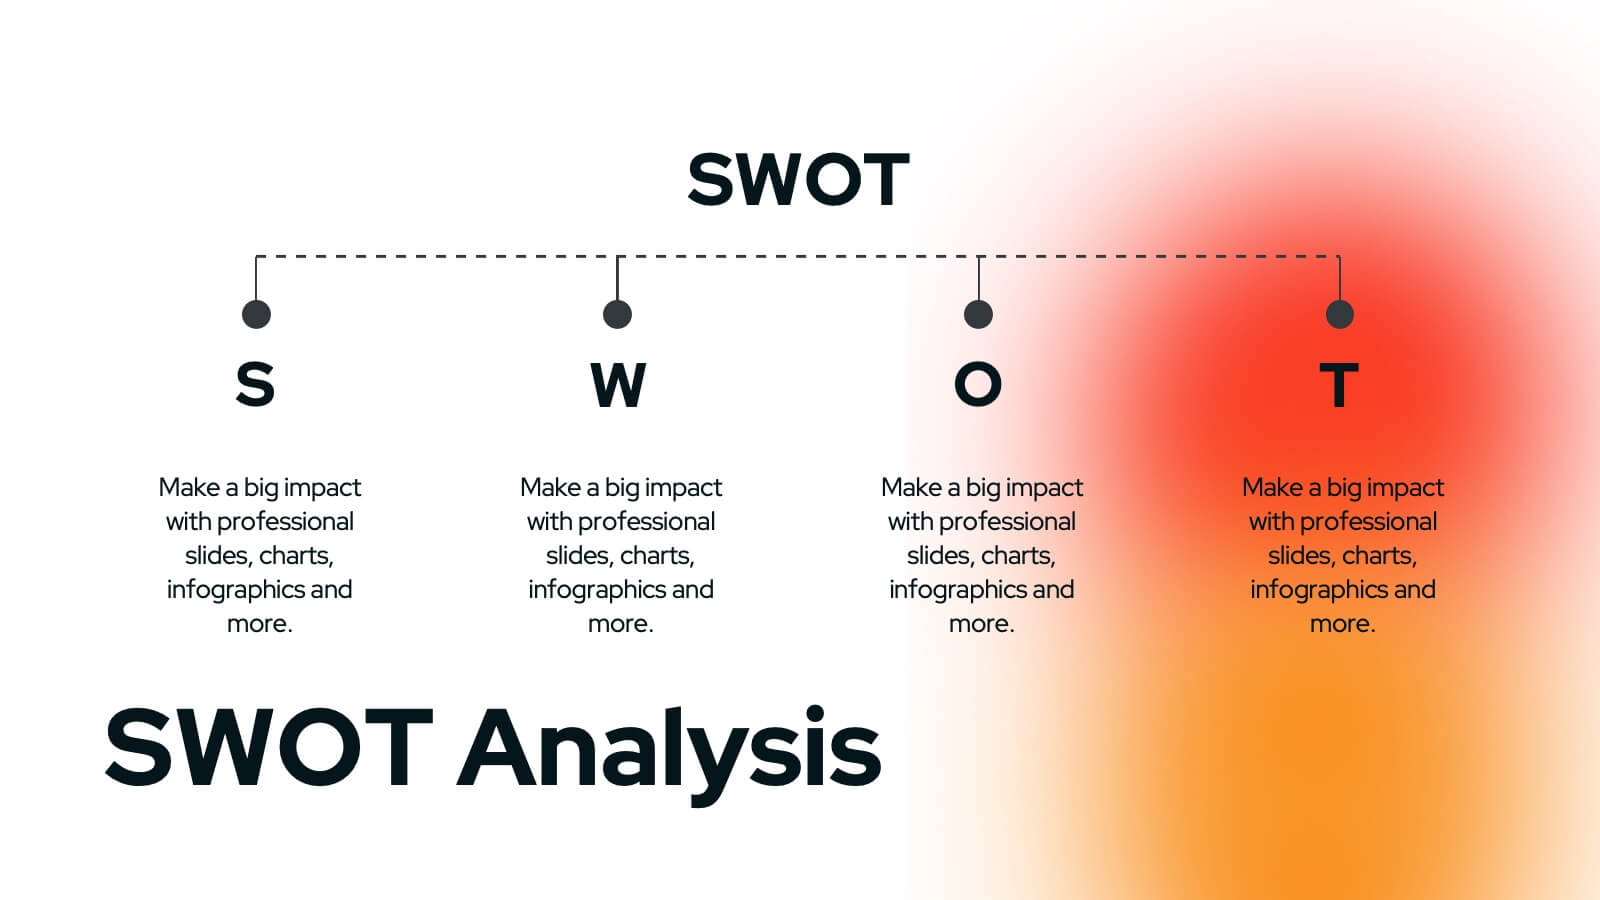
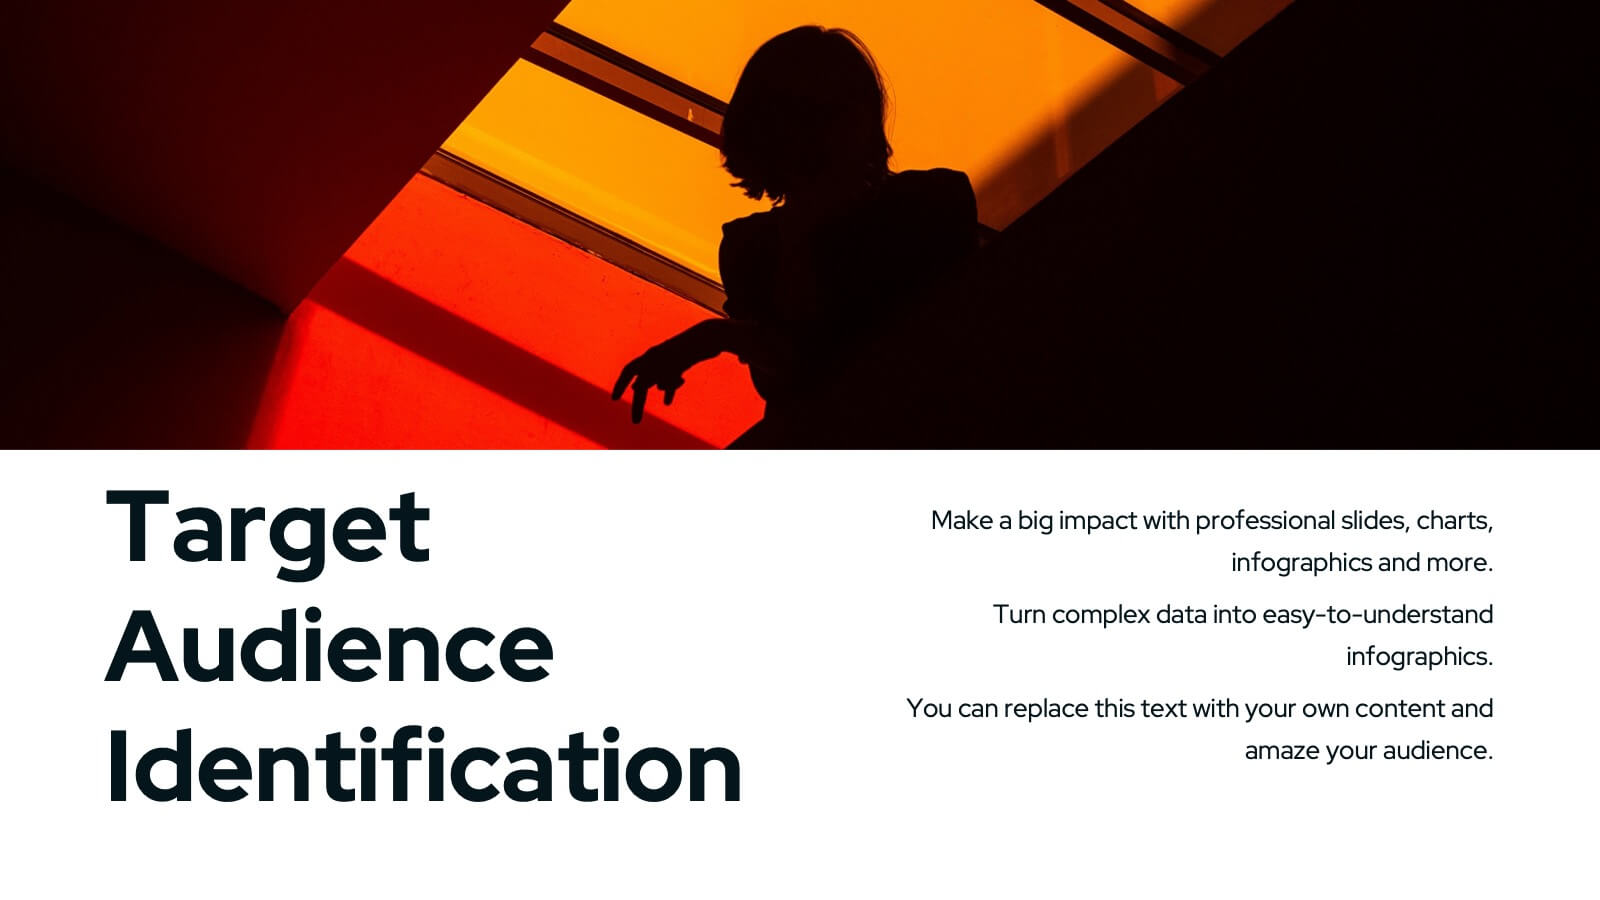
Wyrm Marketing Strategy Plan Presentation
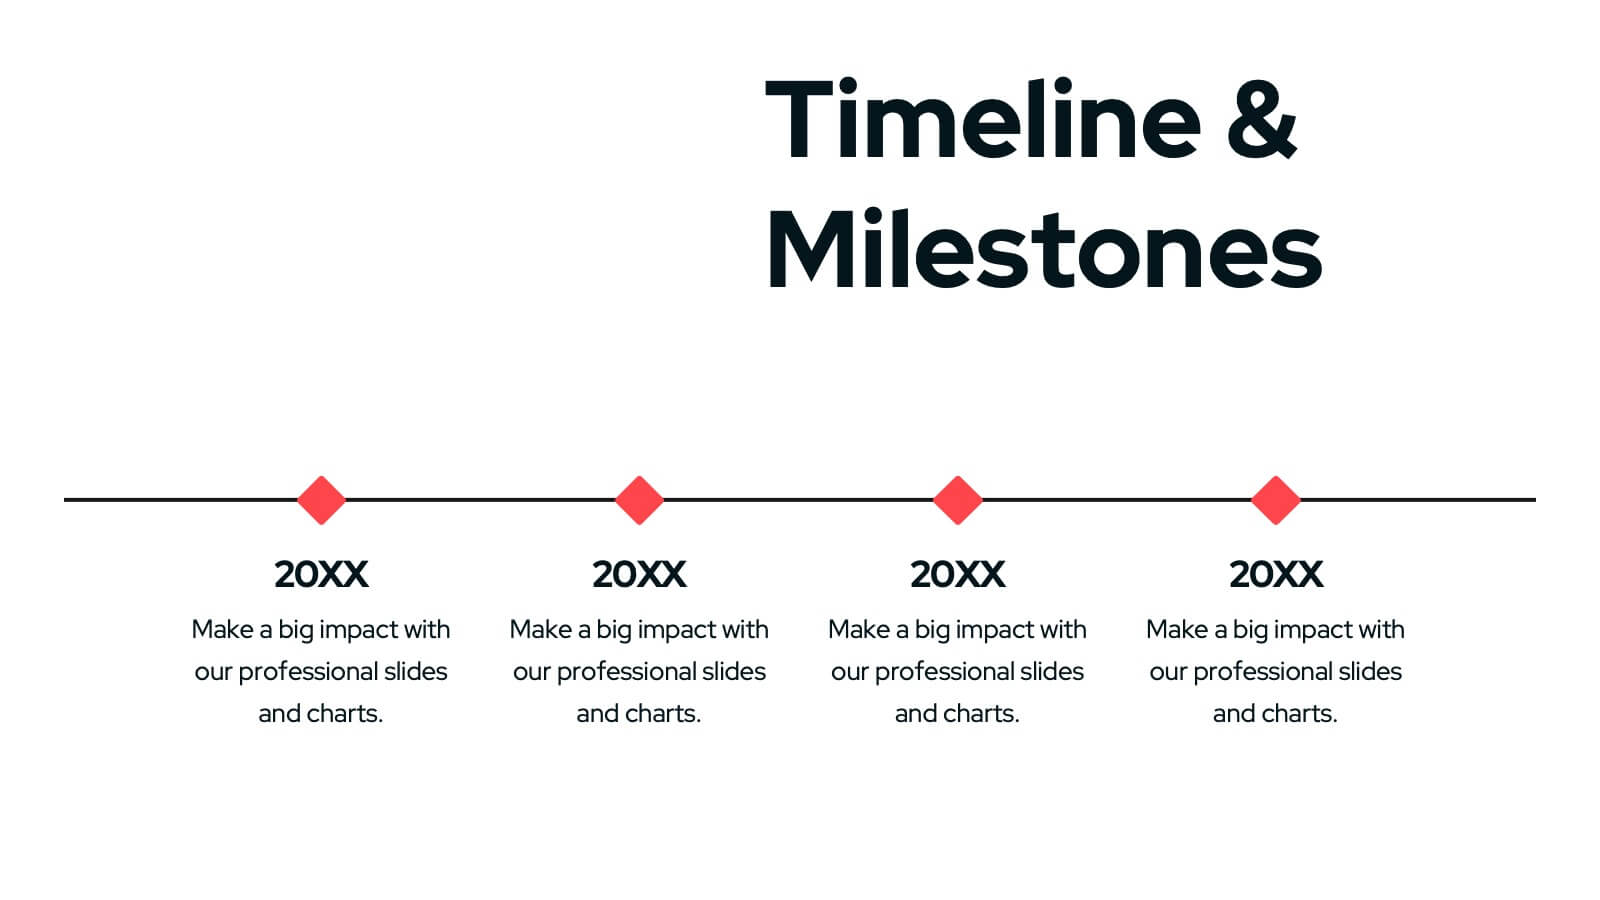
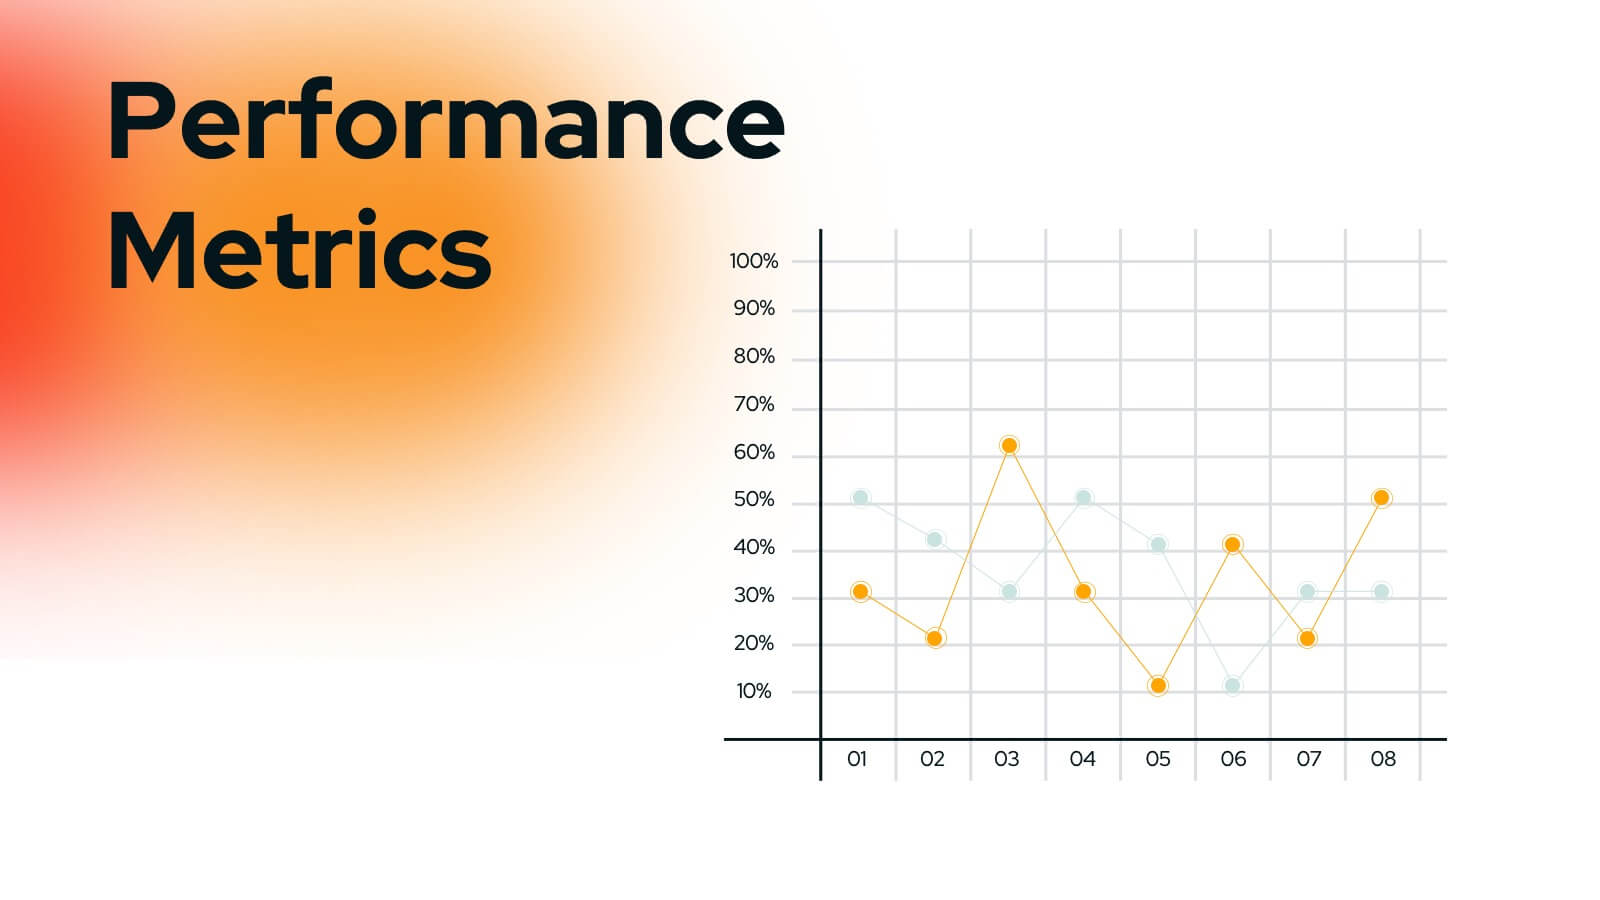
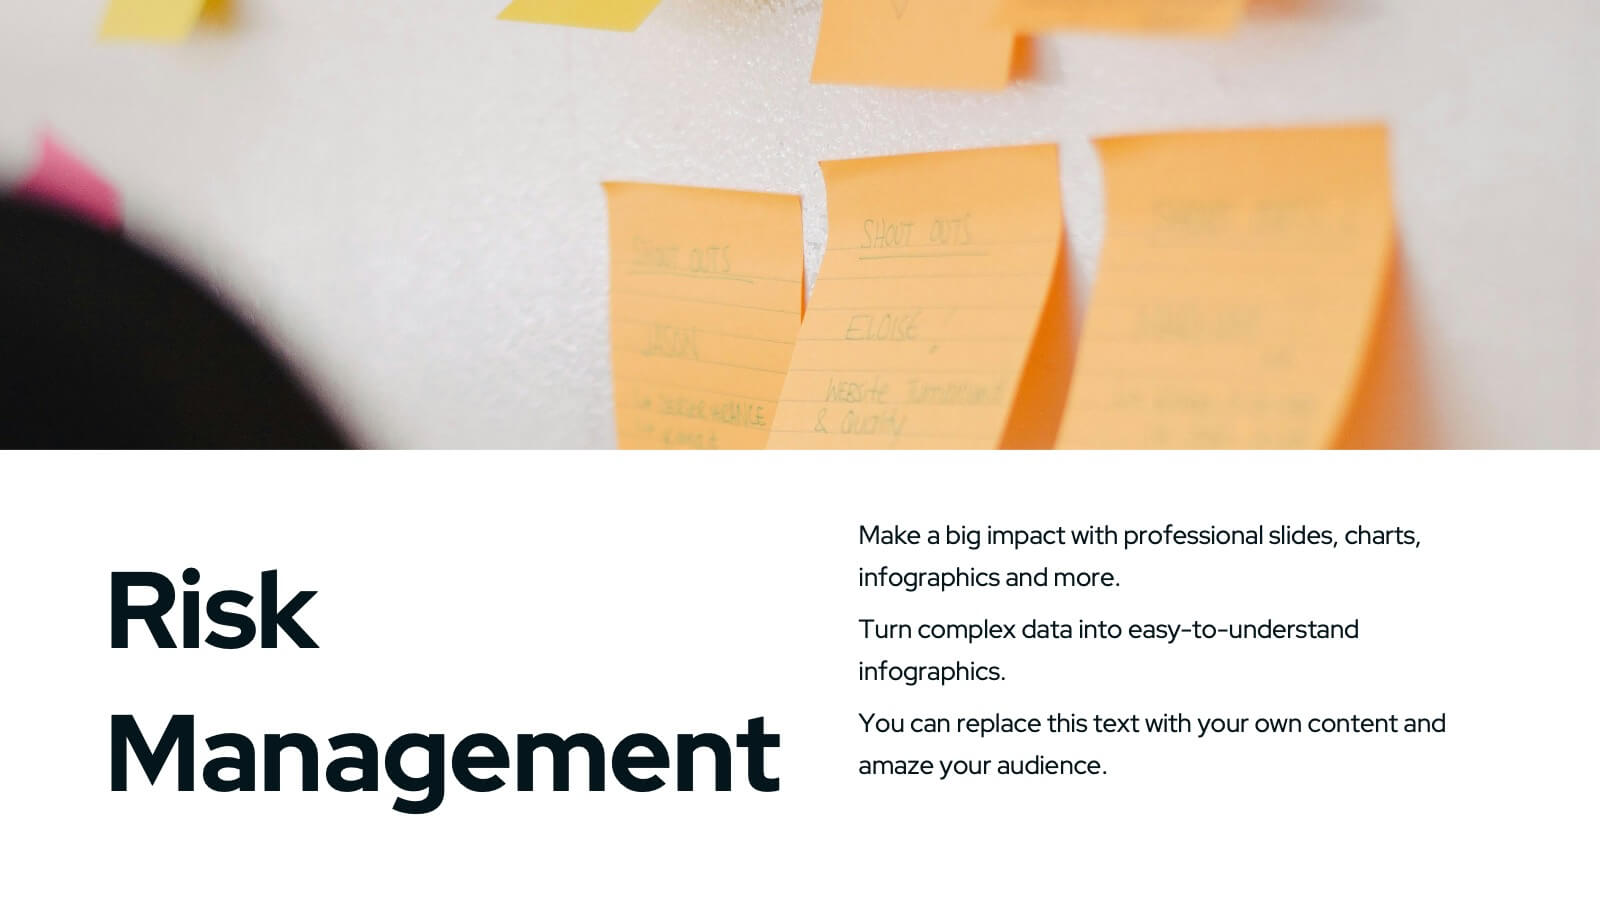
Unleash the power of your marketing strategy with this bold and dynamic presentation template! Perfect for covering everything from landscape analysis and target audience identification to performance metrics and risk management. This template helps guide your audience through key challenges, SWOT analysis, and strategic initiatives with clarity and impact. Compatible with PowerPoint, Keynote, and Google Slides for effortless and engaging presentations.


6 slides
Project Roadmap Infographic
A roadmap infographic is a visual representation that outlines the key milestones, goals, and timeline of a project or journey. This infographic template provides a structured overview of the steps and stages involved, helping to communicate the progress and direction to your audience. This template includes a timeline that represents the duration of the project or journey. It consists of a horizontal line with key milestones or stages marked along it. This infographic highlights the significant milestones of the project. These are represented as visual icons and graphic elements placed at specific points along the timeline.


8 slides
Employee Performance Review Presentation
Assess and visualize team performance effectively with these "Employee Performance Review" presentation templates. Crafted to simplify performance analysis, these slides allow you to pinpoint strengths and areas for improvement through clear, sequential visual layouts. They are perfect for managers looking to foster growth and productivity, and are fully compatible with PowerPoint, Keynote, and Google Slides.


6 slides
Product Pricing Table Comparison
Make your pricing pitch clear and compelling with this vibrant comparison table template designed for easy decision-making. Whether you're showcasing subscription plans, service tiers, or product bundles, this slide helps highlight key features and value differences at a glance. Fully editable in PowerPoint, Keynote, and Google Slides.


7 slides
Roadmap Infographic Presentation Template
A Roadmap Infographic is a visual representation of a plan or strategy for achieving a specific goal or set of goals. It includes a timeline and a series of steps or milestones that need to be accomplished in order to reach the final destination. This template is perfect for showing your plan or strategy in a fun and interactive way. This template includes lots of photo layouts and different types of charts that you can customize with your own information. Use this roadmap infographic template to show the progress of a project, the steps in a process, or the timeline for a product launch.


23 slides
Fama Business Idea Pitch Deck Presentation
Present your business idea with this impactful pitch deck, covering key areas like problem statement, solutions, competitive landscape, financials, and growth projections. With a bold design, it effectively showcases your startup’s value proposition. Compatible with PowerPoint, Keynote, and Google Slides for dynamic and professional investor presentations.


8 slides
Educational Learning and School Management Presentation
Enhance academic planning with the Educational Learning and School Management Diagram. This structured template visualizes key processes in education, ensuring a streamlined approach to school administration and curriculum development. Ideal for educators, administrators, and policymakers, it offers a clear, customizable layout to communicate strategies effectively. Fully compatible with PowerPoint, Keynote, and Google Slides.


6 slides
Profit Threshold Break-Even Calculation Presentation
Illustrate financial performance with this profit threshold timeline. The layout spans from big loss to high profit, marking each stage with flag icons and editable labels. Ideal for break-even analysis, sales strategies, or ROI comparisons. Easily customizable in PowerPoint, Keynote, and Google Slides to match your brand’s visual identity.


6 slides
Year-End Review and Financial Report Presentation
Summarize your business year clearly with the Year-End Review and Financial Report Presentation. This clean, modern layout uses quarterly donut charts and monthly timelines to help visualize performance at a glance. Ideal for financial recaps and executive meetings. Fully editable in Canva, PowerPoint, and Google Slides for easy updates and branding.


6 slides
Lean Six Sigma Framework Slide Presentation
Bring your audience in with a bold, energetic layout that makes each stage feel clear and engaging. This presentation explains the DMAIC framework in a streamlined way, helping users outline process improvement steps with confidence and clarity. Fully customizable and compatible with PowerPoint, Keynote, and Google Slides.