


Features
- 6 Unique slides
- Fully editable and easy to edit in Microsoft Powerpoint, Keynote and Google Slides
- 16:9 widescreen layout
- Clean and professional designs
- Export to JPG, PDF or send by email


Do you have any questions?
Recommend


5 slides
Regional Sales Heatmap Presentation
Showcase performance by region with this Regional Sales Heatmap Presentation. This template highlights U.S. state-by-state sales data using gradient color coding and a clear legend system. Easily customizable for quarterly reports, territory analysis, or sales strategy reviews. Compatible with PowerPoint, Keynote, and Google Slides.


6 slides
Measuring User Experience with Smile Ratings Presentation
Visualize customer sentiment with this Smile Rating UX slide. Featuring vertical smile meter graphics with corresponding percentages and descriptions, it’s ideal for product feedback, service evaluations, or usability reports. Clearly distinguish satisfaction levels across three stages or categories. Fully customizable in PowerPoint, Keynote, and Google Slides.


6 slides
Tables of Content Analysis Infographic
Table of Contents analysis refers to the examination and evaluation of the structure and content of a document's table of contents. It is commonly used as a preliminary step to understand the flow of information within a longer document, such as a book, report, thesis, or research paper. This infographic template provides insights into the document's structure and can help readers determine whether the document is relevant to their needs. This infographic is designed to provide a quick overview of the topics covered in the document and their distribution, helping readers understand the organization of the content at a glance.


26 slides
Ander Presentation Template
We are proud to present Ander a unique, creative and professional template that's perfect for creating inspiring presentations, portfolios and business documents. With this business presentation template, you can easily share your ideas, company identity, and other information more closely with the public in an easy-to-understand way. With light earthy tones, peaceful aesthetic, clean and aesthetically pleasing design you’ll be sure to make your business stand out from the rest of the competition.


26 slides
Becka Presentation Template
Becka is a modern and powerful template for people who want to present themselves in a professional but bold way. Perfect for the CEO or company executive who wants to have a strong presence on screen. Made with clear and crisp typography, with added bold colors that appeal to both men and women which can evoke powerful emotions and confidence. This template contains easy to edit maps, charts and image place holders that are ready to use. The dynamic slides make it quick and easy to create the perfect presentation.


7 slides
Social Media Marketing Infographic
Social Media Marketing refers to the use of social media platforms and networks to promote a product, service, or brand. This fully editable, infographic template looks great on all devices and contains all complete set of slides shown above. You can use this colorful infographic to features tips on how to use social media posts, videos, chats and websites along with a brief explanation of each. Add your logo, banner images and call to action. The template is compatible with Powerpoint, Keynote and Google Slides, so you can easily add in your custom data for a professional finish.


5 slides
Workout Motivation Infographics
Finding and maintaining Workout Motivation is a personal journey. These vertical infographics are informative designs that aim to inspire and motivate individuals to maintain an active and healthy lifestyle. This template is perfect for fitness professionals, personal trainers, health coaches, or anyone looking to create engaging content about workout motivation. With its vibrant and dynamic visuals, the template captures the essence of fitness and encourages viewers to embark on their fitness journey. They are designed with eye-catching icons, illustrations, and color schemes that grab attention and make the information easy to understand and remember.


5 slides
Team Collaboration Goals Presentation
Bring your teamwork vision to life with a clean, engaging layout that makes every goal feel clear and achievable. This presentation helps you outline priorities, align roles, and highlight shared milestones in a visually balanced format. Perfect for project kickoffs or planning sessions. Fully compatible with PowerPoint, Keynote, and Google Slides.


21 slides
Werewolf Scientific Research Presentation
This scientific research presentation template is designed to streamline your research findings with clarity and precision. It features sections for literature review, methodology, data analysis, and key results, ensuring every detail is communicated effectively. Perfect for academic or scientific contexts, it’s fully customizable in PowerPoint, Keynote, and Google Slides.


5 slides
AI for Business Innovation Presentation
The "AI in Business" presentation template showcases how AI can be applied across different business processes. It features a friendly robot icon that creatively represents AI's role in modern business, making it visually engaging. The four connected nodes A, B, C, and D likely detail specific applications or case studies of AI in business, such as data analysis, automation, customer interaction, and innovation. This layout is excellent for presentations that aim to explain complex technological implementations in a straightforward and accessible manner, perfect for corporate training or stakeholder briefings.


4 slides
Nutrition and Diet Plan Presentation
Present your wellness programs with clarity using this circular nutrition infographic. Ideal for showcasing food groups, dietary recommendations, or balanced meal plans, this layout uses segmented visuals and icons for better understanding. Perfect for nutritionists, wellness coaches, or healthcare professionals. Compatible with PowerPoint, Keynote, and Google Slides.


8 slides
Corporate Mission Purpose Slide
Wave your flag of purpose with this bold, banner-inspired layout—ideal for communicating your corporate mission, core principles, and company values. Each section gives space to articulate what drives your business forward in a visually unified way. Fully compatible with PowerPoint, Keynote, and Google Slides.


8 slides
Africa Market Potential and Improvement Map Presentation
Visualize market opportunities across Africa with this insightful map template. Featuring percentage-based growth indicators and color-coded country highlights, it’s perfect for showcasing regional potential, trends, and business expansion strategies. Fully customizable in PowerPoint, Keynote, and Google Slides, this template supports clear, data-driven storytelling for marketing, economic, or strategic presentations.


10 slides
Creative Business Pitch Deck Presentation
Make your ideas stand out with a presentation that blends creativity and professionalism. Perfect for entrepreneurs and teams showcasing innovative business concepts, it helps structure your pitch with clarity and impact. Fully customizable and compatible with PowerPoint, Keynote, and Google Slides for seamless editing and polished results.

21 slides
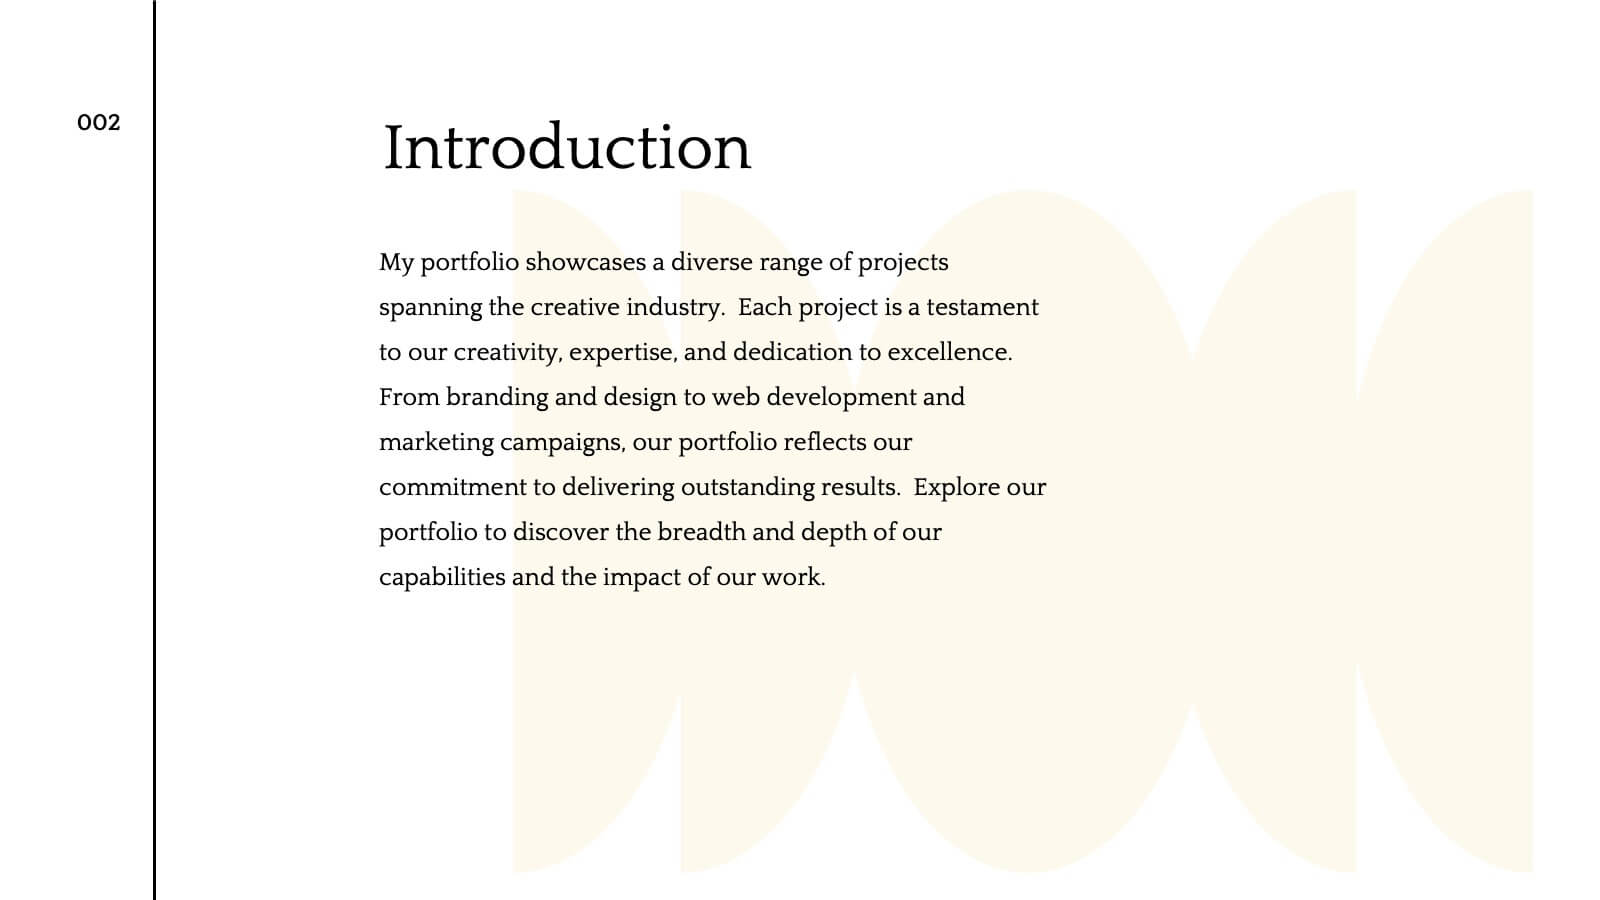
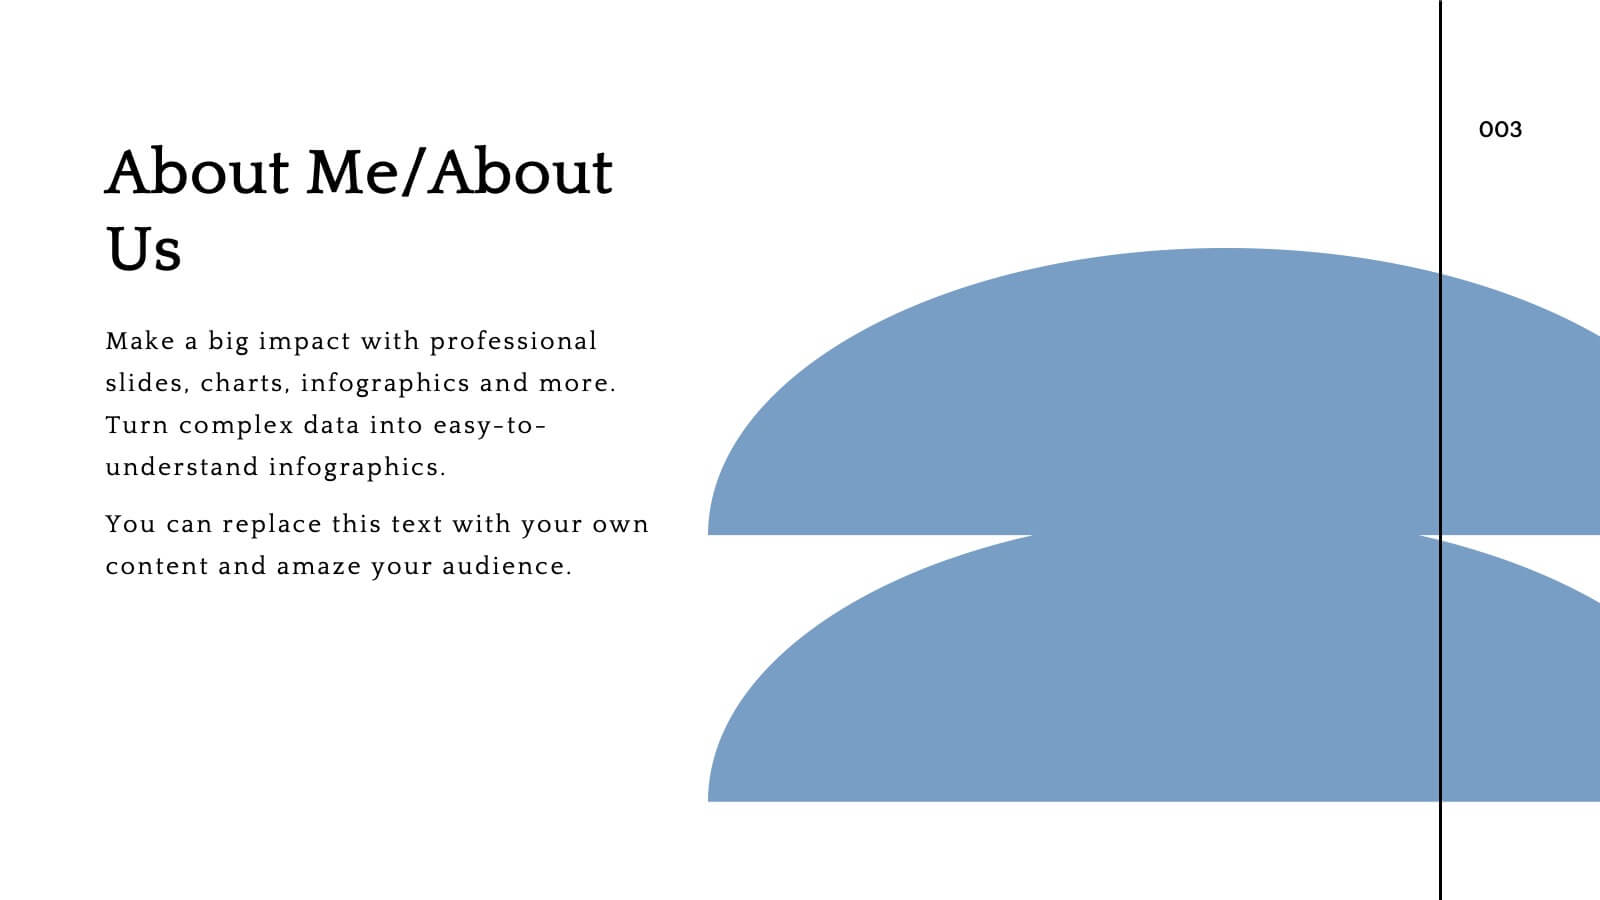
Flare Creative Portfolio Presentation
Showcase your creative work with this elegant portfolio template! Perfect for highlighting projects, client testimonials, and services offered. Ideal for artists, designers, and creatives aiming to impress clients and collaborators. Compatible with PowerPoint, Keynote, and Google Slides, this template ensures your portfolio is clear, professional, and visually stunning. Make your work shine!


7 slides
Data Analysis Process Infographic
Illuminate the intricacies of the data-driven world with our Data Analysis Process Infographic. Set against the crisp backdrop of white and accented with the brilliance of yellow, the growth-centric green, and the depth of blue, our template brings clarity to the complex realm of data analytics. Outfitted with sharp infographics, intuitive icons, and adaptable image placeholders, it translates raw data into actionable insights. Exquisitely crafted for Powerpoint, Keynote, or Google Slides. A crucial tool for data scientists, business analysts, strategists, or any organization looking to harness the power of data. Analyze with precision; let every slide unravel the stories data tells.


21 slides
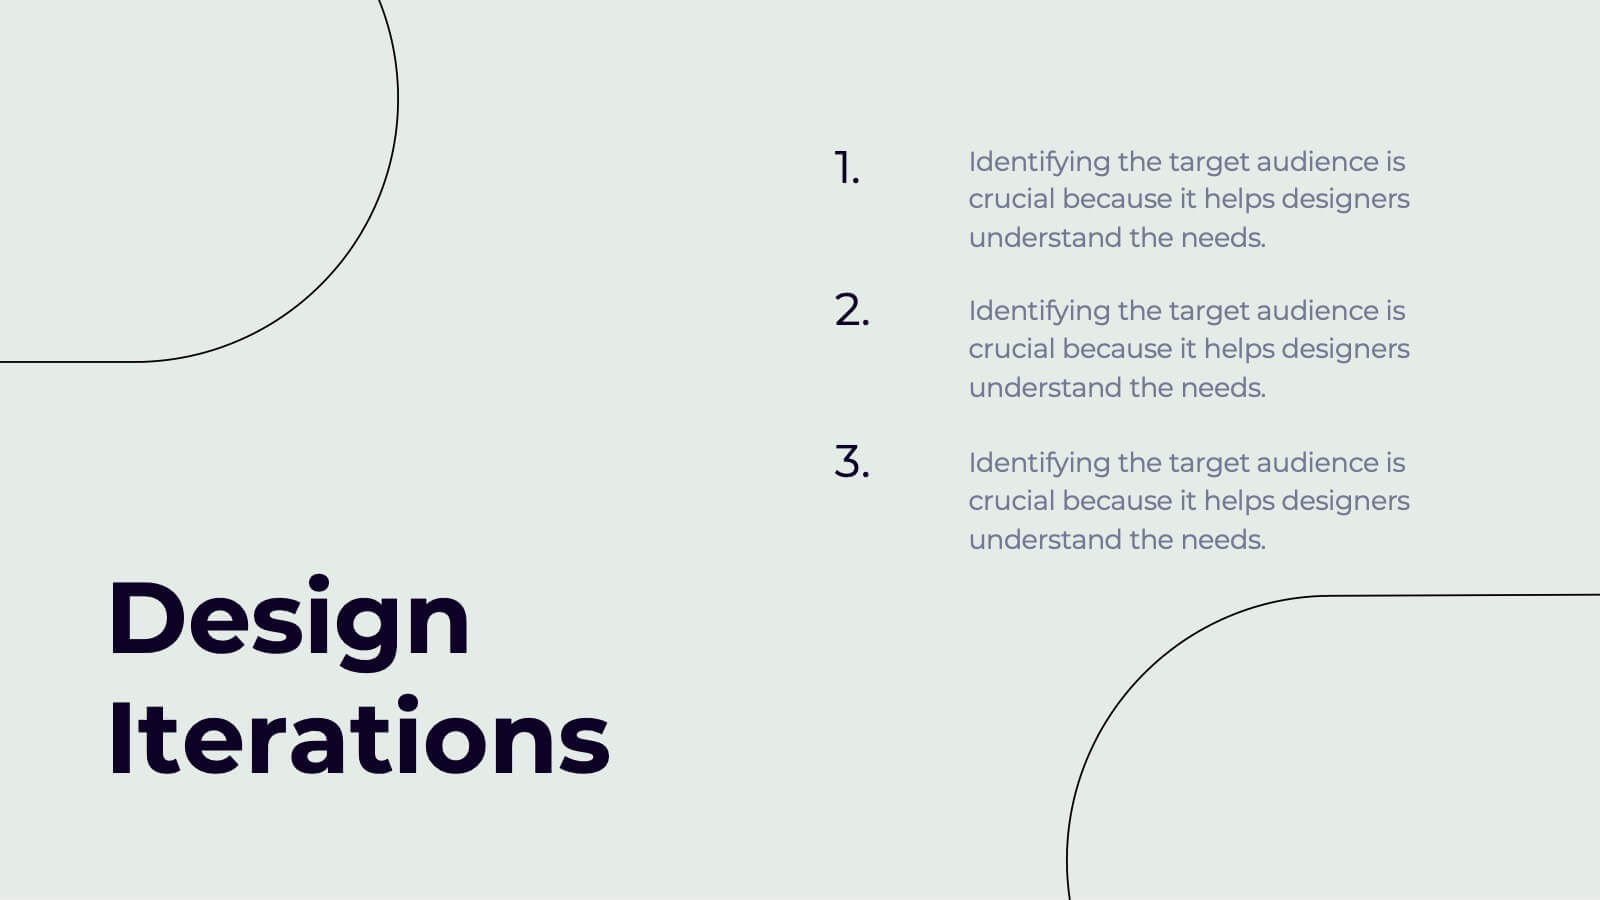
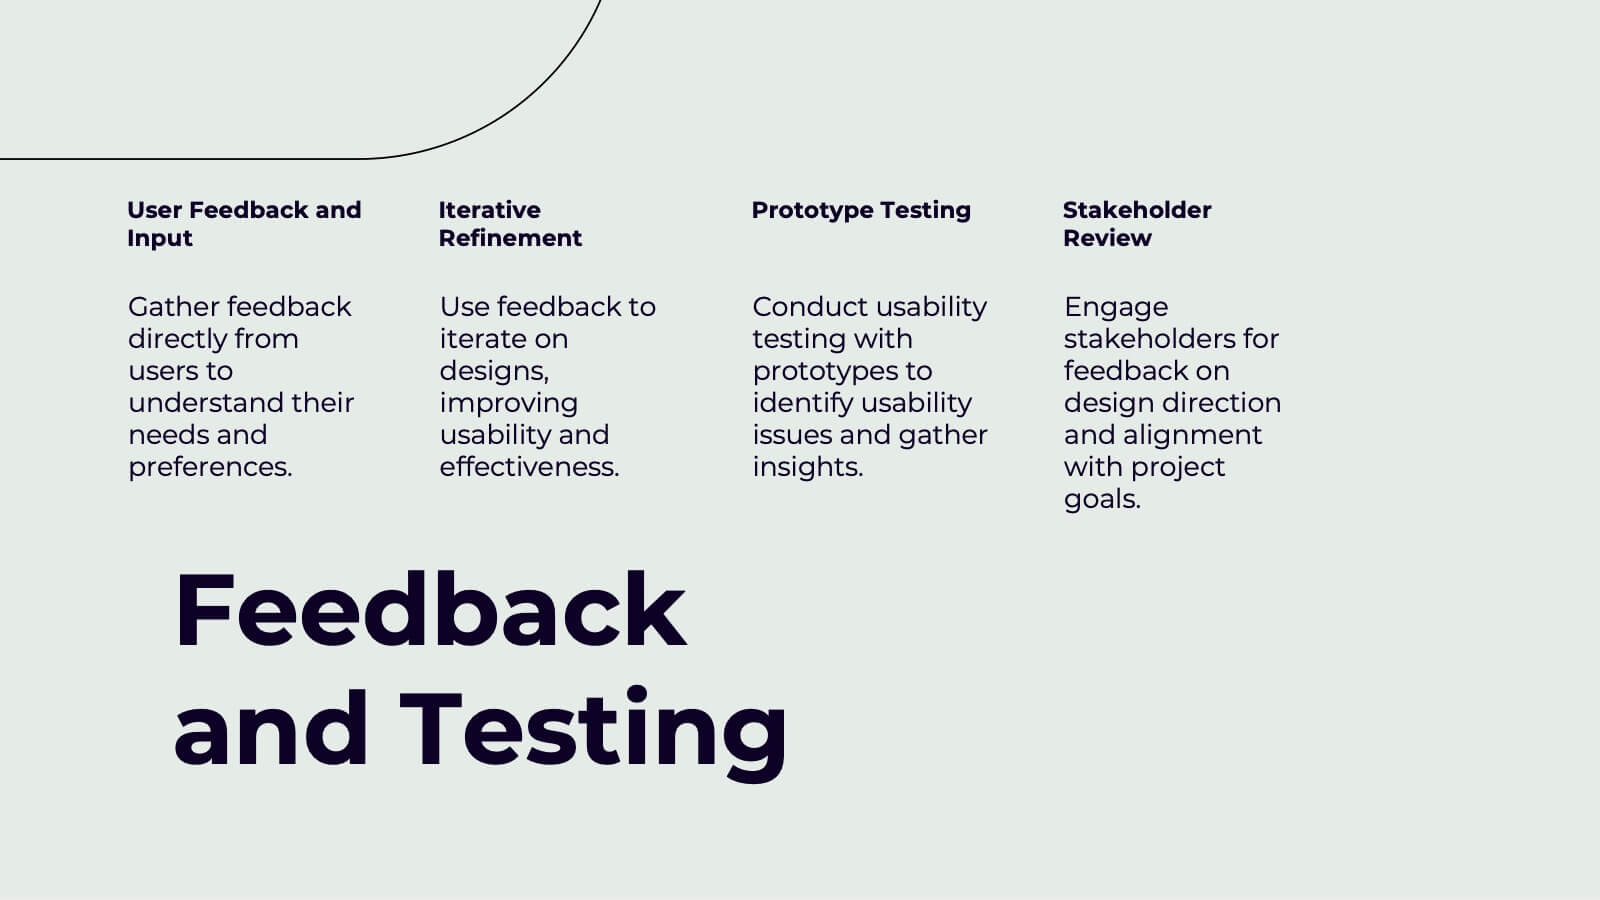
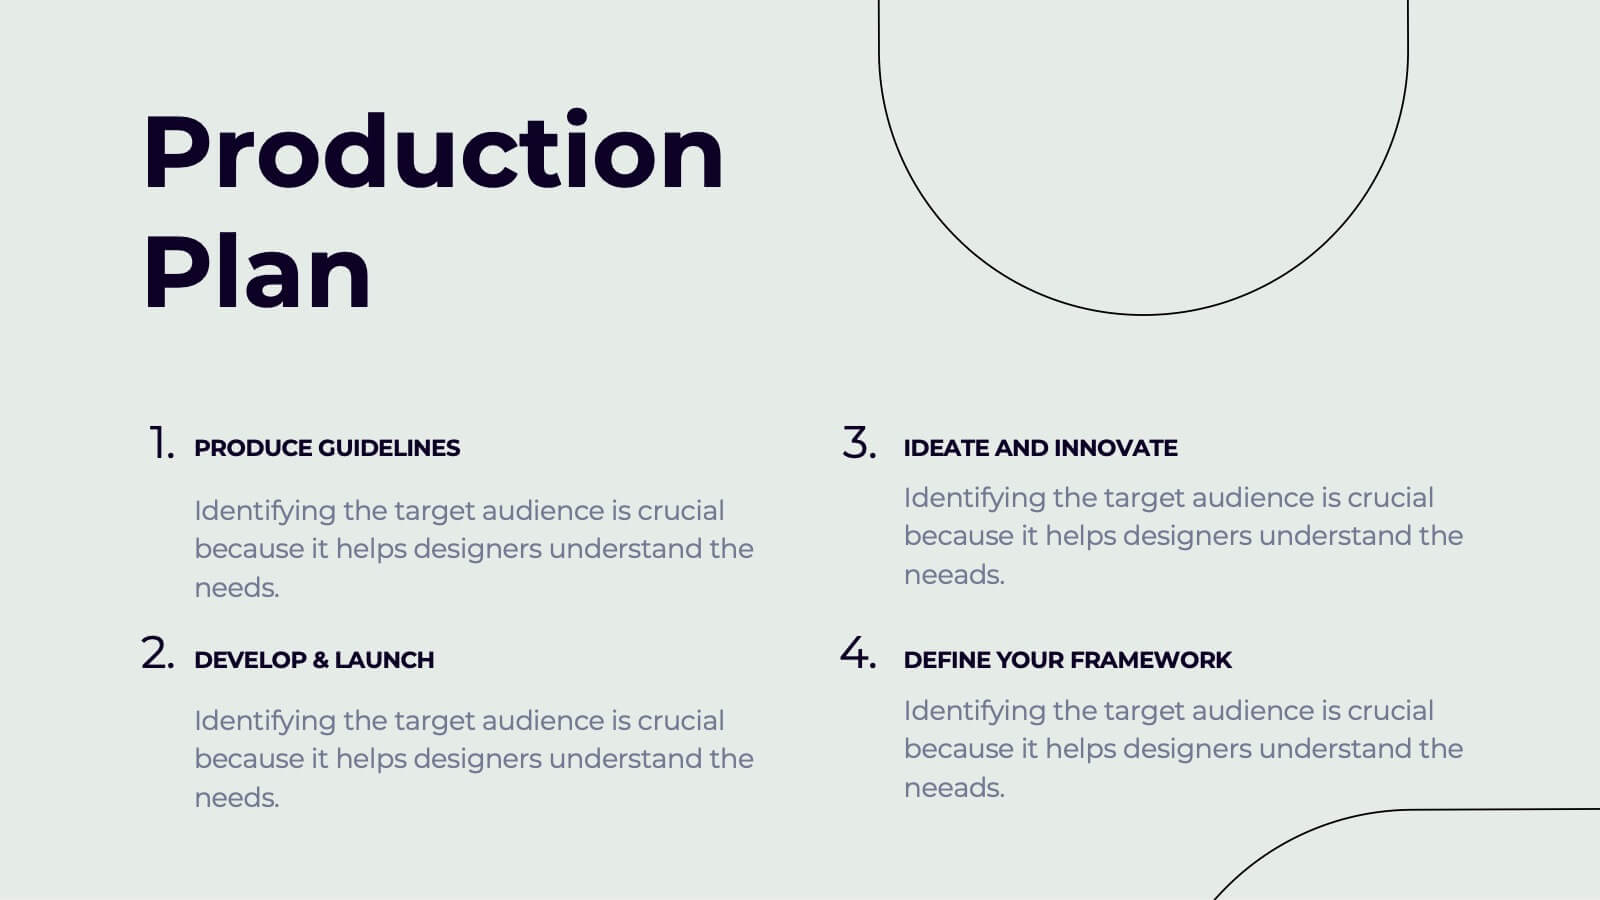
Yeti Creative Design Report Presentation
This modern design report template covers everything from concept development to design iterations and feedback testing. It’s visually striking, with sections for color schemes, typography, textures, and production plans. Ideal for showcasing creative projects and delivering professional presentations. Compatible with PowerPoint, Keynote, and Google Slides for ease of use.