


Features
- 4 Unique Slides
- Fully editable and easy to edit in Microsoft Powerpoint, Keynote and Google Slides
- 16:9 widescreen layout
- Clean and professional designs
- Export to JPG, PDF or send by email


Do you have any questions?
Recommend


4 slides
Cost Breakdown for Business Planning Presentation
Visually balance your budget strategy with the Cost Breakdown for Business Planning Presentation. Featuring a scale-style layout, this slide helps you compare two financial metrics or allocations with clarity and simplicity. Ideal for showcasing trade-offs, resource planning, or funding distribution. Fully editable in PowerPoint, Google Slides, Keynote, and Canva.


7 slides
5G Mobile infographic Presentation
5G technology is important because it has the potential to transform the way we live, work, and interact with the world around us. This template is designed to help you create an eye catching and informative infographic on the topic of 5G technology. With this template, you can easily showcase the benefits and capabilities of 5G in an easy to understand way. This template features a vibrant and clean design, with uniquely selected color schemes and fonts to ensure that the content is visually appealing. It includes a variety of slide layouts, including text slides, images, charts and graphs!


5 slides
Workout Benefits Infographics
Engaging in regular workouts and physical exercise offers numerous benefits for both physical and mental well-being. These vertical infographic templates aim to motivate and educate individuals about the positive impact of workouts on physical health, mental well-being, and overall quality of life. These infographics are the perfect tools to be used in presentations, educational material, or fitness campaigns, this template helps inspire and inform viewers about the significant benefits of incorporating workouts into their daily routines. Compatible with Powerpoint, Keynote, and Google Slides.


5 slides
HIV Prevention & Awareness Infographics
HIV Prevention and Awareness play a crucial role in combating the spread of the virus and reducing the impact of HIV/AIDS on individuals and communities. These infographic templates are designed to educate and raise awareness about HIV prevention and promote safer behaviors. These infographics provide a visually compelling way to present key information, statistics, and strategies related to HIV prevention and awareness. The templates features a range of eye-catching charts and icons that can be easily customized to suit your specific needs. Compatible with PowerPoint, Keynote, and Google Slides.


6 slides
Pyramid Triangle Diagram Presentation
Build your ideas from the ground up with this bold, layered layout that turns complex hierarchies into simple, engaging visuals. Perfect for illustrating processes, priorities, or business frameworks, it gives your message a clear structure and flow. Fully compatible with PowerPoint, Keynote, and Google Slides for smooth customization.


5 slides
Value Chain Business Model Presentation
Spark fresh insight into how your organization creates value with this clean, arrow-based layout that makes every step feel intuitive and action-ready. This presentation breaks down key activities, support processes, and improvement opportunities in a clear visual flow perfect for strategy discussions. Fully compatible with PowerPoint, Keynote, and Google Slides.


5 slides
Relationship Mapping Diagram Presentation
Bring clarity to complex connections with this clean and modern visual layout designed to map relationships, processes, or ideas effortlessly. Perfect for presentations that require structure and flow, it balances simplicity with professionalism. Fully customizable and compatible with PowerPoint, Keynote, and Google Slides for seamless design flexibility.


3 slides
Remote Work Culture and Guidelines Presentation
Bring remote teamwork to life with visuals that speak your culture. This presentation template simplifies how you communicate expectations, structure, and values for virtual teams. Perfect for onboarding, policy updates, or outlining collaboration tools, it’s designed to keep your message clear and consistent. Fully compatible with PowerPoint, Keynote, and Google Slides.


6 slides
TAM SAM SOM for Target Reach Forecasting Presentation
Break down your market reach with clarity using the TAM SAM SOM for Target Reach Forecasting Presentation. This sleek, layered circle diagram is ideal for illustrating your total addressable market, serviceable market, and obtainable market. Customize easily in PowerPoint, Keynote, or Google Slides to align with your brand and business strategy.


4 slides
Restaurant Menu Design Showcase Presentation
Showcase your food offerings with this stylish Restaurant Menu Design Template. Divided into clear sections—Menu, Drinks, and Desserts—it’s perfect for restaurants, cafés, or pop-up events. Fully editable in PowerPoint, Keynote, and Google Slides, this layout lets you present items cleanly with bold titles and organized structure for easy viewing.


5 slides
Market Economy Infographics
A market economy is an economic system where the production, distribution, and pricing of goods and services are determined by the interactions of individuals and businesses in the market. These vertical infographics are visually compelling design that explains the fundamental principles and characteristics of a market economy. This infographics is ideal for economists, business analysts, educators, and anyone looking to educate others about how market economies work and their impact on society. The infographics incorporate relevant statistics and data to support the information presented. Compatible with Powerpoint, Keynote, and Google Slides.


20 slides
Spectrumion Sales Performance Report Presentation
Enhance your sales strategy with this performance report template, covering objectives, process, metrics, and opportunities. Ideal for tracking progress and identifying growth areas, it ensures clear communication and actionable insights. Compatible with PowerPoint, Keynote, and Google Slides for versatile and professional presentations.


6 slides
Business RAPID Model Diagram Presentation
Turn decision-making into a visual story with this bold, professional diagram that highlights each stage of responsibility and collaboration. Designed to simplify complex workflows, it’s perfect for outlining business strategies, performance reviews, or team structures. Fully compatible with PowerPoint, Keynote, and Google Slides for easy editing and presentation.


7 slides
5G Benefits Infographic
Step into the ultra-fast world of 5G with our vibrant 5G benefits infographic. Set against a lively pink backdrop with bursts of other vivid colors, this infographic captures the essence of dynamism and speed. Sleek icons paired with concise descriptions highlight the myriad advantages of 5G, from lightning-fast downloads to broader bandwidth. This modern, innovative infographic is ideal for telecom companies, tech enthusiasts, businesses leveraging 5G, and educators discussing modern communication technologies. Designed for adaptability, it's compatible with PowerPoint, Keynote, and Google Slides.


20 slides
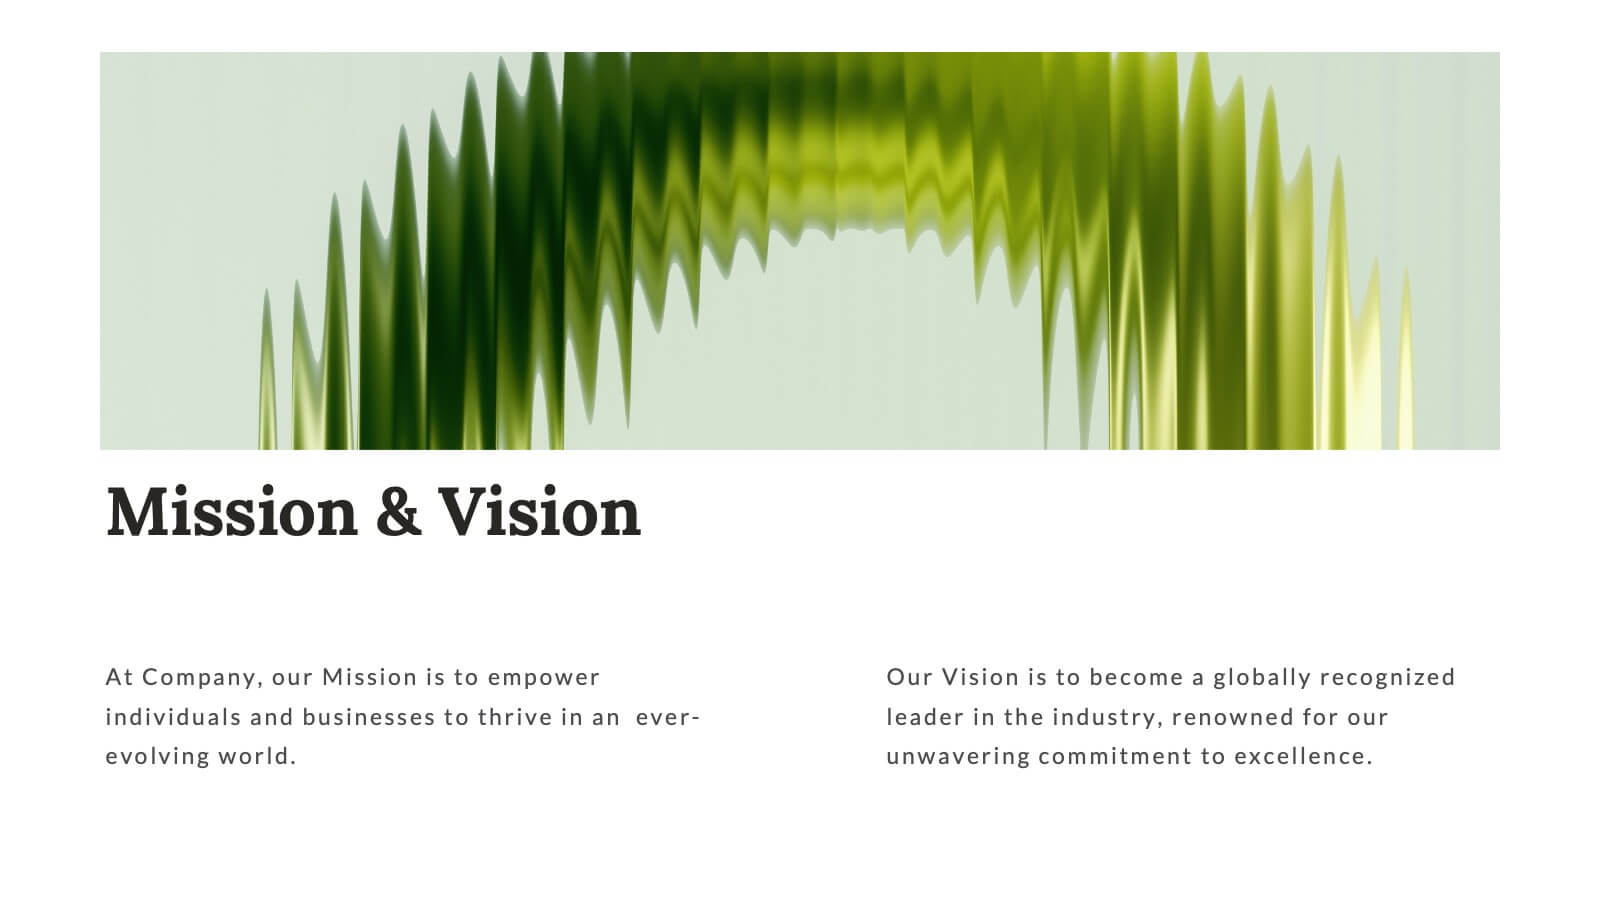
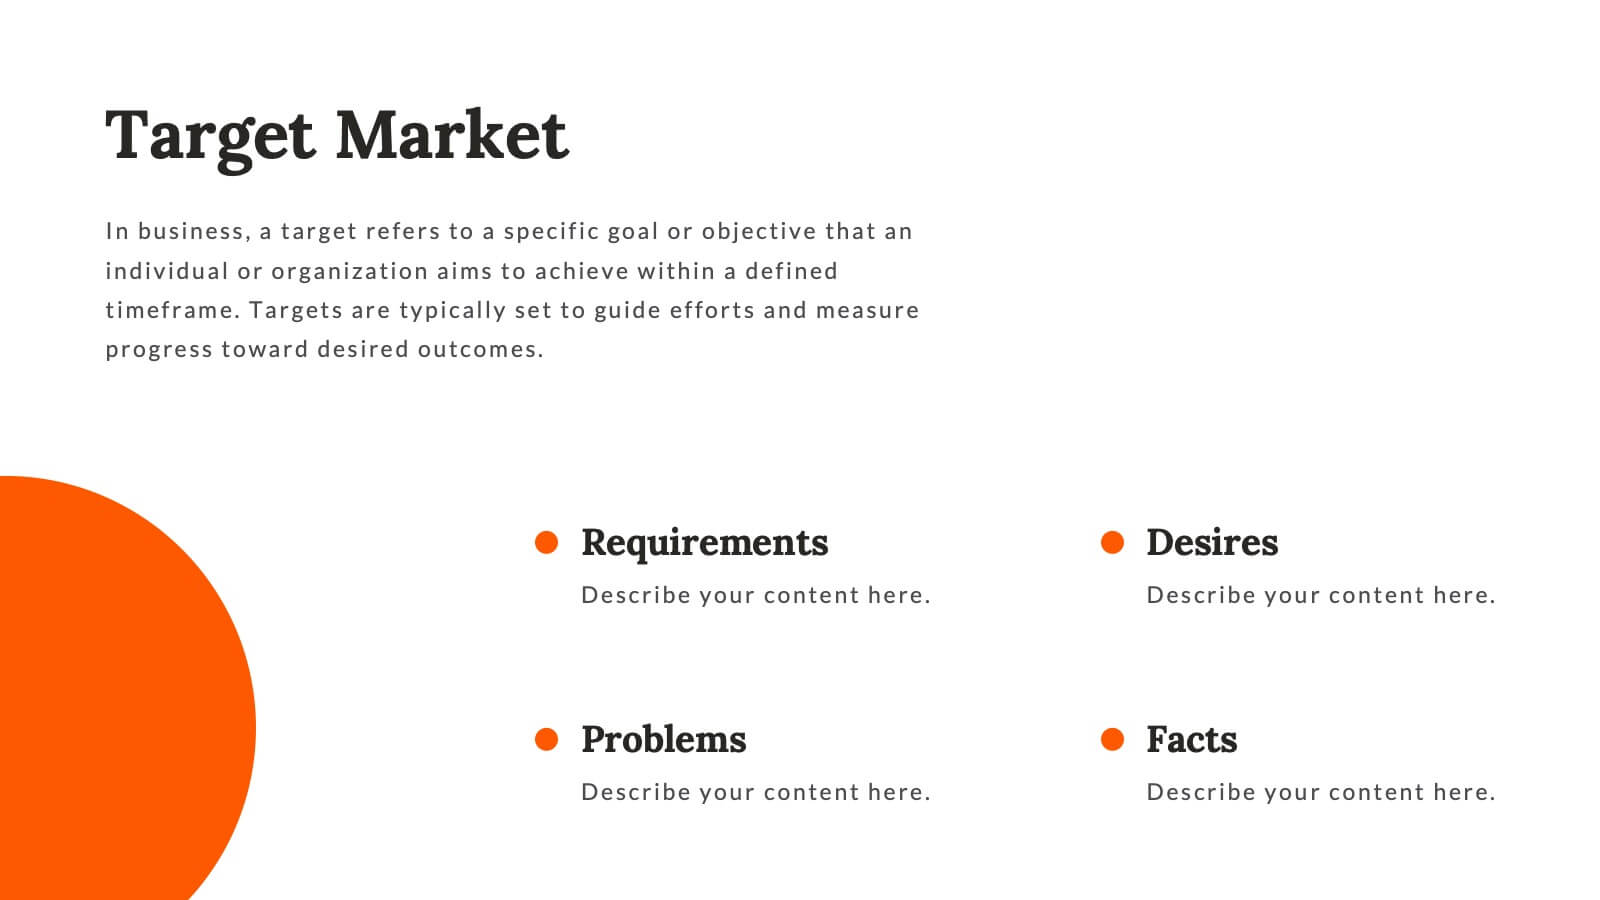
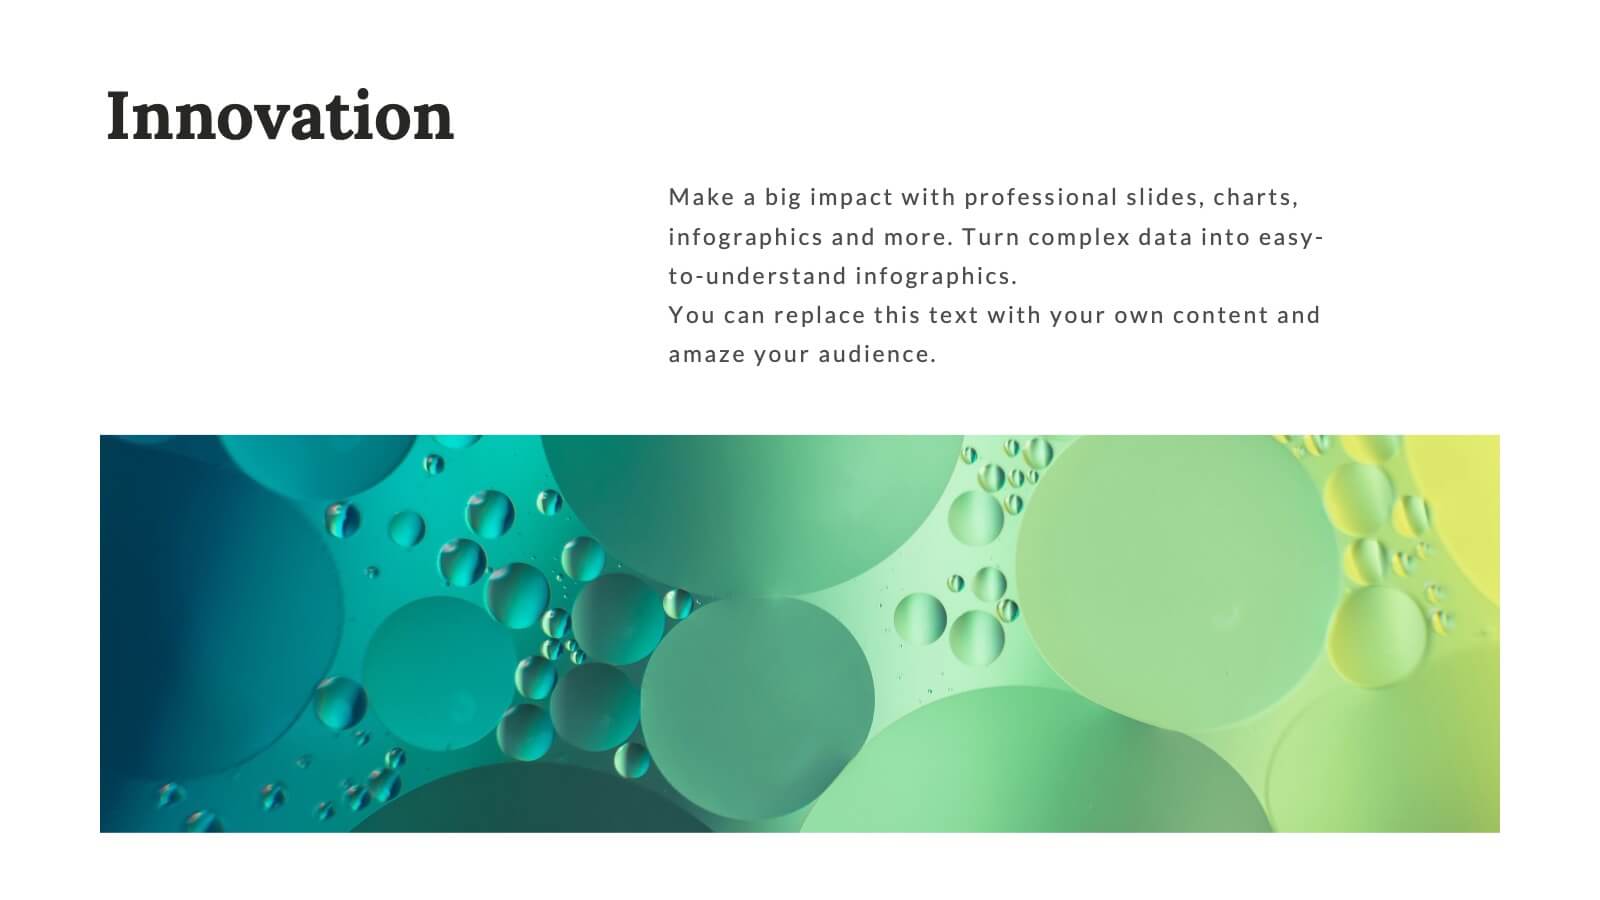
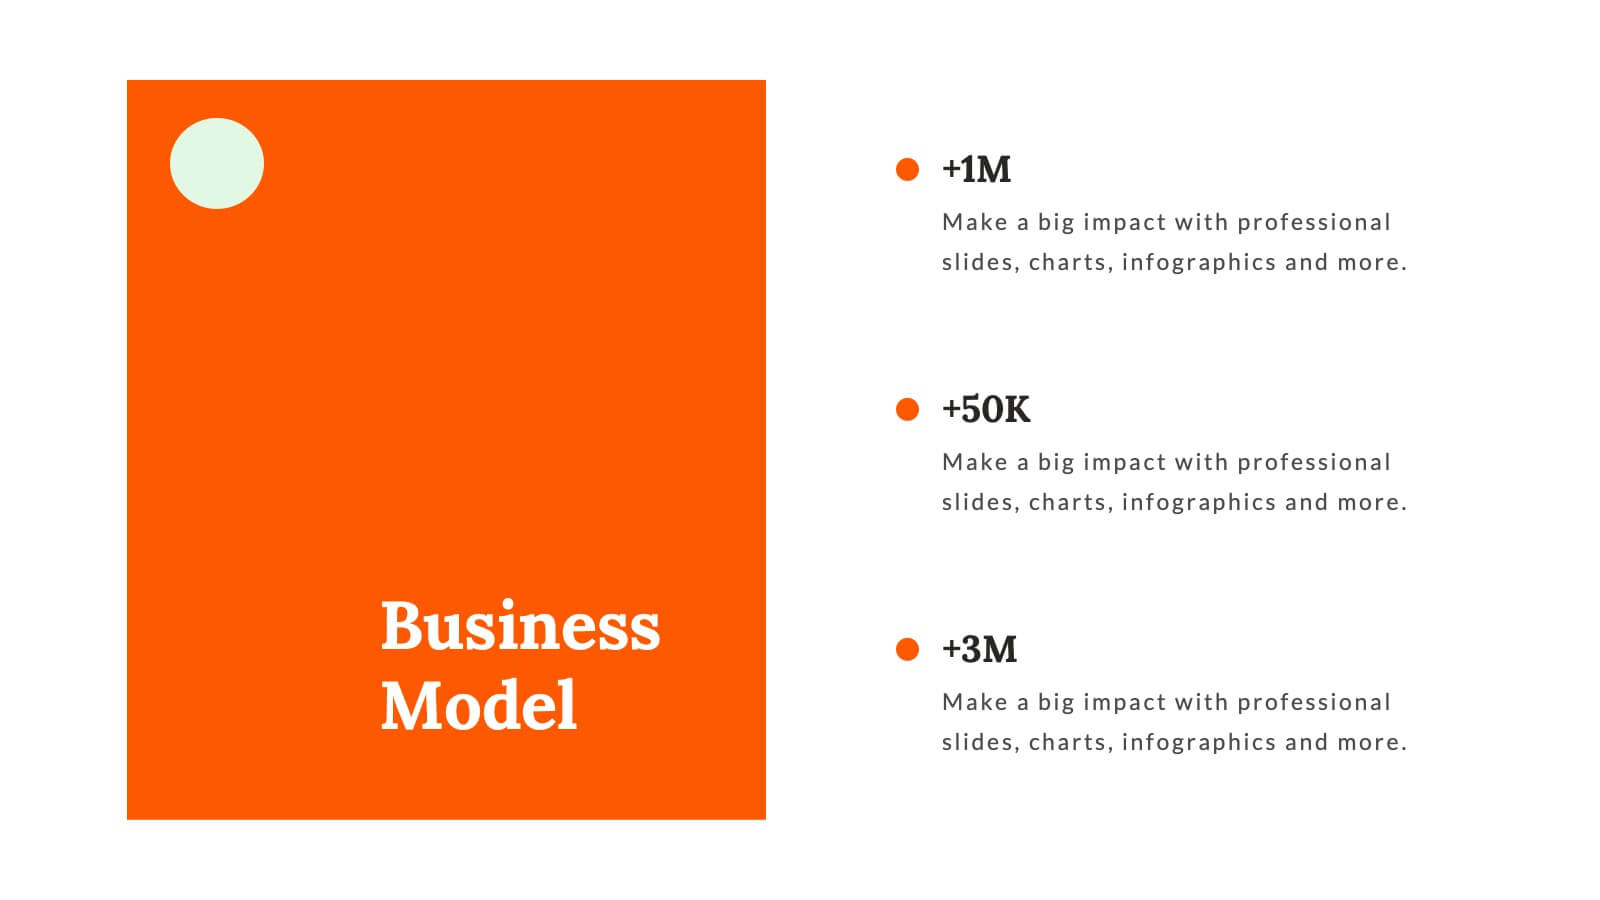
Whirlwind Startup Funding Proposal Presentation
Transform your startup funding proposals with this vibrant and professional template. Designed to impress potential investors, it features sections for mission & vision, founding story, market analysis, and financial overview. Highlight your unique value proposition and business model with clarity and style. This template is compatible with PowerPoint, Keynote, and Google Slides, ensuring seamless presentations on any platform. Perfect for conveying your innovative ideas and growth plans effectively.


5 slides
Performance Scaling Overview Presentation
Illustrate performance development with this sleek layered pyramid chart. Designed to visualize growth stages, team levels, or scaling strategies, each tier includes editable text and icons for clarity. Ideal for business reviews, capability mapping, or operational planning. Fully customizable in PowerPoint, Keynote, and Google Slides for effortless updates.


7 slides
Demographic Data Infographic
Demographic data refers to information that characterizes the composition of a population or a specific group based on various socio-economic factors. Our demographic data infographic is not just a graphic, this is a powerful visualization that explores society and empowers decision-makers to understand, connect, and prosper. Prepare for an exhilarating journey through demographics, where data transforms into meaningful insights. Compatible with Powerpoint, Keynote, and Google Slides. This can be used for a variety of purposes, including market research, targeted marketing, policy development, resource allocation, urban planning, and more.