


Features
- 4 Unique slides
- Fully editable and easy to edit in Microsoft Powerpoint, Keynote and Google Slides
- 16:9 widescreen layout
- Clean and professional designs
- Export to JPG, PDF or send by email


Do you have any questions?
Recommend


7 slides
Real Estate Infographic Presentation Template
Real estate is a form of property that can be used for residential, commercial or industrial purposes, and typically includes any resources on the land such as water or minerals. This template is especially useful for real estate agents and brokers who can use it to better understand the real estate industry. This template comes with Infographics that are a great way to explain complex ideas and trends in a simple, easy-to-understand way, and can help your clients better understand as well. This template displays data visually, which will allow your audience to grasp complex ideas quickly.


6 slides
Pillar Foundation Infographics
Gain insights into Pillar Foundation construction with our customizable infographic template. This template is fully compatible with popular presentation software like PowerPoint, Keynote, and Google Slides, allowing you to easily customize it to illustrate and communicate the key aspects and principles of pillar foundation construction. The Pillar Foundation infographic template offers a visually engaging platform to explore and explain the construction process, types of pillars, materials used, and the significance of pillars in building stability. Whether you're a construction professional, architect, engineer, or simply interested in construction techniques, this template provides a user-friendly canvas to create informative presentations and educational materials. Deepen your knowledge of Pillar Foundation construction with this SEO-optimized infographic template, thoughtfully designed for clarity and ease of use. Customize it to showcase foundation types, construction steps, reinforcement methods, and the role of pillars in supporting structures, ensuring that your audience gains valuable insights into this crucial aspect of construction. Start crafting your personalized infographic today to delve into the world of Pillar Foundation construction.


4 slides
Corporate Hierarchy Levels Diagram Presentation
Visualize organizational structures clearly with this Corporate Hierarchy Levels Diagram Presentation. Designed for showcasing leadership flow, team divisions, or reporting relationships, each slide features a simple tiered layout with editable icons and placeholders. Great for business planning, team introductions, or org chart overviews. Fully customizable in PowerPoint, Keynote, Canva, and Google Slides.


5 slides
Green Business Sustainability Strategy
Showcase your eco-conscious roadmap with this Green Business Sustainability Strategy presentation. Featuring a 5-step, curved timeline design with nature-inspired icons, it’s perfect for environmental initiatives, CSR planning, or ESG strategy. Easily adaptable in PowerPoint, Keynote, or Google Slides for a polished, professional message.


6 slides
Business Task Checklist Presentation
Bring order and focus to your workflow with a clean, structured layout that tracks progress and priorities at a glance. Ideal for project updates, task planning, or performance reviews, this presentation makes organization effortless. Fully compatible with PowerPoint, Keynote, and Google Slides for easy customization and professional use.
5 slides
Performance Tracking via Dashboard Widgets Presentation
Visualize performance at a glance with the Performance Tracking via Dashboard Widgets Presentation. This slide layout blends progress tiles, bar charts, and dynamic line graphs to display key metrics over time. Ideal for showcasing reseller performance, goal progress, or trend comparisons in one compact dashboard view. Fully editable in PowerPoint, Google Slides, Keynote, and Canva


10 slides
Adapting to Business Transformation Presentation
Guide your audience through change with this dynamic, step-by-step layout tailored for showcasing transformation journeys. The slide features a curved flow design with five customizable stages, perfect for visualizing digital shifts, organizational restructuring, or innovation roadmaps. Best for corporate strategists, consultants, and change managers. Fully editable in PowerPoint, Keynote, and Google Slides.


7 slides
Venn Diagram Structure Infographic
Illuminate intersections and highlight distinctions with our Venn diagram infographic. Cast on a pristine white canvas, the design radiates with harmonious hues of pastel purple, calming blue, passionate red, and rejuvenating green, emphasizing the areas of overlap and distinct zones in a structured manner. Bolstered with infographics, representative icons, and adjustable image placeholders, this template is an epitome of clarity in showcasing relational logic among sets. Configured for Powerpoint, Keynote, or Google Slides. An ally for data analysts, statisticians, educators, or anyone seeking to depict intertwined relationships in a clear, visual format.


12 slides
Tourism Trends and Destination Analytics Presentation
Visualize travel patterns and insights effortlessly with this Tourism Trends and Destination Analytics Presentation. Featuring a suitcase-themed layout with icon blocks, this template is ideal for travel analysts, tourism boards, and destination marketers. Use it to highlight travel behaviors, key locations, or seasonal preferences. Fully customizable in PowerPoint, Keynote, and Google Slides.


21 slides
Blaze Blitz Graphic Design Project Plan Presentation
Introducing the Blaze Black Design Project Plan template—where sophistication meets functionality! This visually striking template is designed to captivate your audience with its bold black and white theme, exuding professionalism and creativity. Perfect for designers and creative agencies, this template is meticulously structured to guide your project from concept to completion. Each slide is designed to highlight key aspects like the Design Brief, Concept Development, Target Audience, and Design Process, ensuring your message is conveyed with clarity and impact. The sleek typography, combined with high-contrast visual elements, enhances readability while adding a modern edge to your presentation. Whether you're pitching a new design project, showcasing your design process, or planning your next creative endeavor, this template is your go-to tool for delivering presentations that leave a lasting impression. Compatible with PowerPoint, Keynote, and Google Slides, it's fully customizable to fit your brand and style. Get ready to wow your audience with this powerful design template!


20 slides
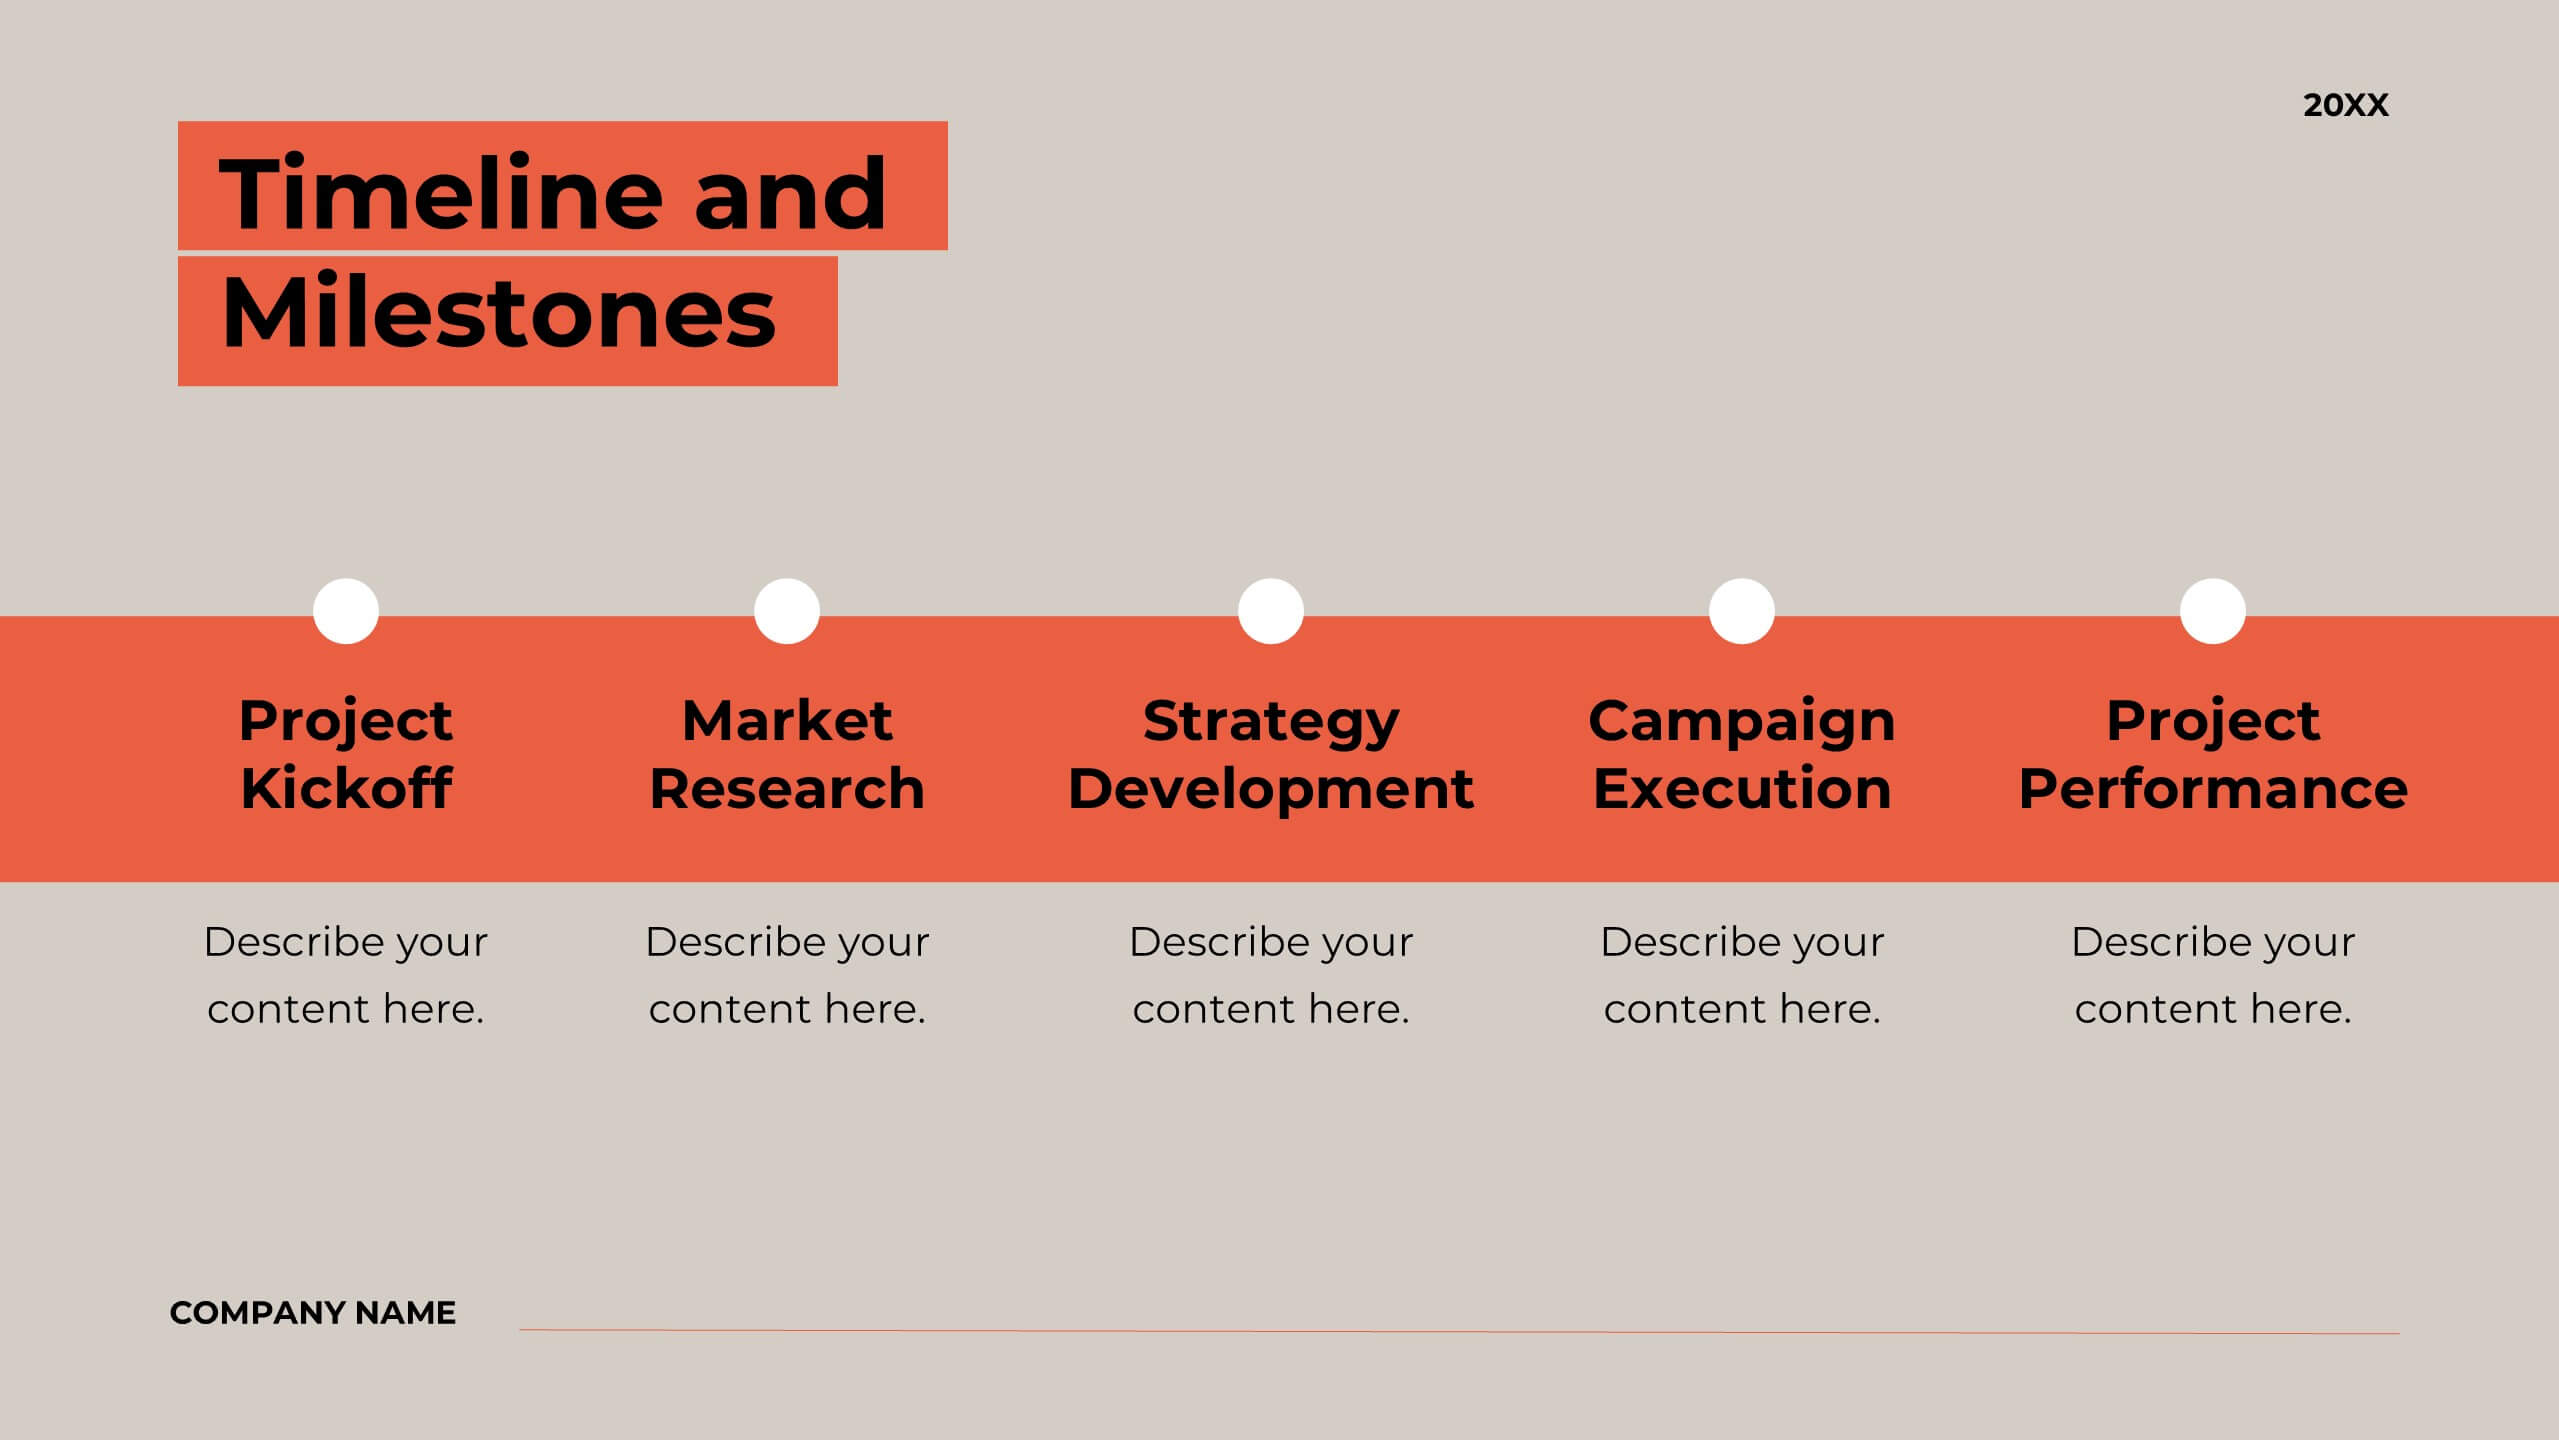
Bentom Marketing Proposal Presentation
This marketing proposal template is crafted to communicate your strategy with impact. With sections covering company overview, project summary, objectives, methodology, budget breakdown, and deliverables, it provides a professional layout for presenting key details to clients. Tailor it to fit your needs, and present confidently using PowerPoint, Keynote, or Google Slides.


5 slides
Business Vision Statement Presentation
Focus on the future with our "Business Vision Statement" presentation template, ideal for outlining your company's aspirations. This visually engaging template helps you present your business's core values and long-term goals, ensuring alignment across the organization. Perfect for strategic meetings and stakeholder presentations, it is compatible with PowerPoint, Keynote, and Google Slides. This template is a crucial tool for leaders looking to inspire and direct their teams towards common objectives.


6 slides
Identifying Market Challenges Presentation
Stay ahead of the competition by breaking down market challenges with this dynamic presentation template! Designed for business strategists, marketers, and analysts, this layout helps you visually structure key obstacles and opportunities. Perfect for market research and competitive analysis. Fully customizable and compatible with PowerPoint, Keynote, and Google Slides.


6 slides
Business Performance Pie Chart
Visualize your key metrics clearly with this pie chart-style performance layout. Designed for business reviews and strategic updates, it breaks down five data categories into easy-to-read segments. Ideal for quarterly performance slides, team dashboards, and KPI tracking. Fully editable in PowerPoint, Keynote, and Google Slides.


7 slides
Circle Planning Infographic
Embark on holistic planning with our circle planning infographic. Encased within a pure white canvas and punctuated with harmonious green, insightful purple, and strategic blue, our template encapsulates the cyclical nature of meticulous planning. Endowed with concise infographics, indicative icons, and adaptable image placeholders, it elucidates the continuity and stages of planning processes. Flawlessly designed for Powerpoint, Keynote, or Google Slides. An irreplaceable tool for project managers, business strategists, educators, or any professional aiming for a rounded approach to planning.


5 slides
Data Entry Infographics
Dive into the intricate world of information management with our data entry infographics. Cast in shades of blue, warm orange, and an array of inviting colors, this vertically styled template is a boon for business analysts, administrative assistants, and database managers. The design, punctuated with relevant graphics, icons, and strategic image placeholders, simplifies complex data narratives. It serves as a visual anchor, ensuring information accuracy and efficiency. This essential tool is instrumental for professionals striving to maintain data integrity while elucidating critical entry processes, thereby fostering a streamlined workflow.


6 slides
SCAR Process Model Presentation
The "SCAR Process Model" presentation template provides a clear visualization of the SCAR (Supplier, Corrective, Action, Request) model, designed to help professionals manage and enhance supplier relationships effectively. Each quadrant of the template is dedicated to one of the SCAR components, neatly arranged around a central hub, symbolizing the interconnected nature of these processes. The circular layout facilitates the understanding of how each component influences the others, leading to a more streamlined approach in handling supplier interactions and corrective actions. This template is perfect for presentations in supply chain management, operational reviews, and strategic planning meetings, offering a practical framework for discussing and planning effective supply chain strategies.