


Features
- 3 Unique slides
- Fully editable and easy to edit in Microsoft Powerpoint, Keynote and Google Slides
- 16:9 widescreen layout
- Clean and professional designs
- Export to JPG, PDF or send by email


Do you have any questions?
Recommend


6 slides
Digital Marketing Campaign Strategy Presentation
Present your marketing flow with clarity using the Digital Marketing Campaign Strategy Presentation. This dynamic arrow-style layout is ideal for outlining five key phases of a digital campaign—from planning and promotion to tracking results. Fully customizable in Canva, PowerPoint, Keynote, and Google Slides to fit your campaign strategy.


7 slides
Digital Marketing Infographics Presentation Template
Digital marketing is essential for your business and brand awareness. From website design to social media advertising, learn about all the ways digital marketing can help grow your company with this template. Digital marketing can be a powerful and effective way to promote your business.


5 slides
Project Task Ownership Matrix Presentation
Bring your workflow to life with a clean, engaging slide that maps out who owns what. This presentation helps clarify roles, streamline communication, and keep every task fully aligned. Perfect for teams that need structure without complexity. Fully compatible with PowerPoint, Keynote, and Google Slides.


8 slides
Four-Step Business Strategy Presentation
Break down your plan into clear, actionable steps with the Four-Step Business Strategy Presentation. This structured template highlights key phases, ensuring an easy-to-follow visual representation of your strategy. Perfect for business planning, marketing, and project management. Fully customizable and compatible with PowerPoint, Keynote, and Google Slides.


6 slides
Platform-Specific Social Strategy Presentation
Break down your marketing approach by channel using this clear, platform-focused timeline. Highlight strategies for TikTok, Facebook, Instagram, X, and email in a linear, easy-to-read format. Ideal for digital marketers, content teams, and social media managers. Fully editable in PowerPoint, Keynote, and Google Slides to match your brand and strategy.


5 slides
Insurance Specialities Infographics
Insurance Specialties refer to specific areas of the insurance industry that require specialized knowledge, expertise, and training. These Infographic templates are visually appealing and informative presentation tools that can be used by insurance companies, brokers, or agents to showcase their unique services and specialties. This template includes a range of customizable graphics, charts, and icons that can be edited to match your brand. With this template, you can clearly and effectively communicate the various types of insurance you offer, such as life, health, property, or liability insurance.


4 slides
Target Audience and Buyer Persona Analysis Presentation
Visually map out your core audience segments with this modern target diagram layout. This presentation features a concentric ring graphic to represent buyer personas and user data, alongside three editable text sections with icons for clear and structured insights. Ideal for marketing strategies, customer profiling, and campaign planning. Easily customizable in PowerPoint, Keynote, and Google Slides.


21 slides
Echochime Project Timeline Presentation
Outline your project’s milestones and deliverables with this comprehensive timeline-focused presentation template. Ideal for project managers and teams, this layout streamlines the process of showcasing objectives, schedules, and key milestones with clarity and precision. The template includes dedicated slides for problem statements, resource allocation, budget planning, stakeholder communication, risk management, and quality assurance. Its visually engaging timeline design ensures a clear and professional overview of your project's progress. Designed for seamless customization, this template is fully compatible with PowerPoint, Google Slides, and Keynote, allowing you to tailor colors, fonts, and layouts to align with your project branding. Present your strategy and progress with confidence, ensuring stakeholders and team members stay informed and aligned.


5 slides
RACI Role Assignment Matrix Overview Presentation
Clarify team responsibilities with the RACI Role Assignment Matrix Overview Presentation. This professional template helps define who is Responsible, Accountable, Consulted, and Informed across key project tasks. Perfect for streamlining communication, reducing overlap, and improving accountability. Fully editable in PowerPoint, Canva, and Google Slides.


7 slides
Customer Profile Infographics Presentation Template
A customer profile is a detailed description of your current customers. By researching their demographics, psychographic data, and behaviors you can build on this knowledge to target similar customers in your sales and marketing campaigns. Use this template to create a customer profile, this will help you better understand your ideal customer. This template will tell you everything about the people you want to bring onto your customer list. This template is designed to walk you through writing your ideal customer profile, so that you can start attracting the right customers for your business.


4 slides
Insurance Market Trends
Track and present evolving market dynamics with this Insurance Market Trends presentation. Featuring clean, multi-point visual elements, this slide set is perfect for analysts, consultants, and insurance professionals aiming to highlight growth segments, percentages, or trend categories. Fully editable in PowerPoint, Keynote, and Google Slides.


5 slides
Social Media Strategy Infographic
Social Media refers to digital platforms and websites that allow users to create and share content, engage with others, and participate in online communities. This presentation template is a powerful tool to help you create a comprehensive social media strategy. It provides a visually appealing and easy-to-understand overview of the key elements of a successful social media strategy. Use this template to plan and communicate your social media strategy effectively, ensuring that you make the most of your social media presence and engage your target audience efficiently. This template is compatible with Powerpoint, Keynote, and Google Slides.


23 slides
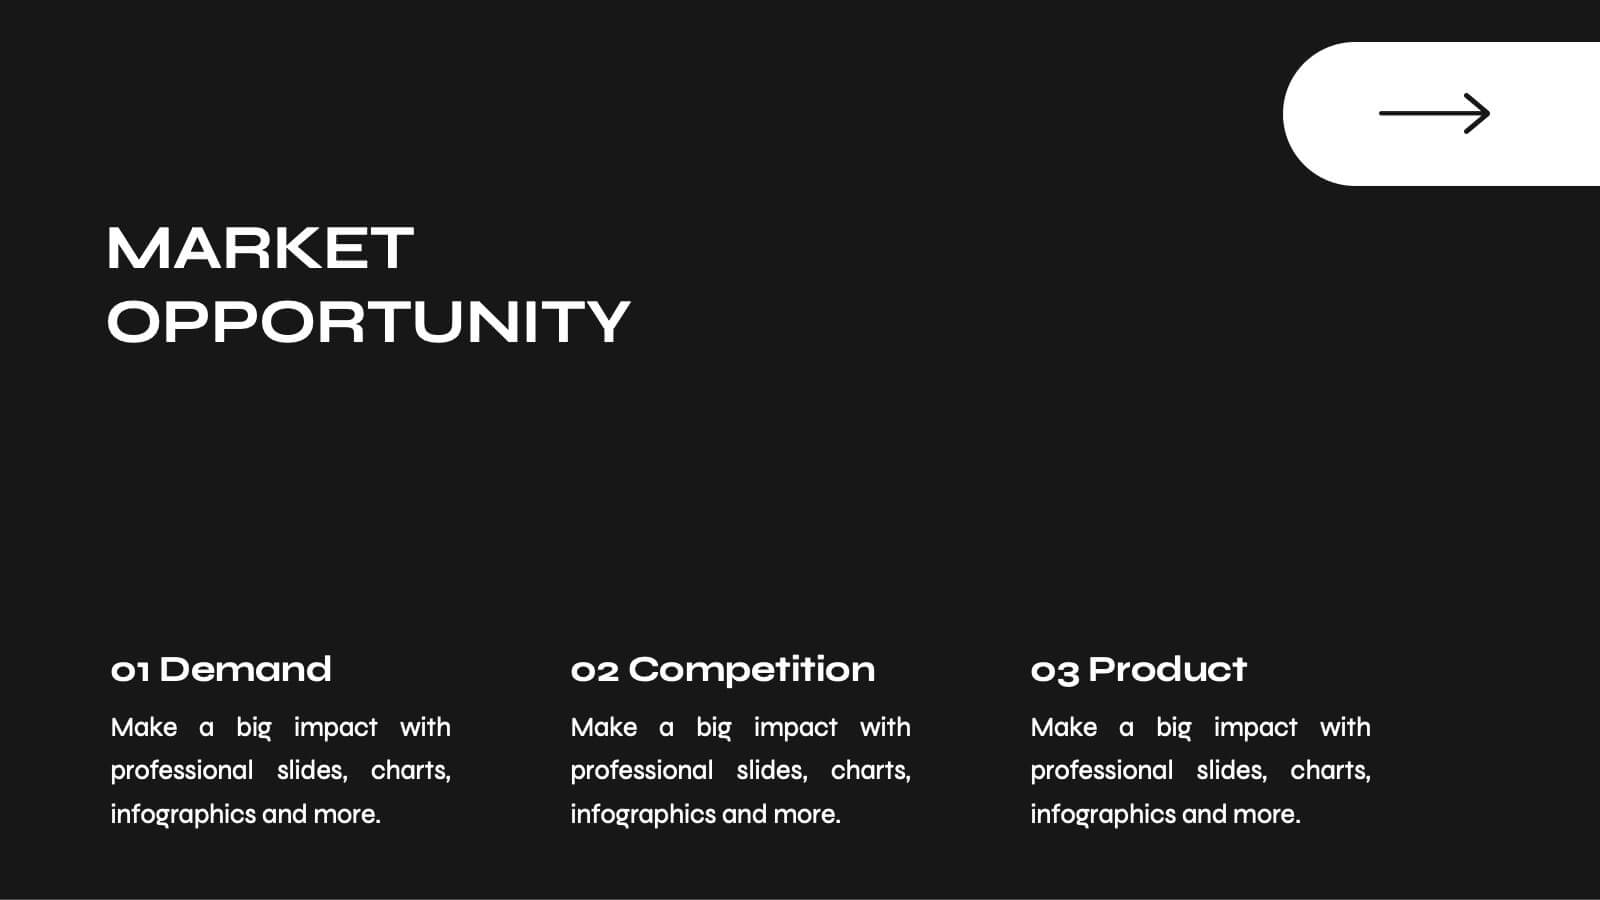
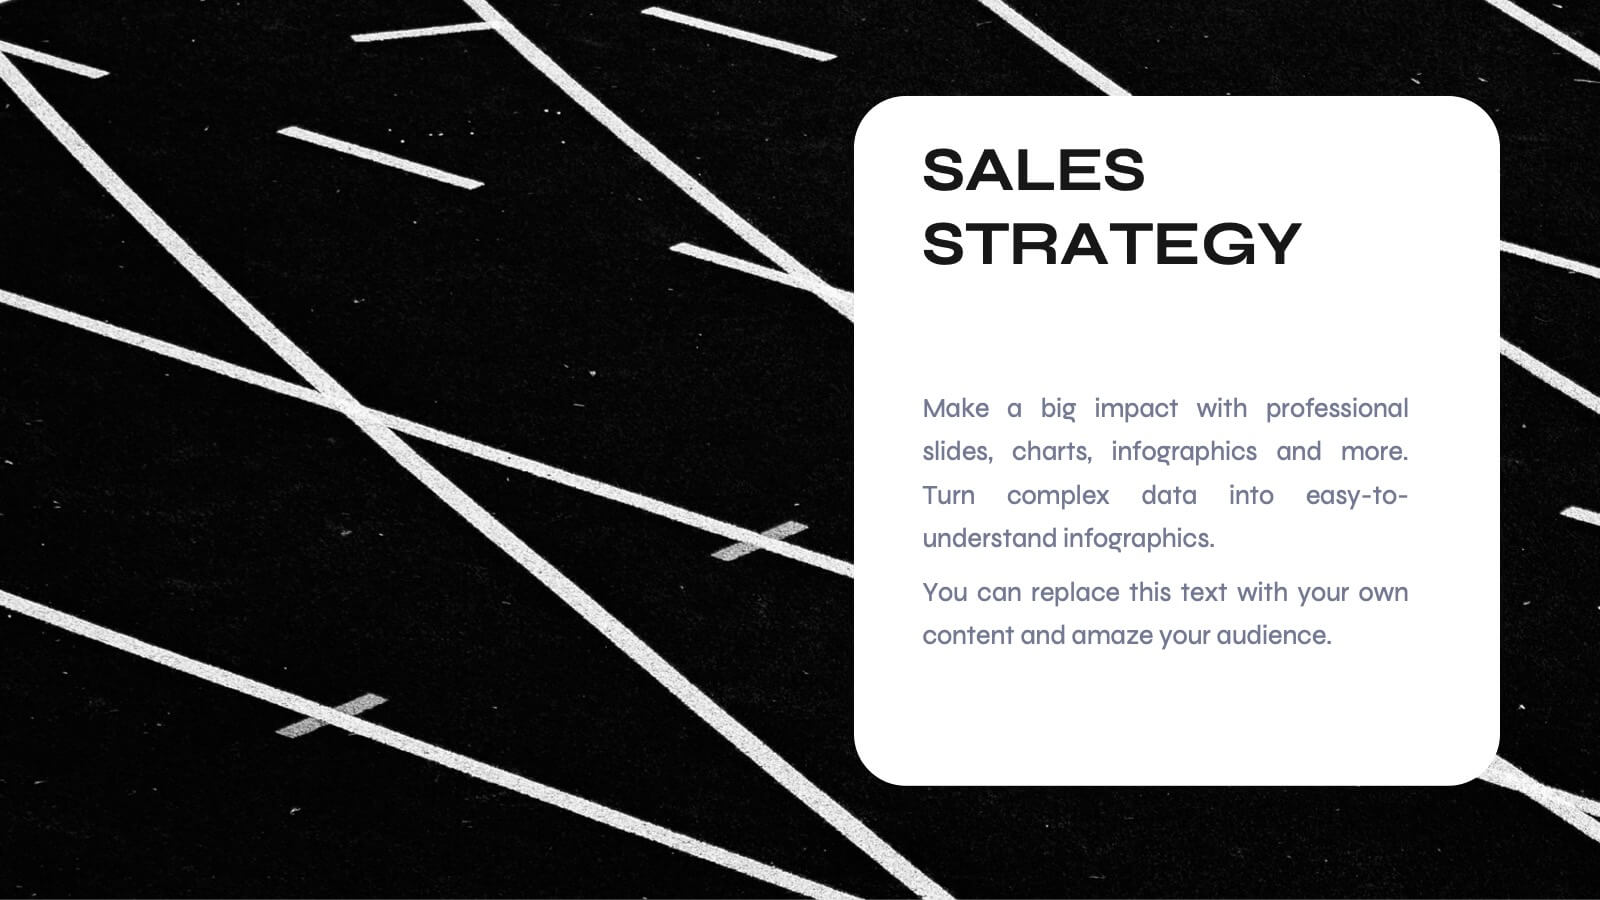
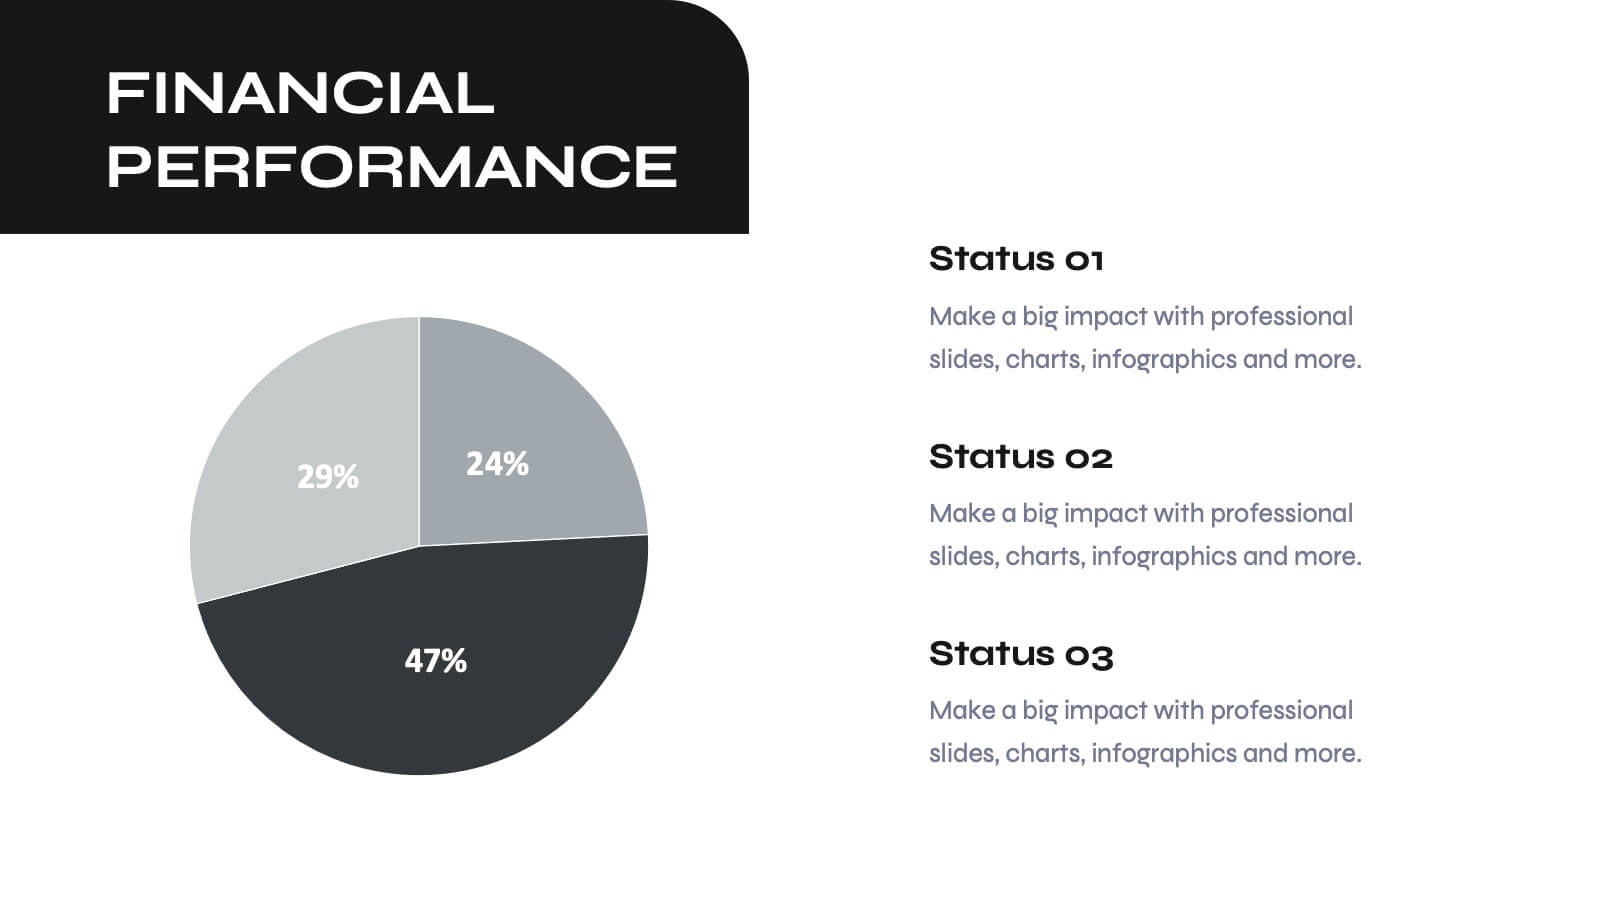
Odyssey Small Business Pitch Deck Presentation
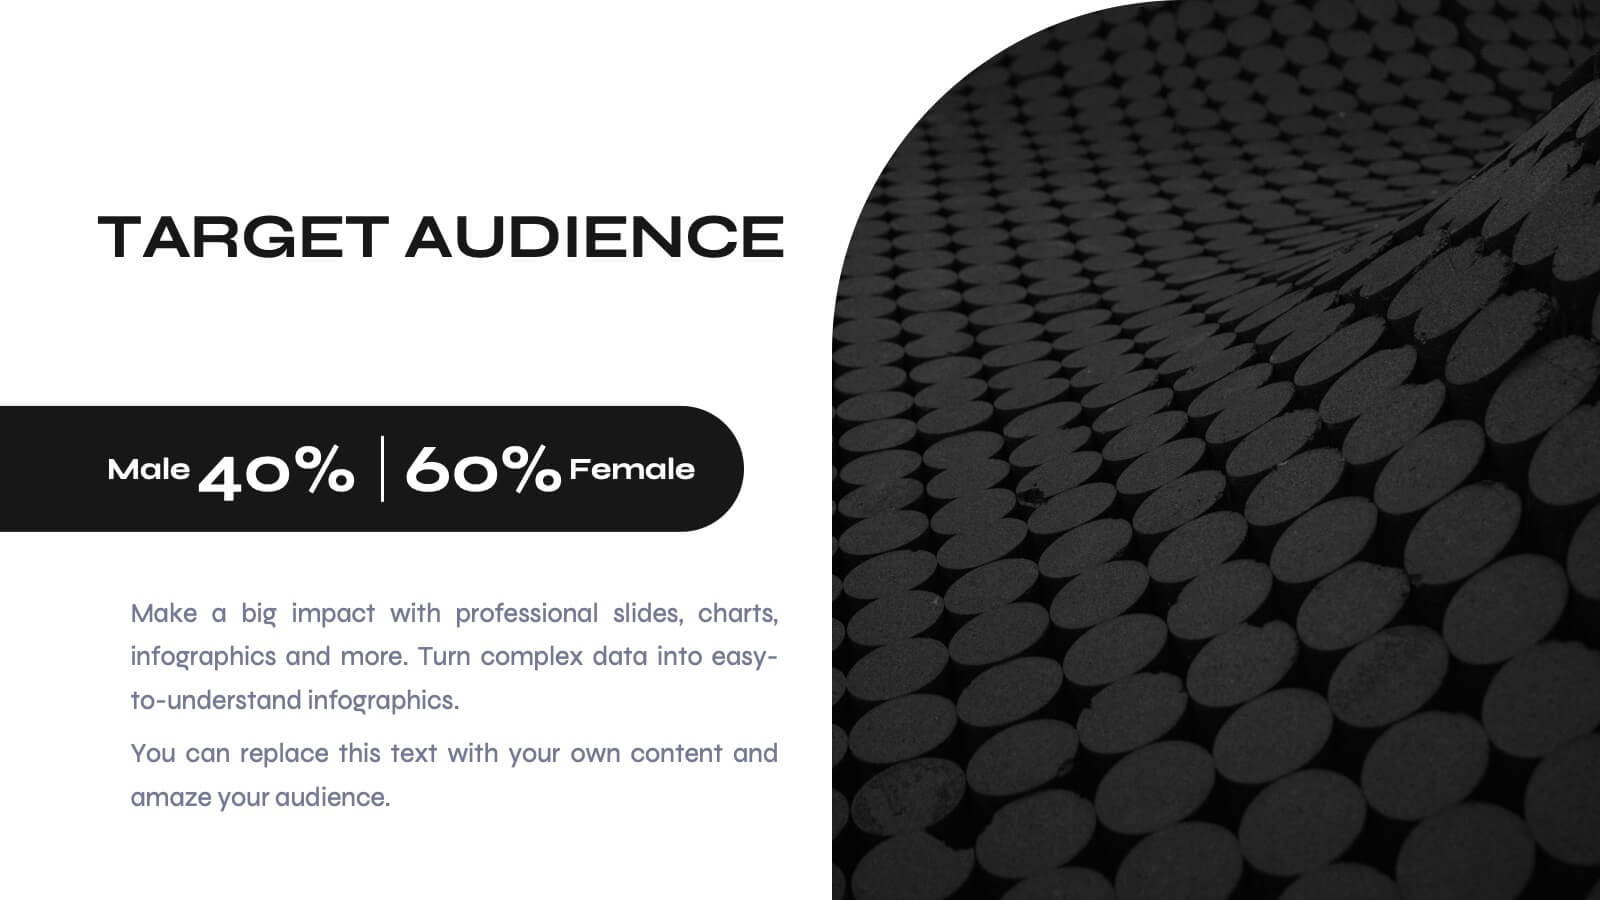
Elevate your business pitch with this sleek, monochrome presentation template. Perfect for presenting company backgrounds, market opportunities, and financial performance, it features a minimalist design that enhances clarity and impact. Highlight your value proposition and strategic plans to captivate investors. Compatible with PowerPoint, Keynote, and Google Slides, it ensures seamless presentations on any platform.


3 slides
Triangle Diagram for Strategic Layers Presentation
Visualize interconnected processes or layered strategies with the Triangle Diagram for Strategic Layers Presentation. This slide features three dynamic triangle shapes arranged in a circular flow, perfect for representing cycles, frameworks, or pillars of a system. Each point includes space for a title, icon, and supporting text. Great for illustrating collaboration, dependencies, or strategic pillars. Compatible with PowerPoint, Keynote, and Google Slides.


27 slides
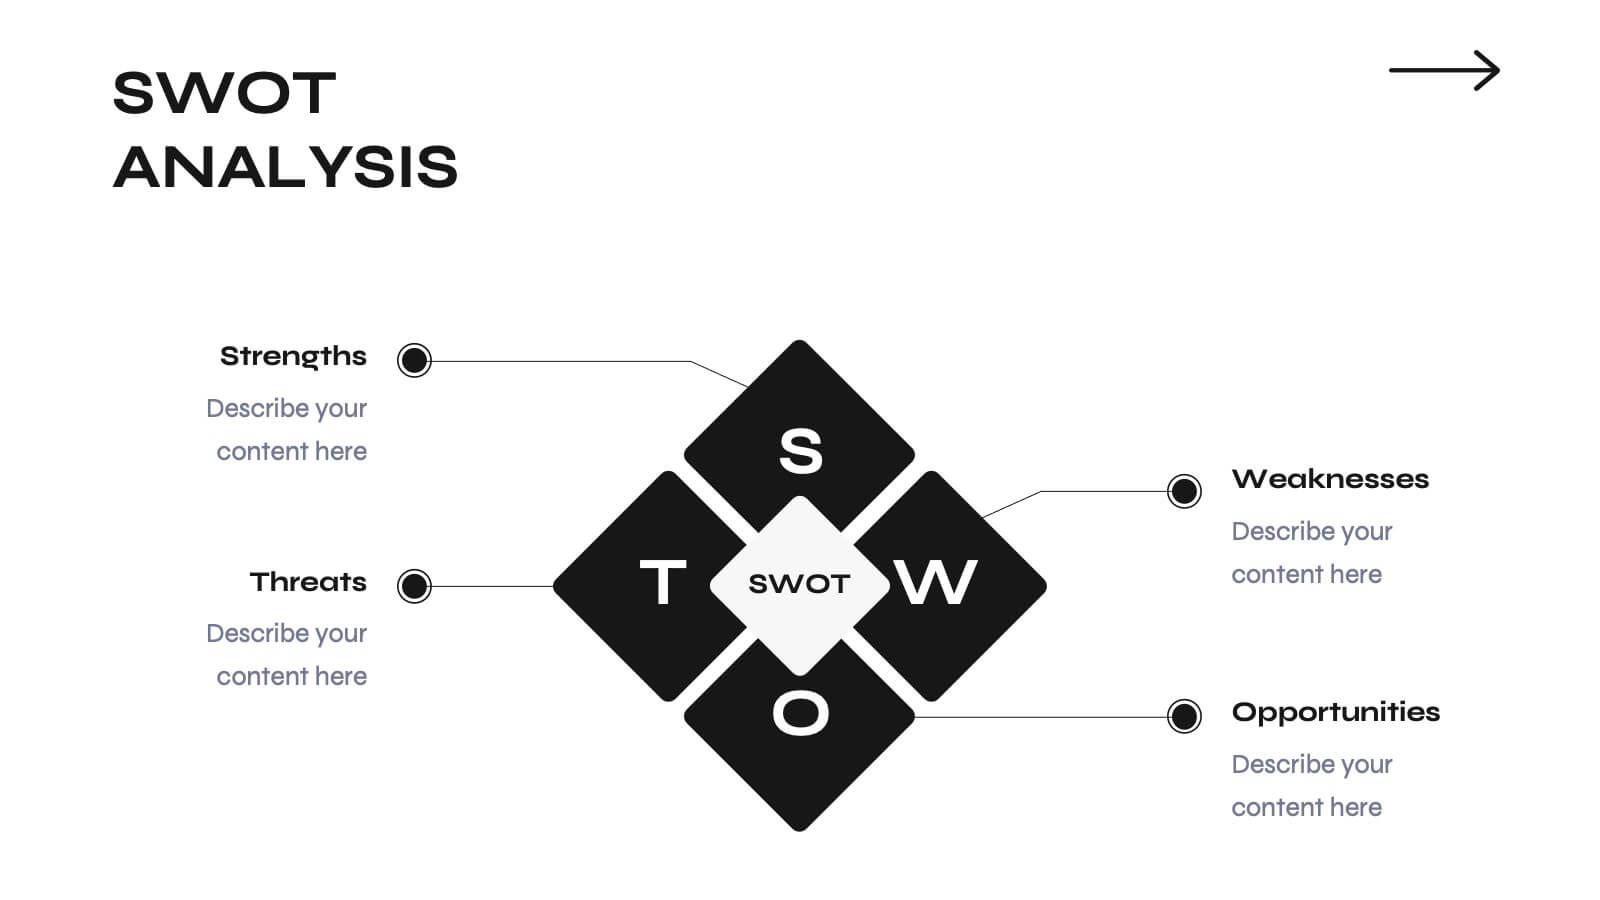
Creative Business Overview Presentation
Enhance your corporate presentations with our comprehensive Business template. This resource includes detailed slides on SWOT analysis, market opportunities, strategic goals, and product details. Perfect for delivering a complete business overview, it's compatible with PowerPoint, Keynote, and Google Slides for seamless use in various professional settings.


20 slides
Solar Beam Sales Proposal Presentation
Supercharge your sales presentation with the Solar Beam Sales Proposal template! This vibrant and dynamic template is designed to capture attention and drive home your key points with flair. Start with a bold introduction, then seamlessly guide your audience through your company overview, product/service details, and target market analysis. Highlight your sales objectives, showcase your team, and provide compelling customer testimonials. With dedicated slides for pricing strategies, sales collateral, and performance metrics, you’ll have all the tools you need to make a persuasive pitch. The template also includes sections for discussing future opportunities, action plans, and a Q&A session to address any final questions. Its modern, professional design ensures that your proposal stands out in any setting. Fully customizable and compatible with PowerPoint, Keynote, and Google Slides, this template is your go-to for creating impactful sales presentations that leave a lasting impression.


26 slides
Ioel Presentation Template
Here's the perfect kickstart to your business with a presentation template that you’ve been dreaming of! Ioel's crisp, bold font and a clean aesthetic that is engaging to any audience. This template will give your business a bolder and more professional image that you need. Ioel's bold blue background is eye-catching, making this template perfect for businesses seeking to make a great impression. This template will make it easy for you to create an attractive and professional-looking deck. Any business owner wishing to make an impression on their audience will want to use this presentation.