


Features
- 21 Unique Slides
- Fully editable and easy to edit in Microsoft Powerpoint, Keynote and Google Slides
- 16:9 widescreen layout
- Clean and professional designs
- Export to JPG, PDF or send by email


Do you have any questions?
Recommend


5 slides
5 Module Online Training Content Presentation
Kick off your training session with a clean, engaging visual that maps out each module in a clear, easy-to-follow flow. This presentation helps you organize lessons, outline learning goals, and guide learners through a structured digital program. Fully compatible with PowerPoint, Keynote, and Google Slides.


5 slides
Dual Axis Butterfly Diagram Presentation
Give your data the spotlight it deserves with a modern layout designed for clarity and balance. This presentation is perfect for comparing two perspectives, processes, or variables side by side in a visually appealing way. Fully customizable and compatible with PowerPoint, Keynote, and Google Slides.


5 slides
Layered Circular Model for Strategy Presentation
Communicate complex strategies with ease using the Layered Circular Model for Strategy Presentation. This 3D-style infographic breaks down your framework into five distinct levels, making it ideal for visualizing hierarchies, stages, or priorities. Each layer is fully editable and labeled for customization. Works with PowerPoint, Google Slides, and Canva.


5 slides
Visual Decision-Making with Harvey Balls Presentation
Simplify complex evaluations with this Harvey Ball comparison chart. Ideal for product comparisons, feature assessments, or decision-making matrices, this slide presents up to 6 items and 4 features with intuitive visual cues. Fully editable in PowerPoint, Keynote, or Google Slides, it’s perfect for business, marketing, and strategy teams seeking clear and compelling insights.


5 slides
Perspective of Economic Trends in Africa Map Presentation
Visualize key economic insights across Africa with this data-driven map layout. Use labeled progress bars and highlighted countries to present regional performance, sector growth, or market distribution. Fully editable in PowerPoint, Keynote, or Google Slides, this clean template is ideal for business reports, financial reviews, and investment-focused presentations.


8 slides
Annual Business Performance Report Presentation
Visualize your company’s progress with the Annual Business Performance Report Presentation. This sleek, data-driven template combines donut charts and bar graphs to showcase KPIs, milestones, and key achievements. Perfect for year-end summaries and stakeholder updates. Fully editable in Canva, PowerPoint, and Google Slides for easy customization and professional results.


8 slides
Product Pricing Table Comparison Presentation
Showcase your product pricing options clearly with our 'Product Pricing Table Comparison' presentation template. This straightforward and efficient layout helps you display different price points and features across multiple packages, making it easy for your audience to compare and make informed choices. Ideal for sales presentations and marketing meetings, this template is compatible with PowerPoint, Keynote, and Google Slides.


8 slides
Employee Training and Development Presentation
Optimize your team's growth with the 'Employee Training and Development' presentation template. This layout strategically organizes training modules, showcasing clear pathways for skills enhancement and career progression. Compatible with PowerPoint, Keynote, and Google Slides, it's ideal for delivering engaging and instructional corporate training sessions.


26 slides
Tempo Brand Identity Presentation
Introduce and elevate your brand with this versatile presentation template designed to reflect your company's vision and values. Perfect for businesses looking to showcase their brand strategy, components, and touchpoints with clarity and professionalism. This presentation features thoughtfully designed slides covering brand identity components, visual guidelines, target audience insights, and future development plans. Use dedicated sections to outline your unique selling proposition, positioning, and strategy. With its clean layout and attention to detail, it's ideal for presenting a cohesive and impactful brand narrative. Compatible with PowerPoint, Google Slides, and Keynote, this template is fully customizable. Edit colors, text, and images to align with your brand aesthetics and messaging. Deliver your presentation with confidence, ensuring your audience is inspired by a polished and professional brand identity.


5 slides
Professional Company Overview Slide Presentation
Showcase your business story with confidence using this sleek and structured layout designed for clarity and professionalism. Ideal for introducing teams, services, and company milestones, it helps you communicate key insights effectively. Fully customizable and compatible with PowerPoint, Keynote, and Google Slides for effortless presentation creation and editing.


20 slides
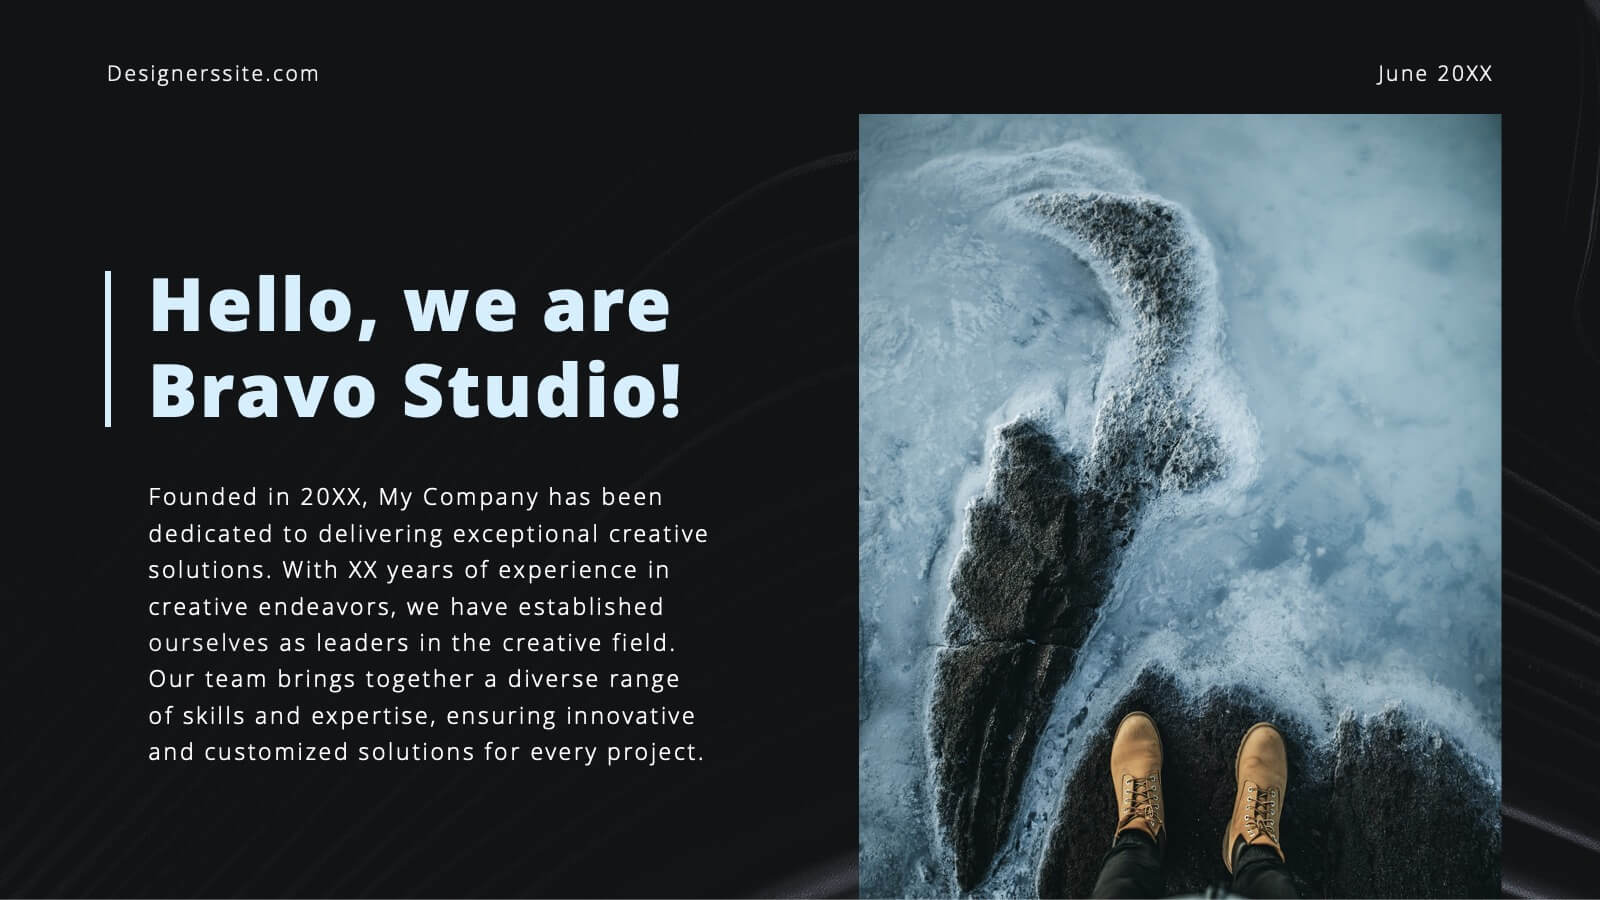
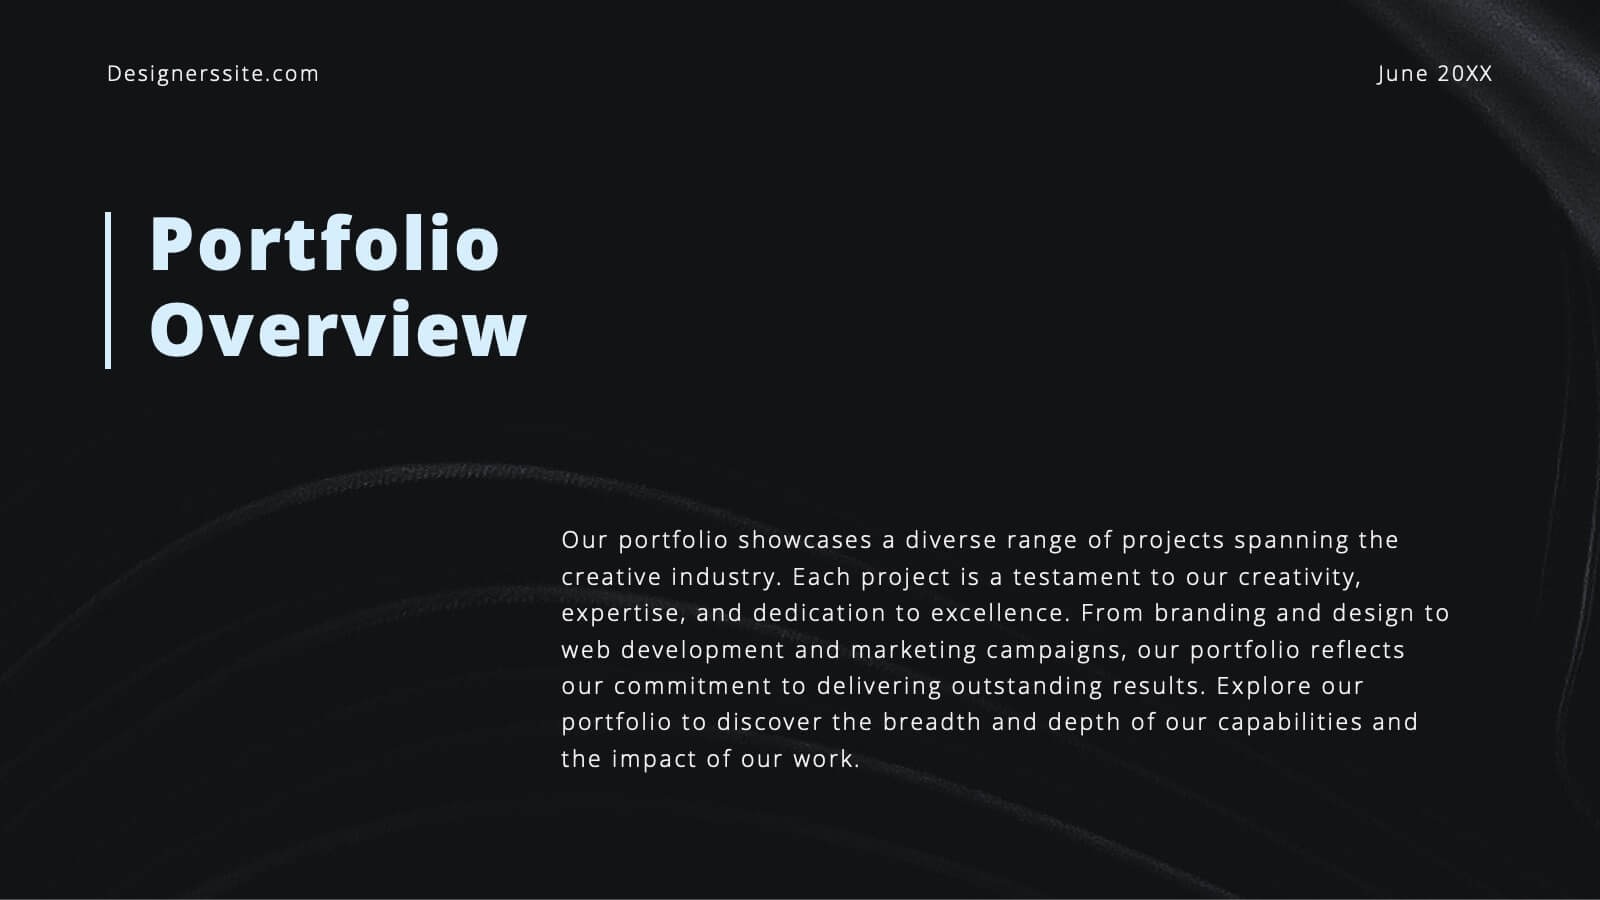
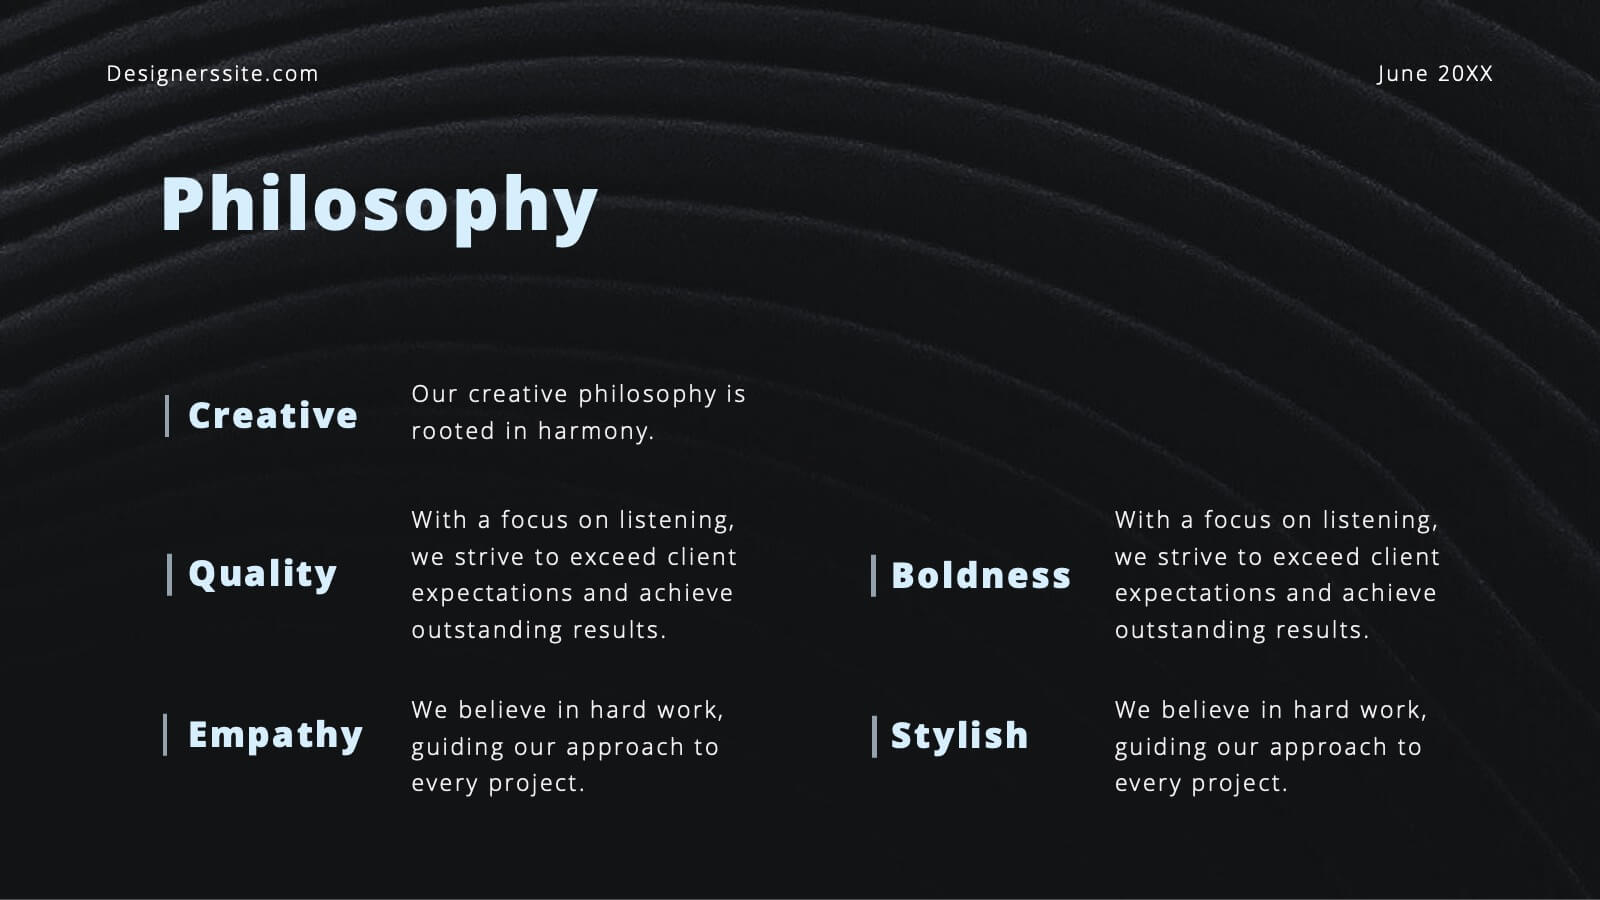
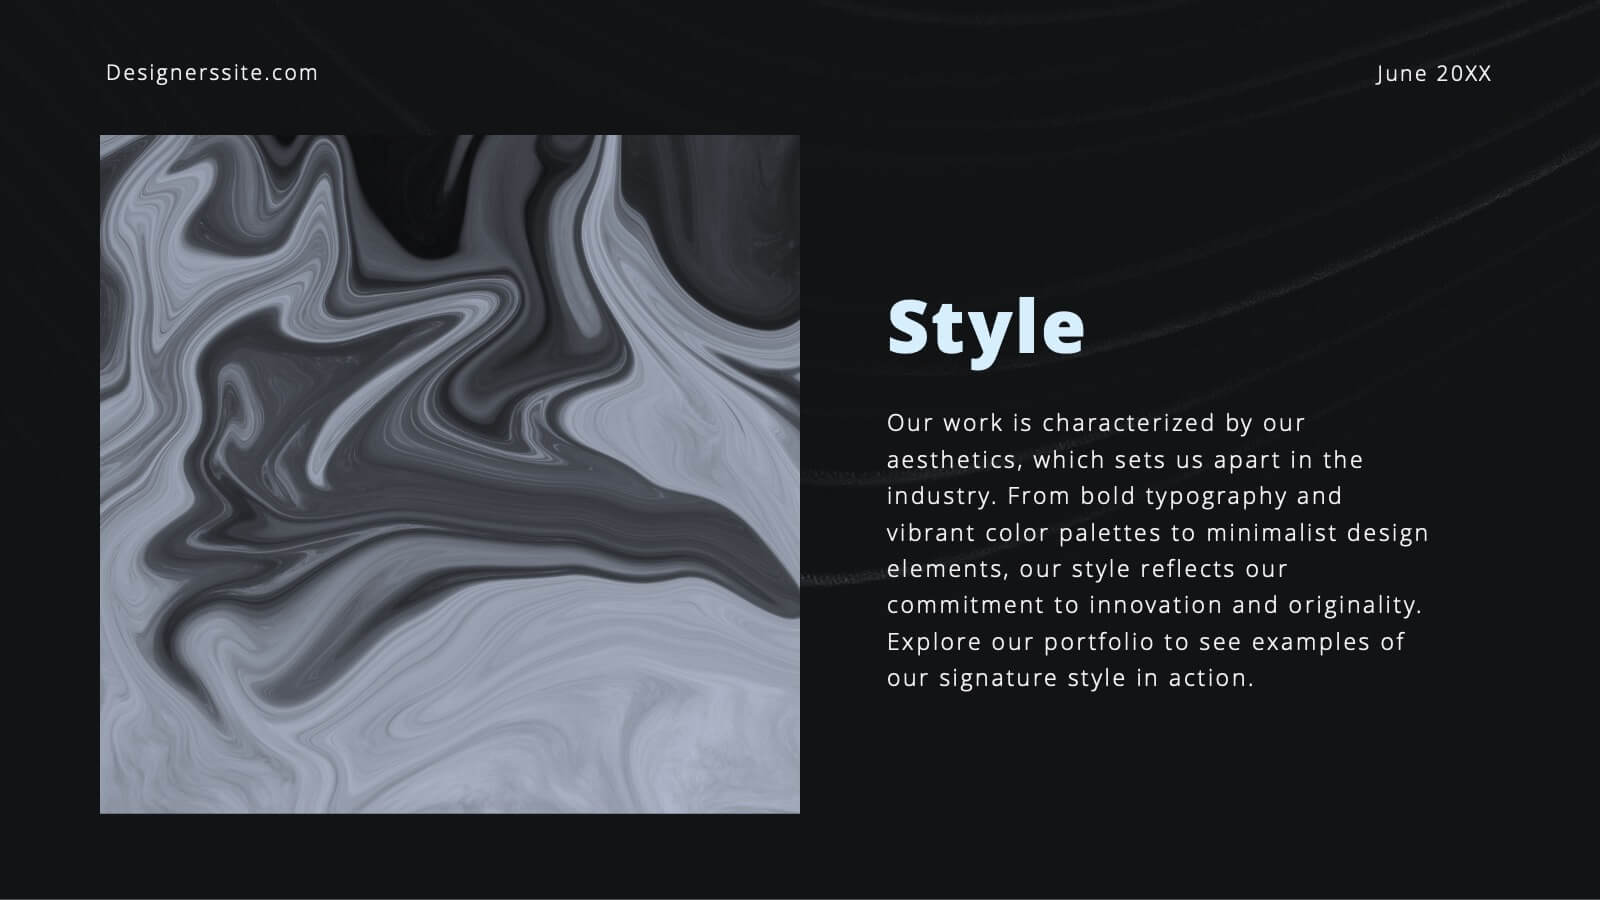
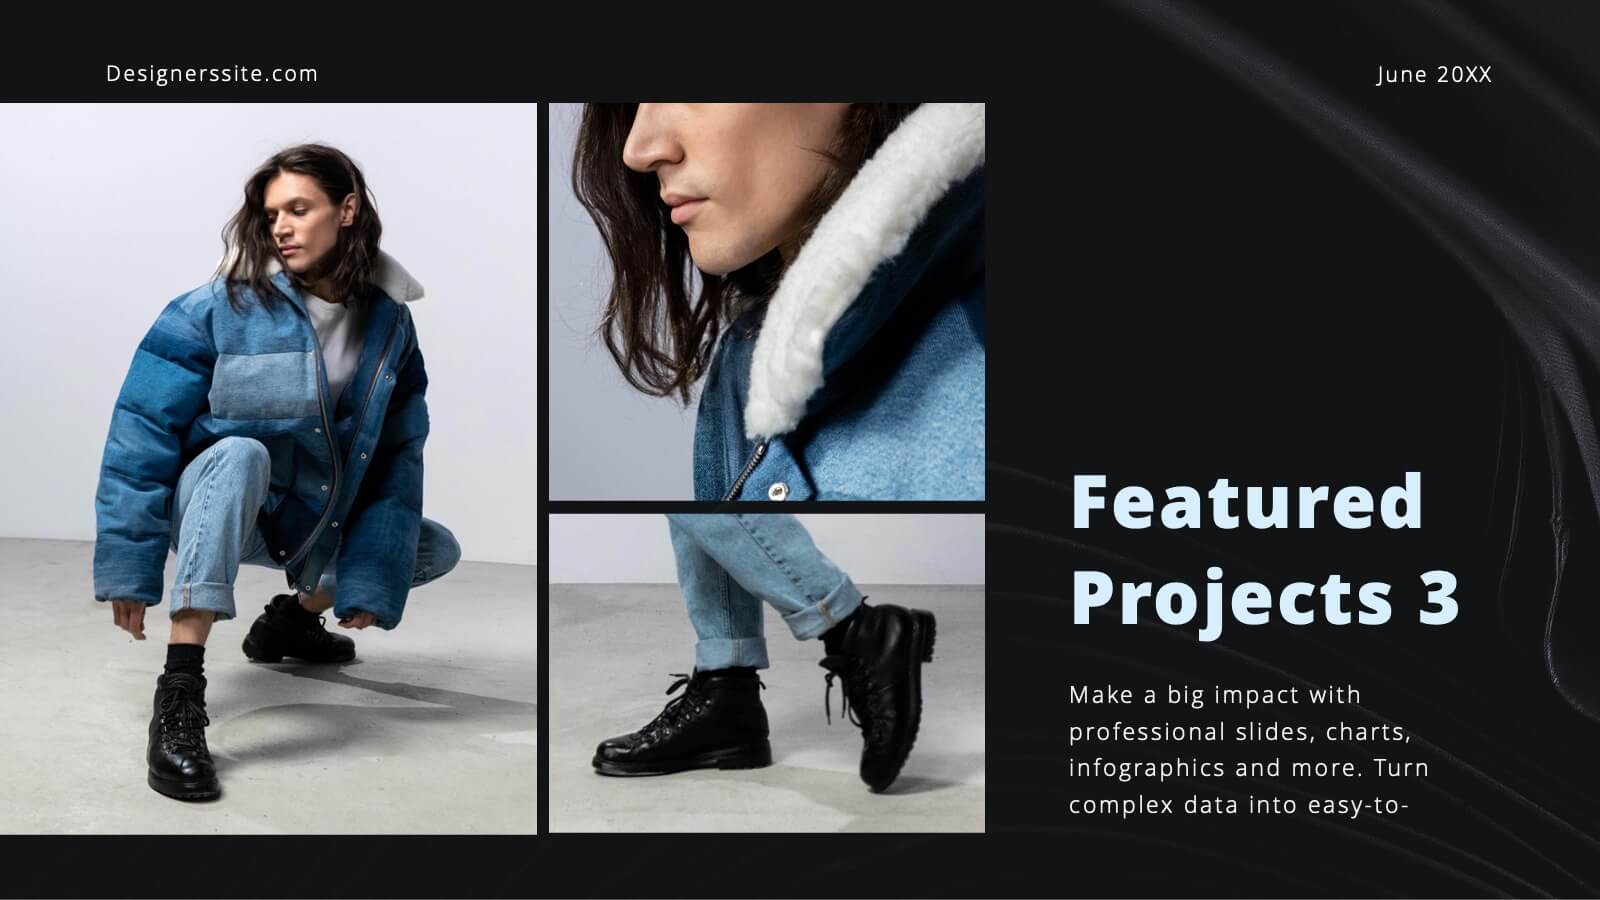
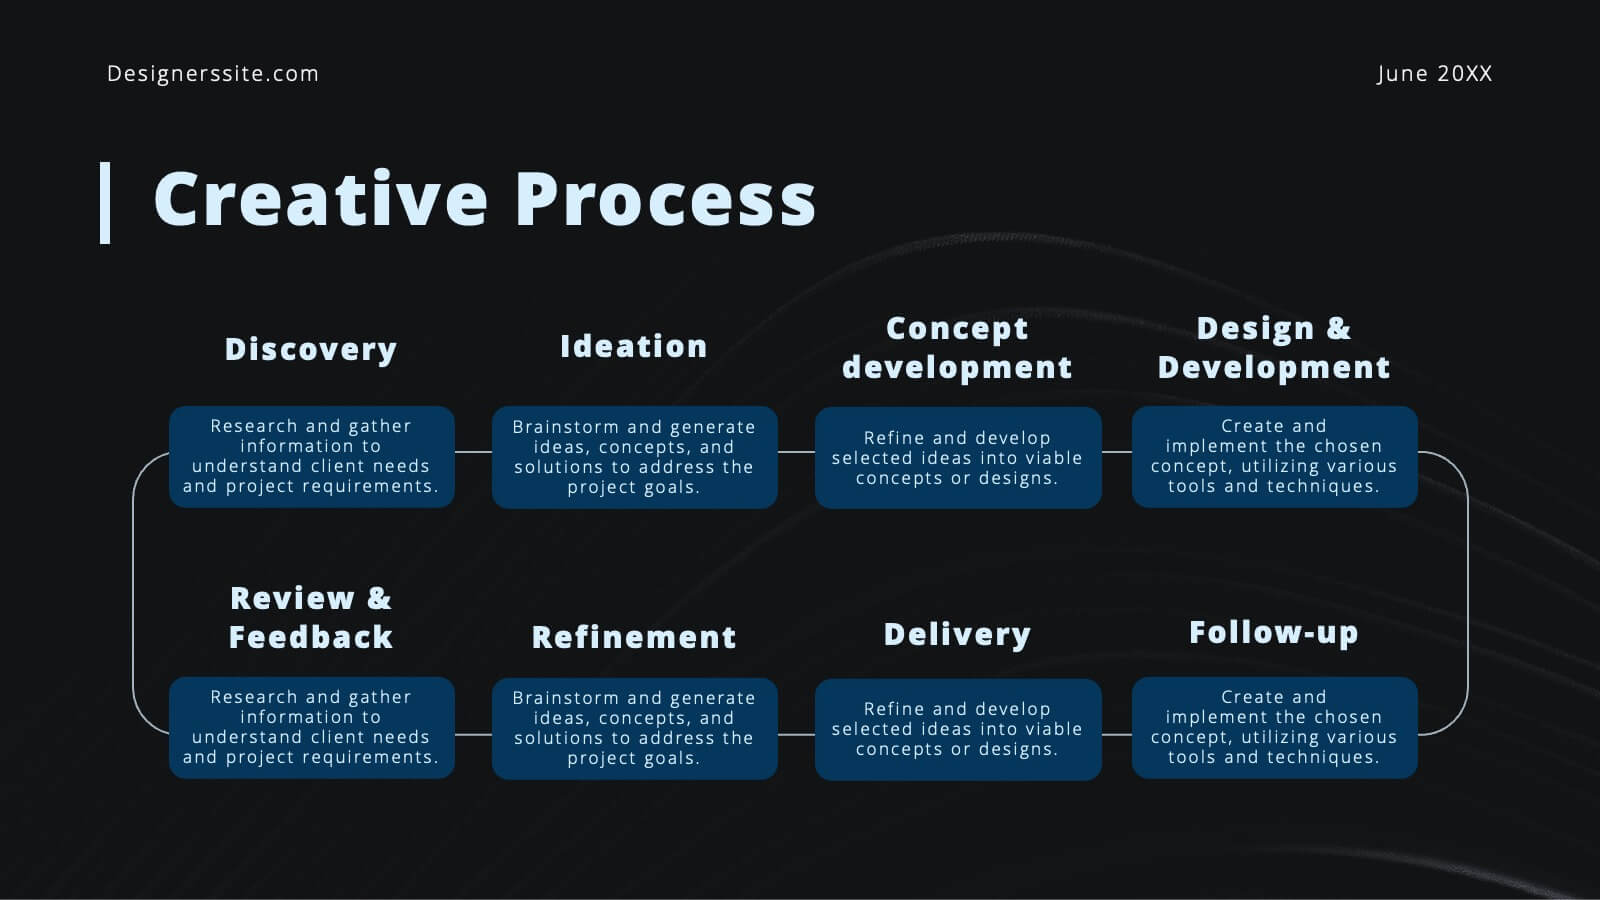
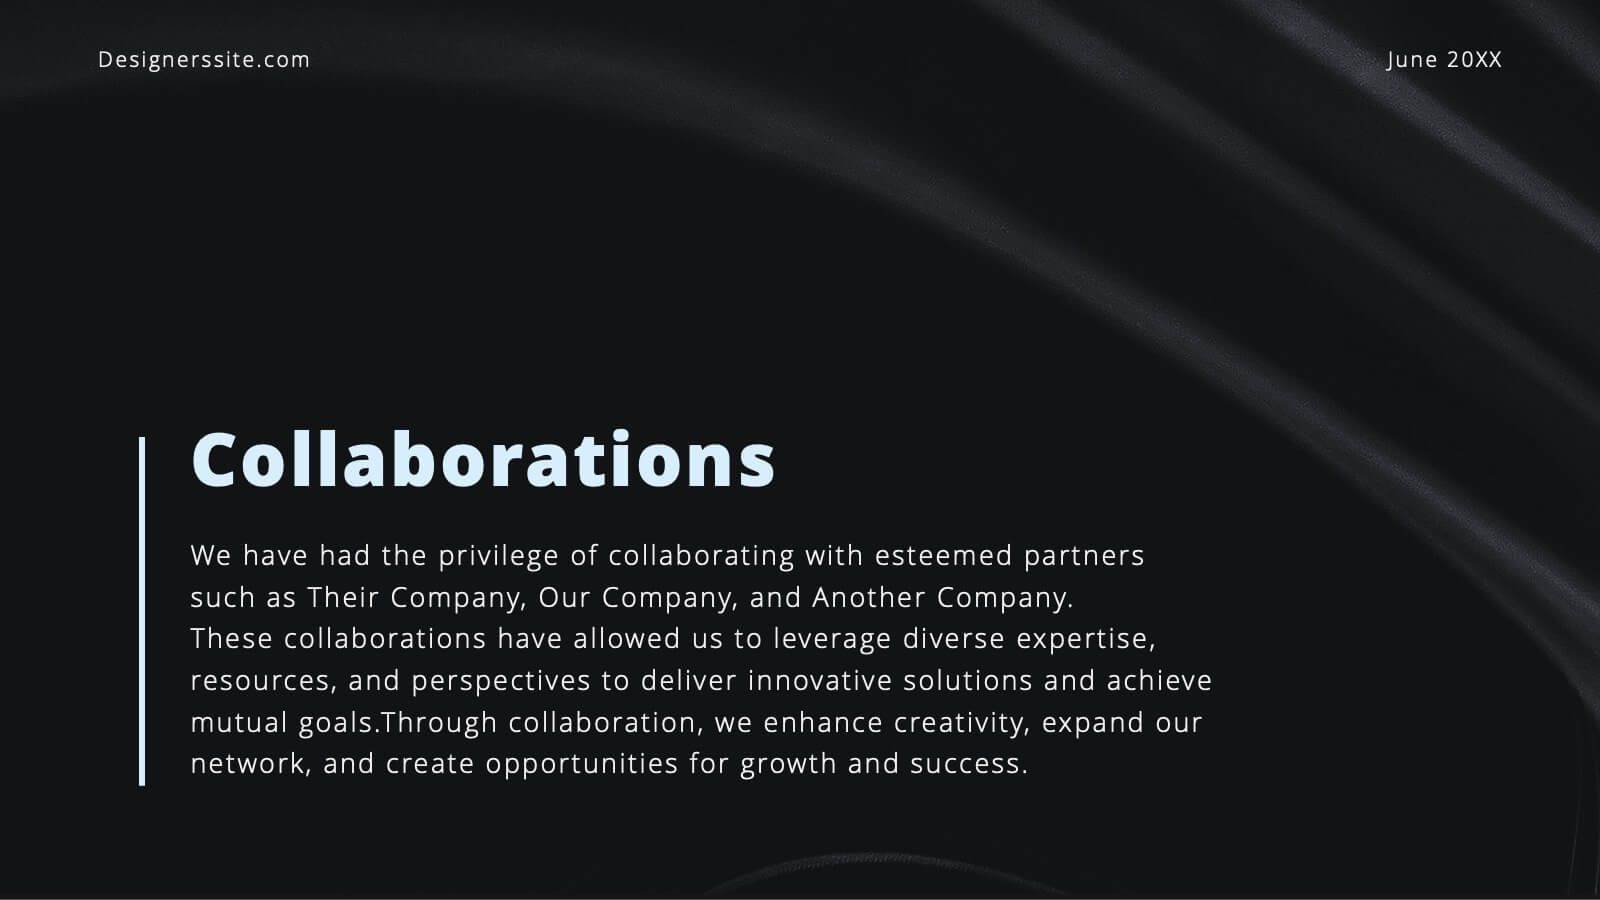
Bravo Creative Portfolio Presentation
Showcase your creative prowess with this sleek, modern portfolio presentation template. Perfect for highlighting featured projects, client testimonials, and your creative process, this template ensures your work shines. Its stylish design and professional layout make it ideal for impressing potential clients and collaborators. Compatible with PowerPoint, Keynote, and Google Slides, it's versatile for any platform.


26 slides
Market Growth Tactics Presentation
Chart a path to success with our Market Growth Tactics presentation template, designed for seamless use in PowerPoint, Keynote, and Google Slides. This template is a vital asset for business strategists, marketing professionals, and consultants who aim to drive growth and capture market share. Our Market Growth Tactics template lays out a strategic framework for identifying and leveraging growth opportunities. It provides a comprehensive array of slides to showcase market analysis, competitive landscape, growth strategies, and execution plans. With customizable elements, you can tailor your presentation to reflect specific market insights and growth targets relevant to your audience. The template is crafted to facilitate clear communication of complex growth strategies, breaking them down into actionable steps with the aid of charts, graphs, and infographics. This helps to convey your message effectively, ensuring that your audience can visualize the growth journey and understand the tactics involved. Elevate your market growth presentations and become an authoritative voice in your industry with our SEO-optimized template, designed to engage, inform, and inspire action towards market expansion.


23 slides
Diamond Business Development Proposal Presentation
Unlock the potential of your business proposals with this bold and engaging presentation template! Perfect for business development pitches, conferences, and workshops, it includes sections for speaker introductions, panel discussions, and session breakdowns. With its clean and professional design, this template ensures clarity and impact. Fully customizable and compatible with PowerPoint, Keynote, and Google Slides.


10 slides
4-Quadrant Responsibility Chart Presentation
Bring your message to life with a slide that feels bold, modern, and instantly engaging. This presentation helps you outline four key responsibilities or categories in a clean quadrant layout, making complex information easy to follow and visually compelling. It’s perfect for strategy, workflow, or team-based insights. Fully compatible with PowerPoint, Keynote, and Google Slides.


27 slides
Drift Rebranding Project Plan Presentation
Transform your brand with this comprehensive rebranding project template! Perfect for presenting brand identity, market analysis, and strategic positioning, it includes slides for logos, color palettes, and brand guidelines. Engage your audience with visually striking designs and detailed content. Compatible with PowerPoint, Keynote, and Google Slides for easy, professional presentations on any platform.


2 slides
Creative Brainstorming Infographic Presentation
Spark fresh ideas with a bold, visually rich layout designed to inspire creative thinking and dynamic collaboration. This presentation blends engaging imagery with clear sections that help you organize concepts, map insights, and share innovative solutions effortlessly. Fully compatible with PowerPoint, Keynote, and Google Slides.


21 slides
Luminary Annual Report Presentation
Create stunning annual reports with this sleek template! Highlight key achievements, financial summaries, and performance metrics. Perfect for showcasing operational updates, strategic initiatives, and market trends. Designed for business professionals and analysts. Compatible with PowerPoint, Keynote, and Google Slides.