


Features
- 3 Unique slides
- Fully editable and easy to edit in Microsoft Powerpoint, Keynote and Google Slides
- 16:9 widescreen layout
- Clean and professional designs
- Export to JPG, PDF or send by email


Do you have any questions?
Recommend


6 slides
Internal and External Communication Plan
Visualize your communication strategy with this dual-channel megaphone infographic, perfect for showcasing internal and external messaging flows. Ideal for corporate updates, PR plans, or stakeholder communications. Fully editable in PowerPoint, Keynote, and Google Slides.


4 slides
Executive Business Planning Roadmap Presentation
Outline your strategic initiatives with this Executive Business Planning Roadmap. Ideal for mapping product development, quarterly goals, or department plans, this slide helps visualize key stages across multiple projects. Easy to edit in PowerPoint, Keynote, and Google Slides—perfect for leadership updates, planning meetings, or executive-level presentations.


7 slides
Self-sufficient Environmental Infographic
In an era where sustainability is paramount, understanding self-sufficiency in environmental contexts has never been more crucial. Our refreshing infographic, adorned in crisp whites, lush greens, with subtle black nuances, delves deep into this pivotal subject. Crafted to be both educational and engaging, this infographic sheds light on the essentials of eco-friendly independence. It's a must-have tool for educators, environmental enthusiasts, policy-makers, and individuals aiming for a green footprint. Seamlessly integrated with PowerPoint, Keynote, and Google Slides, our infographic invites you to explore, educate, and empower for a more sustainable tomorrow.


5 slides
Hierarchical Pyramid Chart Presentation
Bring structure to your ideas with a clean, layered visual that makes complexity feel easy to navigate. This presentation helps you explain levels, priorities, and organizational breakdowns with clarity and flow. Ideal for planning, strategy, and reporting. Fully compatible with PowerPoint, Keynote, and Google Slides.


5 slides
Easy Dinner Recipes Infographics
Easy Dinner Recipes offer a practical solution for busy individuals or those who are new to cooking. These infographic templates offer a practical resource for meal planning and preparation. Its visually appealing design, clear instructions, and organized layout make it easy to follow and implement. Whether for personal use or as a presentation tool in cooking classes this template simplifies the process of discovering and trying out delicious dinner recipes. Use these to provide a collection of quick and delicious dinner recipes. This is designed to make meal planning easier, providing step-by-step instructions, ingredient lists, and visuals.


7 slides
Basic Tables Of Content Infographic
Our basic tables of content infographic provides a streamlined and visually engaging way to present a list of topics or sections in a document, presentation, or any content piece. With a foundational white background contrasted by vivid touches of red and multicolored highlights, this template brings both simplicity and vibrancy to the often-standard table of contents. Perfect for authors, researchers, educators, and students, this infographic offers an efficient way to present a roadmap of what lies ahead. Whether you're working on PowerPoint, Keynote, or Google Slides, this template ensures that your table of contents stands out, guiding your audience effortlessly.


20 slides
Astralisque Sales Proposal Presentation
This Sales Proposal Presentation is designed to help businesses outline their sales strategies with a bold and dynamic style. Covering key elements such as competitive analysis, objectives, pricing strategy, and sales performance metrics, it ensures a professional look. Fully customizable and compatible with PowerPoint, Keynote, and Google Slides.


6 slides
6-Step Circular Process Diagram Presentation
Bring your workflow to life with a clean circular layout that makes every phase feel connected and easy to follow. This presentation breaks complex processes into six intuitive steps, ideal for strategy, planning, or operations. Fully compatible with PowerPoint, Keynote, and Google Slides.
23 slides
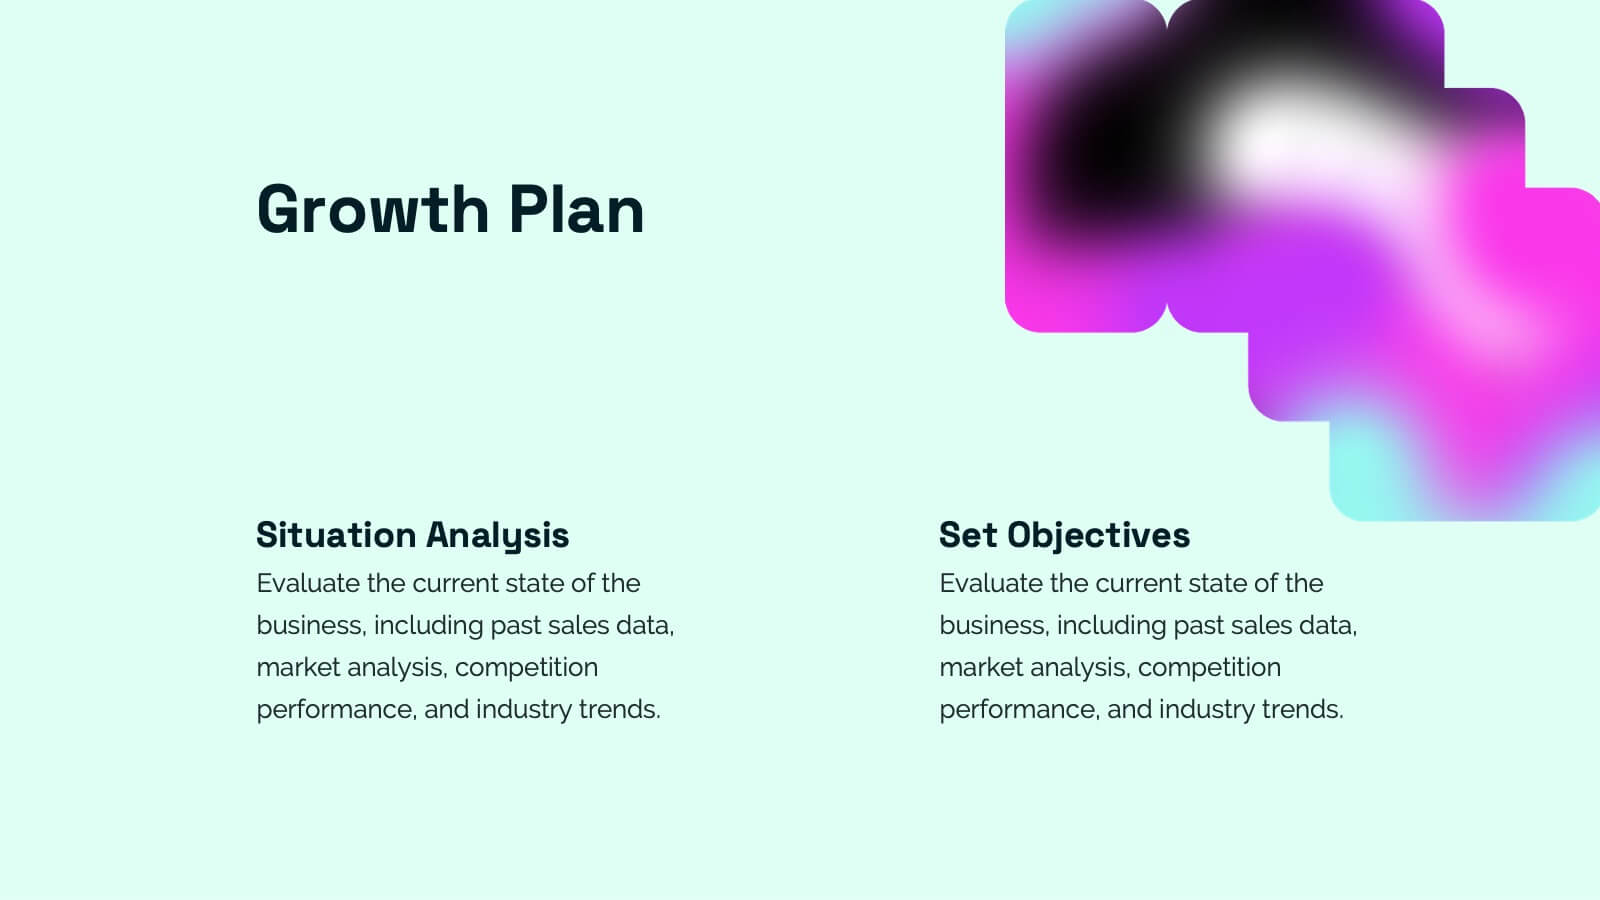
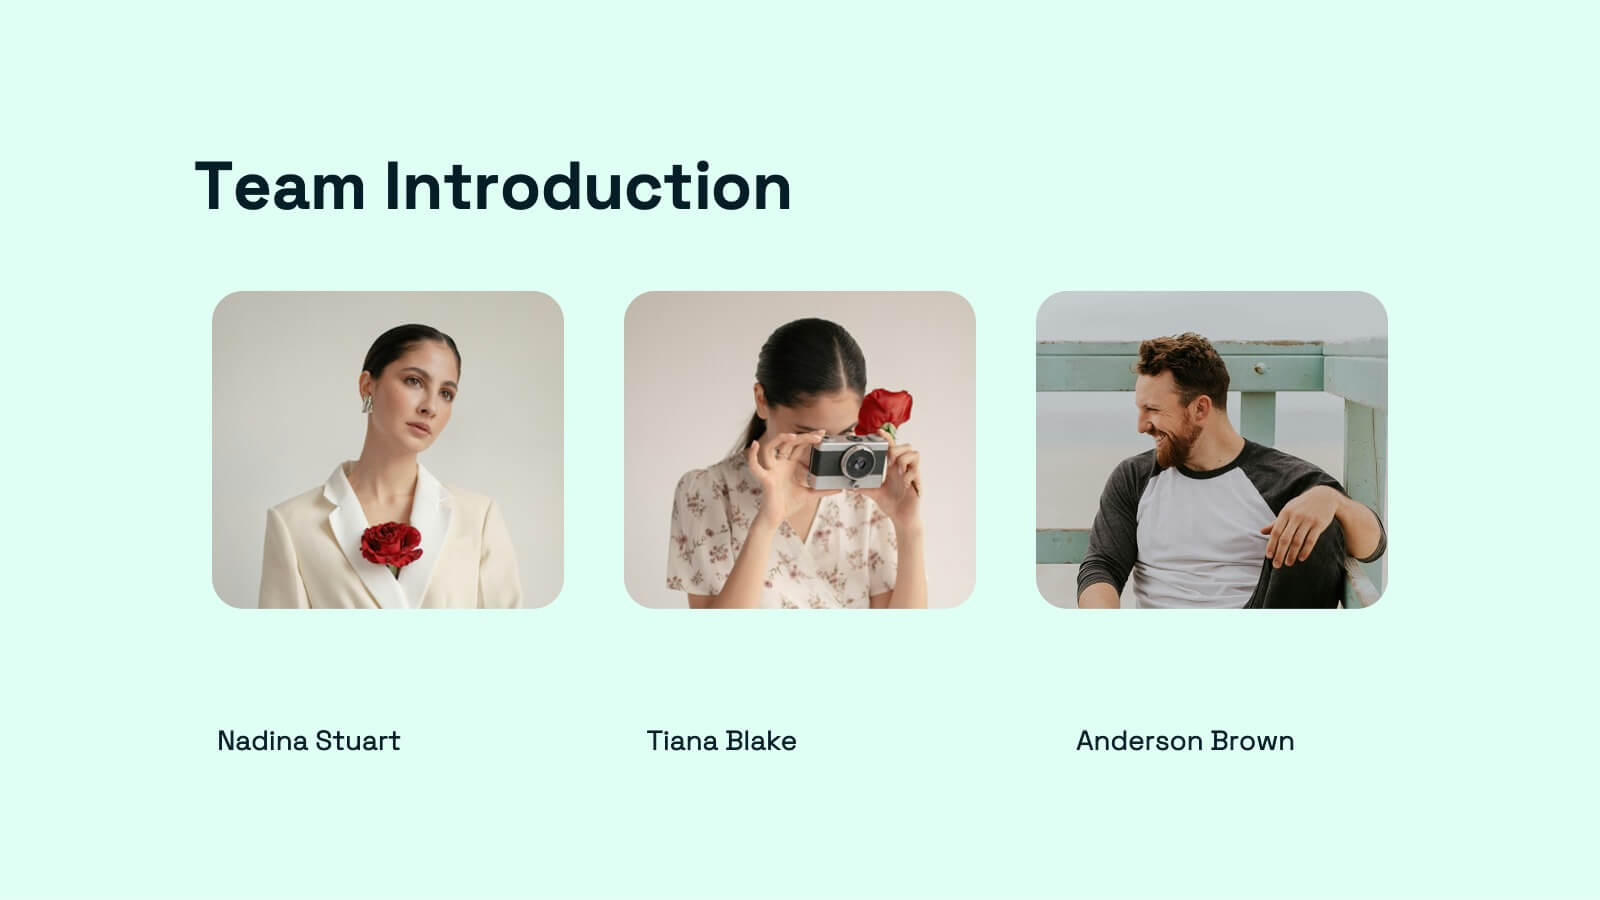
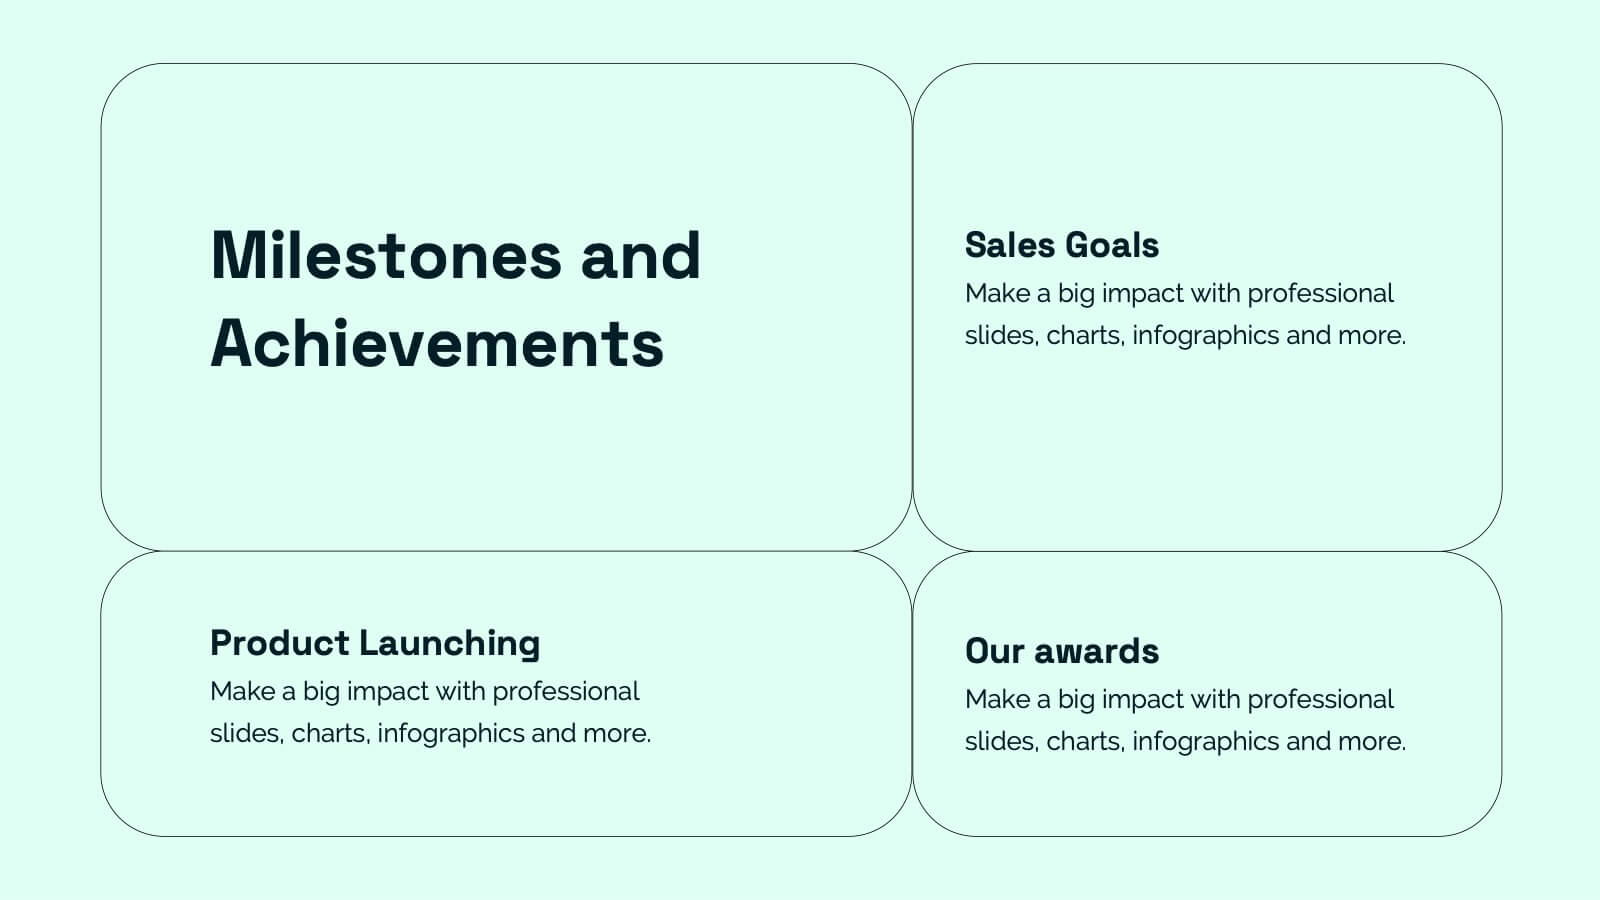
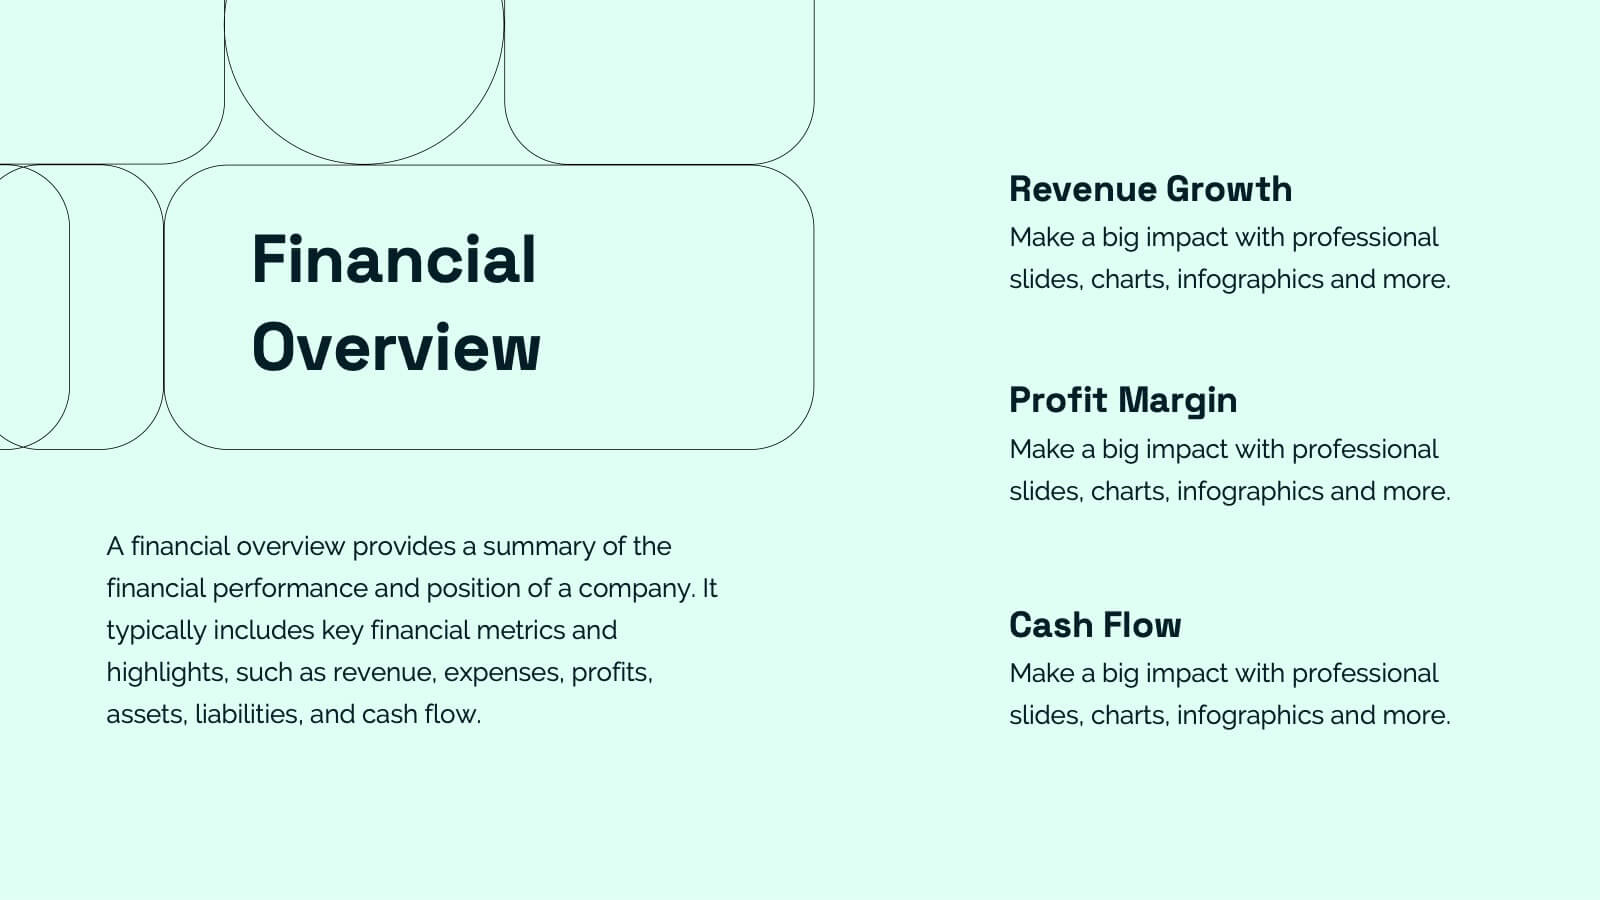
Nymph Startup Pitch Deck Presentation
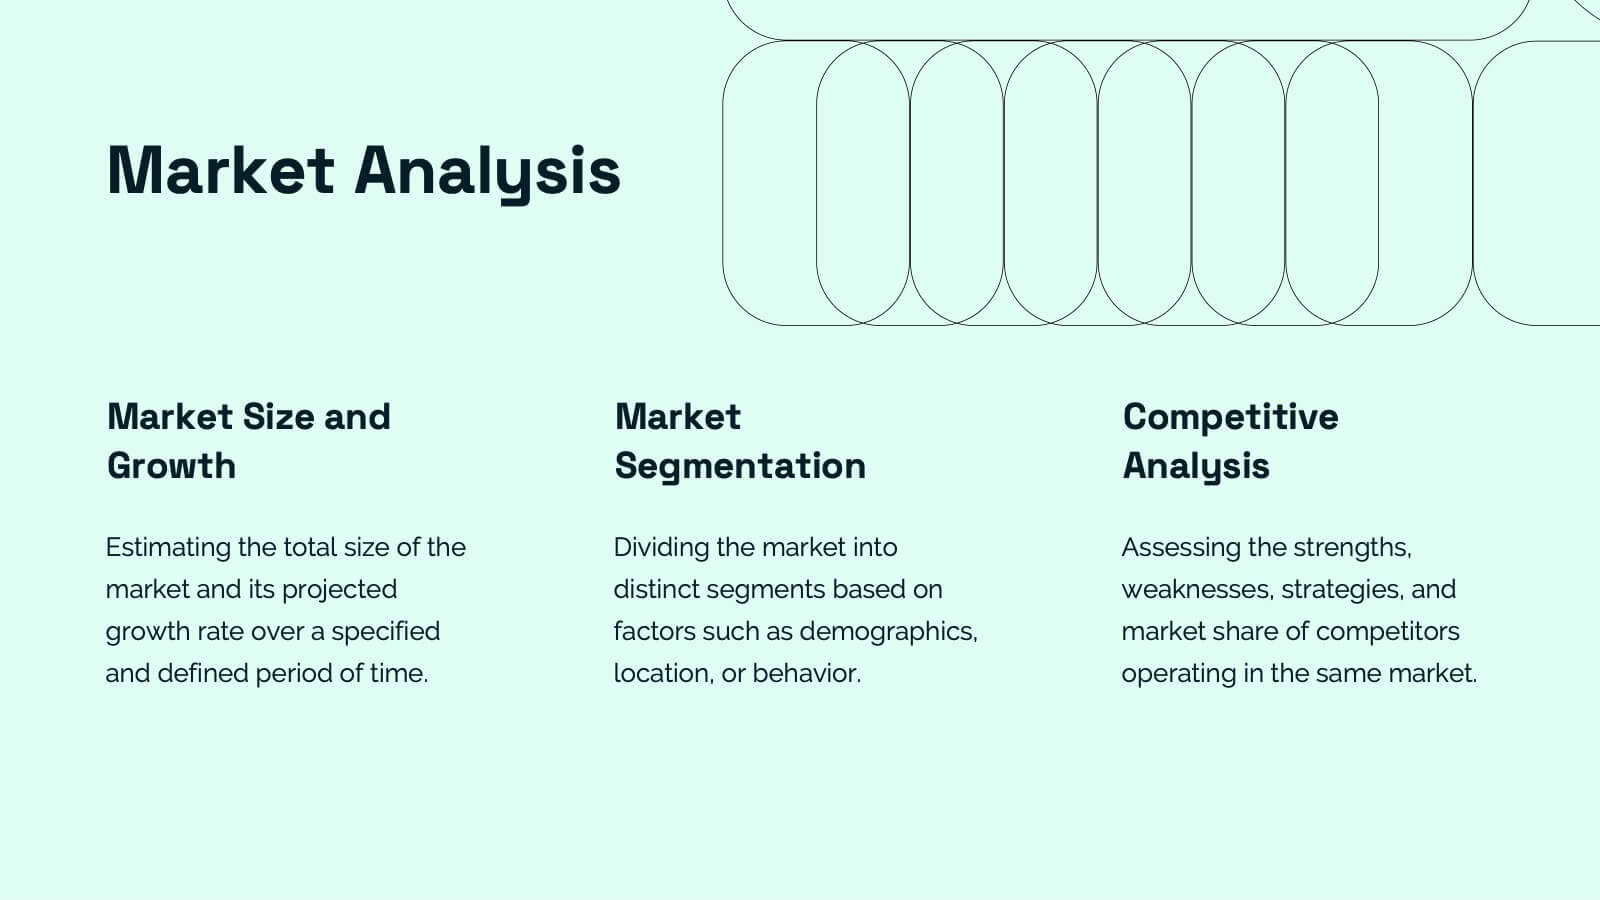
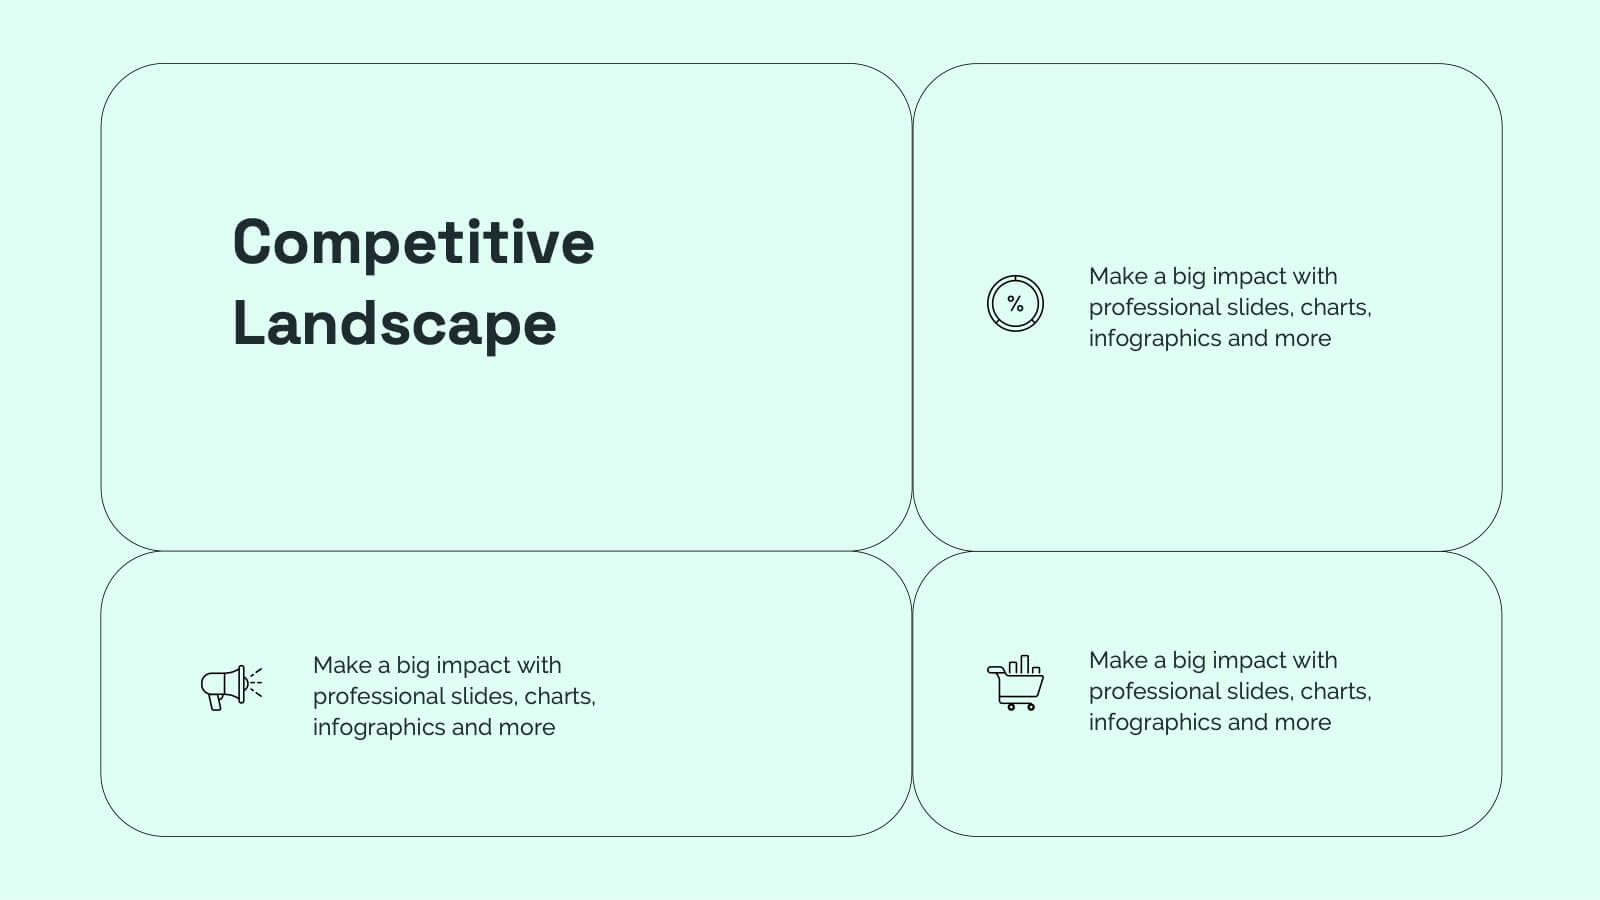
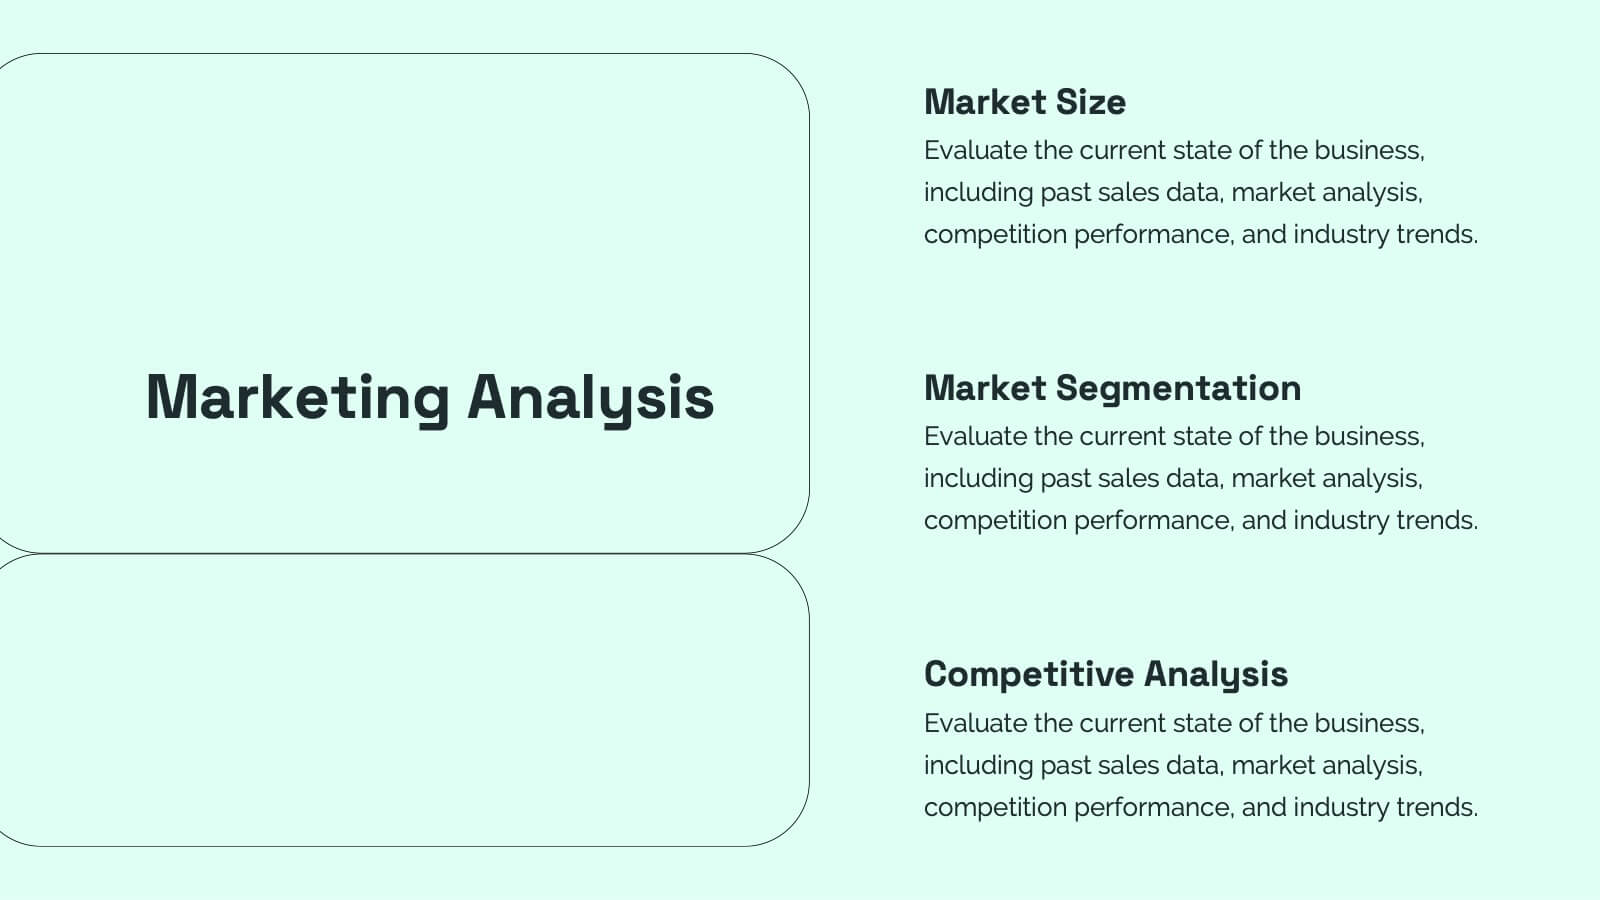
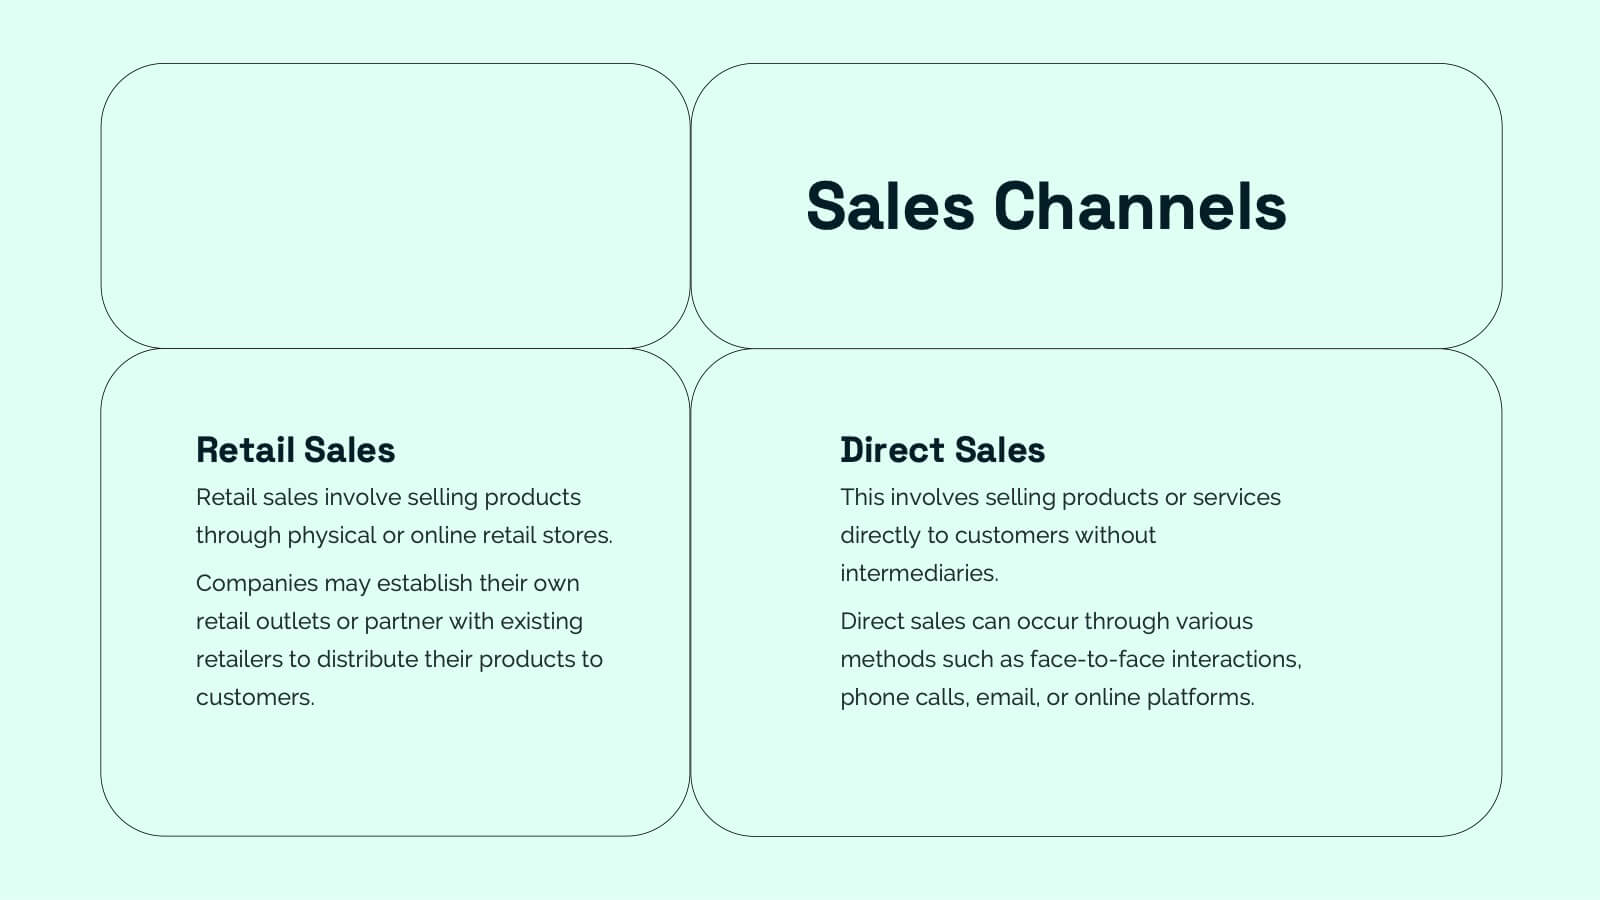
This startup pitch deck template covers all the essentials for presenting a business. It includes slides for mission and vision, business model, market analysis, value proposition, and financial overview. Easily customizable for any startup industry, this modern design makes presenting your ideas a breeze. Compatible with PowerPoint, Keynote, and Google Slides.


7 slides
Loves Travel Infographic Presentation
Travel is an opportunity to get out of our comfort zones and be inspired to try new things, it changes our perspective on the world. Use this template to give your audience an overview of a trip and prepare them for what they will be experiencing. This template features an infographic style design, with plenty of room to describe the locations and activities as well as instructions and tips. Build your own infographic with this template, and add it to your presentations. You can easily add your own content in PowerPoint, Keynote, or Google slides and turn it into a fun presentation in minutes.


5 slides
Oil Industry Trends Infographics
The oil industry, also known as the petroleum industry, is a crucial sector of the global economy that involves exploration, production, refining, and distribution of petroleum products. These infographic templates are designed to showcase key trends and insights in the oil industry. They aims to present complex information in a clear and visually appealing manner, making it easy for your viewers to grasp important concepts and trends in the industry. This is perfect for anyone interested in understanding the trends and dynamics shaping the oil industry. Compatible with Powerpoint, Keynote, and Google Slides.


4 slides
Workforce Adaptation Through Change Management Presentation
Show how your team evolves and thrives through transformation with this visual journey up the change curve. This template uses a clear mountain-climb illustration to highlight workforce progression and adaptation. Ideal for HR, change leaders, and organizational development professionals. Fully compatible with PowerPoint, Keynote, and Google Slides.


26 slides
Orion Creative Agency Pitch Deck Presentation
The Orion Creative Agency Portfolio is a visually stunning and comprehensive presentation template designed to showcase your agency's unique strengths and achievements. The first slide sets the tone with a clean and modern design, perfect for capturing your audience's attention. Following the introduction, the template takes you through an impressive journey of client success stories, highlighting the impact and value your agency brings to the table. The industry trend analysis and competitive landscape sections offer a deep dive into the market, positioning your agency as a leader in the field. You'll also find dedicated slides for your approach, creative process, and campaign execution, ensuring every detail of your agency's methodology is presented clearly. Testimonials and partnership opportunities add credibility, while the future outlook and social impact initiatives highlight your agency's forward-thinking and commitment to positive change. This template is fully compatible with PowerPoint, Keynote, and Google Slides, making it an ideal choice for any agency presentation.


26 slides
Business Research and Development Presentation
Business Research and Development refers to the process of investigating new ideas and methods with the goal of developing new services or processes that can help a company stay competitive in the market. This template is a tool that organizations can use to communicate their research findings and new developments. You can include information on market research, product development, and other aspects of your organization's research and development efforts. Compatible with PowerPoint, Keynote, and Google Slides. It features customizable layouts, charts, and graphs, as well as icons and illustrations that can be modified to fit your brand and message.


8 slides
Effective Team Building Model Presentation
Visualize your strategy for collaboration with the Effective Team Building Model Presentation. This layered block layout is perfect for illustrating step-by-step frameworks, progressive strategies, or hierarchical team development stages. Clean, modern, and color-coded for clarity, it's ideal for internal planning, training, or leadership presentations. Fully editable in PowerPoint, Keynote, Canva, and Google Slides.


5 slides
Contracts and Law Obligations Infographics
Contracts and Law Obligations are crucial aspects of legal systems and business transactions. These infographic templates are designed to help you communicate complex legal concepts in an easy-to-understand format, making it suitable for legal professionals, businesses, or anyone seeking to educate others about contract law. These infographics features a unique, vintage law design with customizable layouts, visually appealing icons, and color schemes that can be tailored to match your presentation needs. It is compatible with PowerPoint, Keynote, and Google Slides, providing flexibility in editing.


5 slides
Poaching Effects Infographics
Navigate the critical issue of wildlife endangerment with our poaching effects infographics. Crafted in earthy tones of brown and tan, this informative and creatively styled vertical template sheds light on the harsh realities of illegal wildlife hunting. Whether you're an environmental activist, an educator, or part of an ecological research team, this infographic is structured to resonate with your audience, offering compelling visuals and thematic icons that starkly represent the consequences of poaching. It's more than a presentation; it's a call to global action, crucial for anyone advocating for wildlife preservation and aiming to inspire change through storytelling.