


Features
- 5 Unique slides
- Fully editable and easy to edit in Microsoft Powerpoint, Keynote and Google Slides
- 16:9 widescreen layout
- Clean and professional designs
- Export to JPG, PDF or send by email


Do you have any questions?
Recommend


21 slides
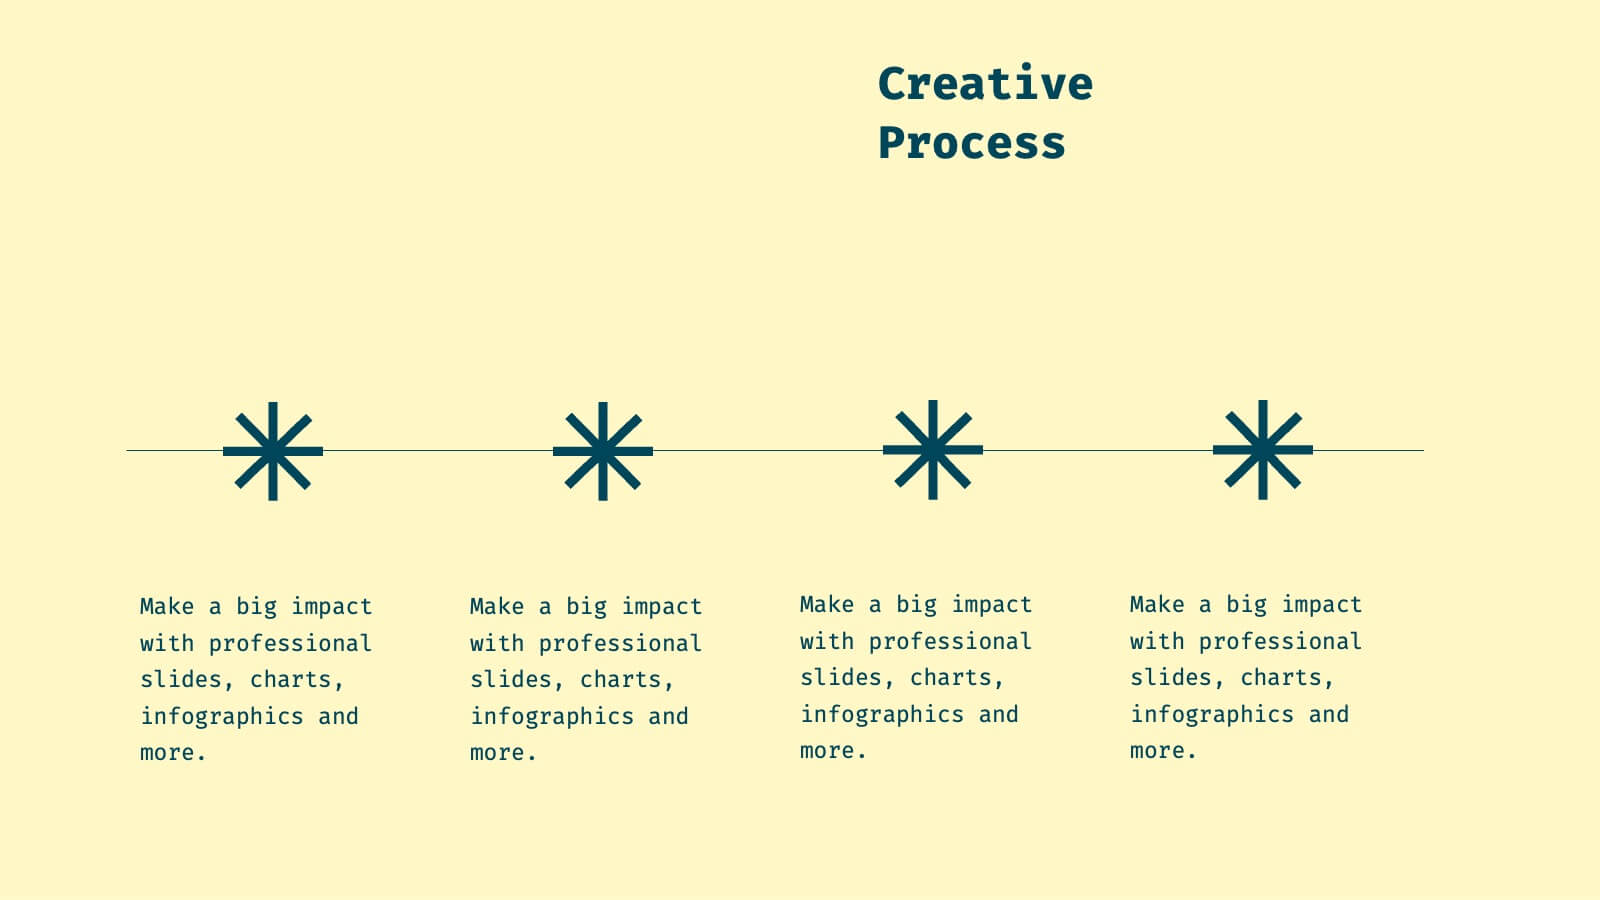
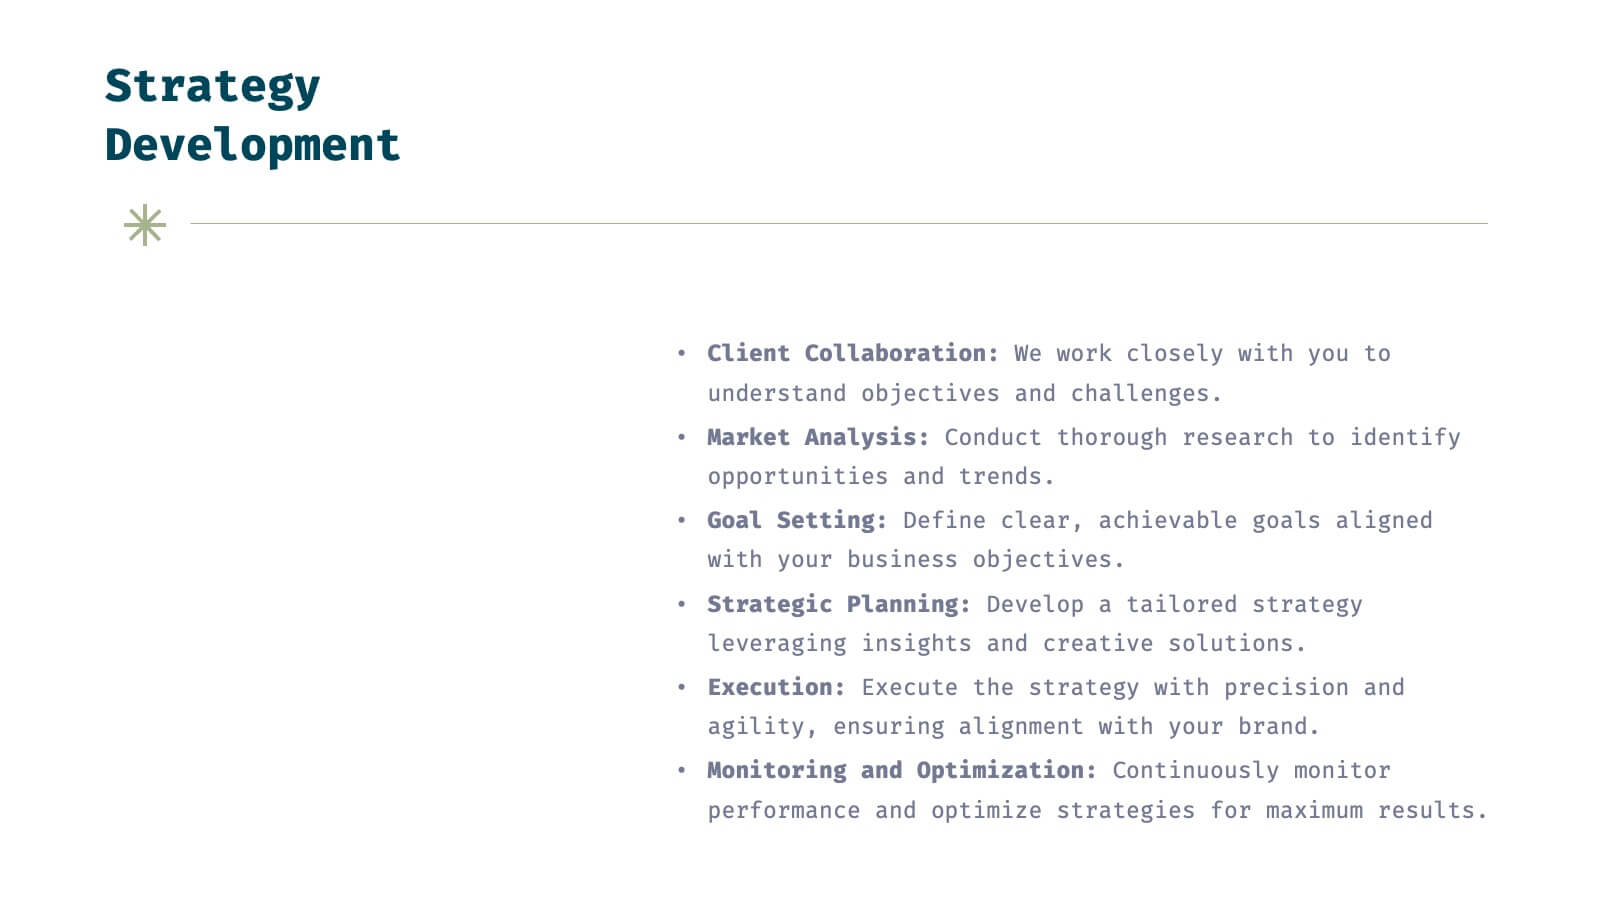
Helix Full-Service Agency Project Plan Presentation
Showcase your agency's expertise with this sophisticated, minimalistic presentation template. Designed to present comprehensive market analysis, strategy development, and client success stories, this template ensures your agency's capabilities are clearly communicated. Its clean design and professional layout make it perfect for building trust and credibility. Compatible with PowerPoint, Keynote, and Google Slides, it's versatile for any platform.


7 slides
Business People Networking Infographic
Networking is the lifeblood of any thriving business. Our business people networking infographic, designed in a pristine white backdrop with striking orange highlights and sophisticated black nuances, encapsulates the essence of professional connections and collaborations. It provides a visual representation of how relationships can foster growth, open opportunities, and catalyze success. Tailored for business leaders, conference organizers, and networking event planners, this template offers a compelling narrative of networking's power. Fully optimized, it's compatible with leading presentation platforms: PowerPoint, Keynote, and Google Slides.


7 slides
Chart Comparison Infographic Presentation
Chart Comparison is the process of comparing different charts or graphs to identify similarities. It involves analyzing multiple sets of data by visually presenting them in charts. Use this template to show the comparison of various charts and how things look when they are compared. This template will help you create a professional Infographic presentation that highlights the key differences between data sets. Each chart can have it's own color, so you can use any color you want. You can also add text in the chart with your own content, and edit in Powerpoint, Keynote, or Google Slides.


10 slides
Organizational Hierarchy Infographic Presentation
Clearly define your Organizational Hierarchy with this structured infographic template. Designed for business presentations, HR teams, and corporate strategy, this visual layout simplifies reporting structures, leadership roles, and team organization. Fully customizable and easy to edit in PowerPoint, Keynote, and Google Slides, making it perfect for internal communications and management reports.


8 slides
Mission Objectives and Long-Term Goals Presentation
Clearly define your roadmap with this Mission Objectives and Long-Term Goals presentation. This clean, step-by-step layout is ideal for showcasing strategic milestones, vision pillars, or future goals. Each point is visually aligned for logical progression, making it perfect for planning sessions. Fully editable in Canva, PowerPoint, or Google Slides.


6 slides
Bubble Diagram for Idea Development Presentation
Visualize your creative process with this Bubble Diagram for Idea Development template. Ideal for brainstorming sessions, project planning, and innovation strategies, this slide uses color-coded lightbulbs and numbered bubbles to illustrate key ideas and their relationships. Perfect for entrepreneurs, teams, and educators, it simplifies complex concepts into a clear, engaging format. Fully editable and compatible with PowerPoint, Keynote, and Google Slides for seamless customization.


6 slides
Circular Wheel Diagram Presentation
Bring motion and balance to your ideas with this clean, circular design that connects every element in a seamless flow. Ideal for showcasing continuous processes, team dynamics, or strategic cycles, it keeps your message clear and engaging. Fully compatible with PowerPoint, Keynote, and Google Slides for easy editing.


5 slides
Regional Economic Growth in Asia Map Presentation
Explore economic landscapes with the "Regional Economic Growth in Asia Map" template, an essential tool for visualizing economic data across Asia. Designed for business strategists and policymakers, it offers detailed insights and regional analysis to support informed decision-making. Compatible with PowerPoint and Google Slides, this template is flexible for both academic and professional uses.


8 slides
Typography Alphabet Grid Concept
Showcase your message with bold clarity using the Typography Alphabet Grid Concept Presentation. Featuring a striking letterform at the center and four customizable sections for key points, this layout is perfect for creative overviews, branding, or idea segmentation. Fully editable in PowerPoint, Keynote, and Google Slides.


3 slides
Company Meeting Summary Presentation
Bring clarity and focus to your post-meeting reports with this modern, professional layout. Designed to highlight discussion points, decisions, and next steps, it helps teams stay aligned and informed. Perfect for corporate updates or project recaps, this template works seamlessly with PowerPoint, Keynote, and Google Slides for quick, easy customization.


4 slides
Internal vs External Stakeholder Strategy Presentation
Clarify your stakeholder landscape with the Internal vs External Stakeholder Strategy Presentation. This slide features a clean quadrant design to distinguish internal and external stakeholders by priority or role. Ideal for strategy meetings, corporate communications, and stakeholder planning sessions. Fully customizable in PowerPoint, Keynote, and Google Slides.


6 slides
OKR Goal-Setting Framework
Clarify your goals and drive performance with this OKR-based layout that maps Objectives, Key Activities, and Results in a clear, actionable format. Ideal for teams, managers, and performance reviews. Each section is fully editable to match your organizational strategy. Compatible with PowerPoint, Keynote, and Google Slides.


5 slides
Milestones Timeline Presentation
The "Milestones Timeline Presentation" template is designed to illustrate the chronological development of a project or event. It's an effective visual tool that aligns milestones along a straightforward horizontal pathway, enhancing clarity and focus on important dates and goals. Each milestone is marked with distinct icons and titles, making it easy to convey progress and upcoming objectives. This template is particularly useful for project managers, team leaders, and educators who need to communicate key phases and achievements in a temporal context. It serves as an invaluable asset for meetings, reports, or educational materials, ensuring that each milestone is clearly highlighted and easily understood.


4 slides
Market Expansion Planning with Blue Ocean Presentation
Visualize your growth journey with this two-step strategic layout. Ideal for presenting current positioning and future market opportunities using Blue Ocean thinking. Each step is illustrated with bold icons and color-coded nodes. Fully editable in PowerPoint, Keynote, and Google Slides—perfect for business development, strategy sessions, and executive presentations.


6 slides
Bubble Map Ideas Infographics
Visualize your ideas creatively with our Bubble Map Ideas infographic template. This template is fully compatible with popular presentation software like PowerPoint, Keynote, and Google Slides, allowing you to easily customize it to brainstorm and organize your concepts using a bubble map format. The Bubble Map Ideas infographic template offers a visually engaging platform to brainstorm and categorize ideas, concepts, and relationships in a structured and visually appealing manner. Whether you're a creative thinker, project manager, or educator, this template provides a user-friendly canvas to create informative presentations and visualizations of your ideas. Elevate your idea generation and organization with this SEO-optimized Bubble Map Ideas infographic template, thoughtfully designed for clarity and ease of use. Customize it to map out your ideas, prioritize them, and identify key connections, ensuring that your creative process becomes more organized and productive. Start crafting your personalized infographic today to bring your ideas to life.


4 slides
Simple Daily Checklist Presentation
Stay organized and motivated with a clear, structured layout that helps you track tasks, goals, and priorities with ease. Perfect for daily planning, progress tracking, or productivity meetings, this presentation keeps everything simple and focused. Fully compatible with PowerPoint, Keynote, and Google Slides for smooth, customizable editing.


2 slides
Digital Mockup Screens for Apps Presentation
Showcase your app in action with the Digital Mockup Screens for Apps Presentation. This bold and modern slide layout centers your mobile UI on colorful abstract shapes, drawing attention to your product. Ideal for startup demos, app features, or UI/UX portfolios. Fully editable in PowerPoint, Keynote, Canva, and Google Slides.