


Features
- 20 Unique Slides
- Fully editable and easy to edit in Microsoft Powerpoint, Keynote and Google Slides
- 16:9 widescreen layout
- Clean and professional designs
- Export to JPG, PDF or send by email


Do you have any questions?
Recommend


10 slides
Crafting a Strong Business Mission Statement Presentation
Elevate your company’s identity with this modern, vertical infographic slide focused on mission development. Featuring five clearly stacked sections with iconography and text areas, this layout helps communicate core values, goals, and strategic intentions. Ideal for brand storytelling, startup pitches, and leadership decks. Fully editable in PowerPoint, Keynote, and Google Slides.


20 slides
Aether Marketing Research Report Presentation
The Marketing Research Report Presentation Template offers a sleek design with 20 fully customizable slides, ideal for presenting in-depth marketing insights. This template features sections for industry analysis, consumer behavior, emerging technologies, and marketing trends like SEO, social media, and influencer strategies. It also highlights e-commerce trends, personalization, sustainability, and storytelling techniques. The modern black-and-gold gradient aesthetic adds sophistication, making it perfect for professional reports. Compatible with PowerPoint, Keynote, and Google Slides, this template ensures a polished and engaging presentation experience.


21 slides
Eidora Qualitative Research Findings Presentation
Present your research findings with confidence using this professional and stylish presentation template. Covering key sections like objectives, methodology, data analysis, and recommendations, it helps you communicate complex information with clarity and impact. Perfect for academic or business use. Compatible with PowerPoint, Keynote, and Google Slides for easy customization.


29 slides
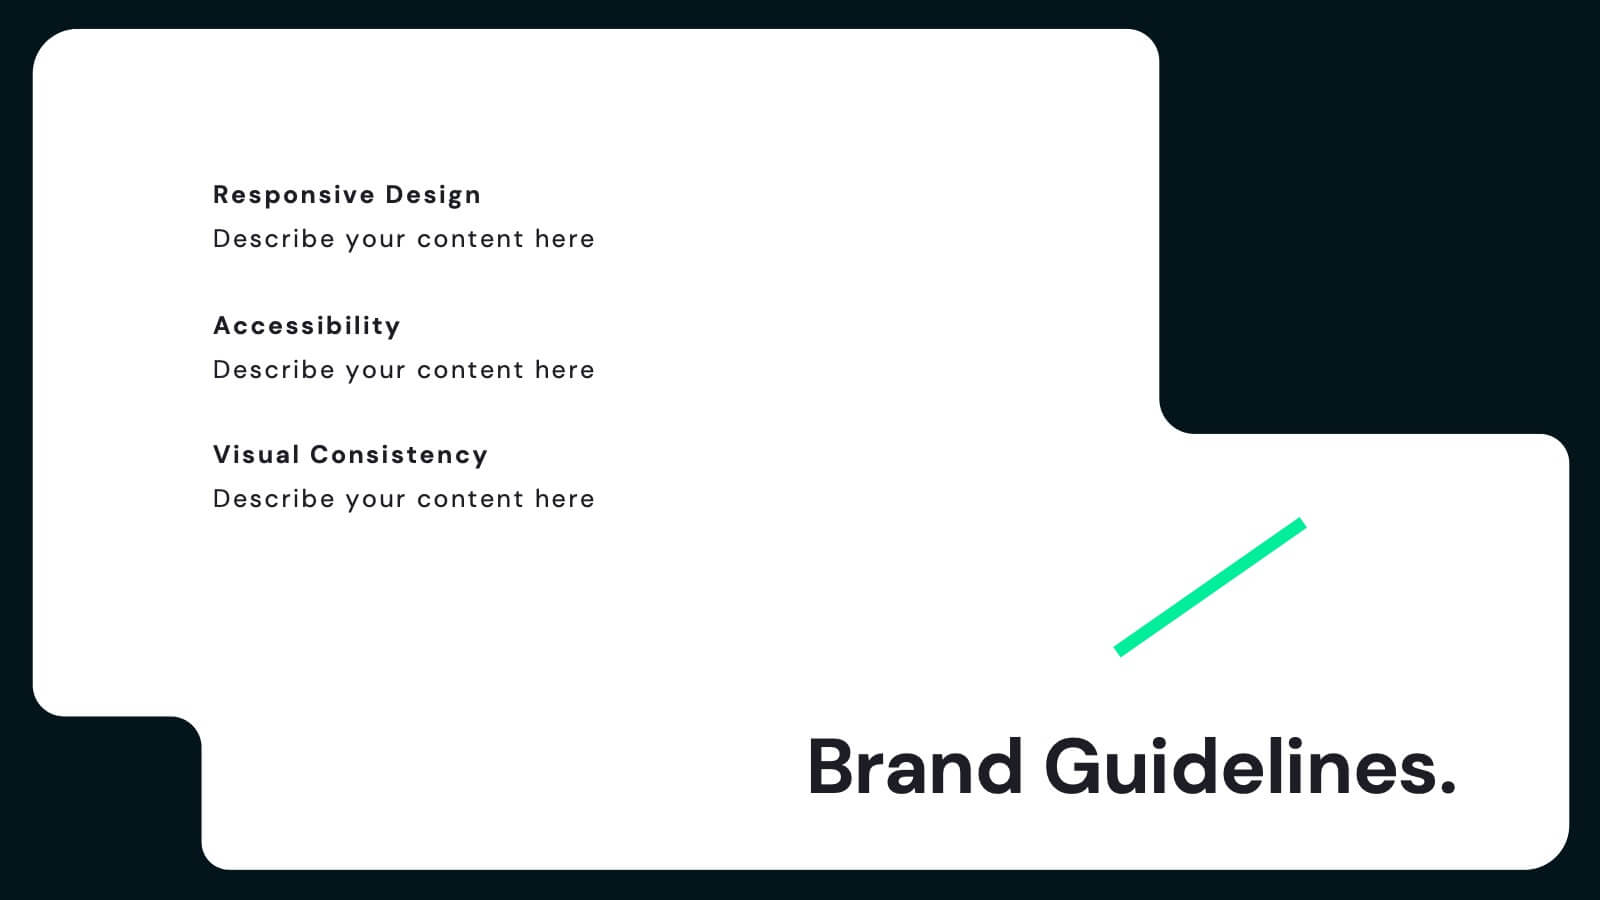
Shadowglow Brand Guidelines Proposal Presentation
Present a cohesive brand vision with this professional template, designed for crafting detailed and visually compelling brand guidelines. Highlight essential components like brand vision and mission, brand values, and identity elements, including color palettes, typography, and imagery. This template seamlessly incorporates customer personas, tone and voice guidelines, and brand touchpoints to define the essence of your brand's communication. Utilize slides for website, social media, and packaging strategies to establish consistency across all platforms. Customizable and compatible with PowerPoint, Google Slides, and Keynote, this design ensures clarity and professionalism, making it ideal for agencies or teams presenting comprehensive brand proposals.


4 slides
Professional Team Member Slides Presentation
Meet your team in a fresh, dynamic way with a layout that highlights personalities, roles, and key contributions at a glance. This presentation helps introduce members clearly, supporting stronger collaboration and professional communication across any project. Fully customizable and compatible with PowerPoint, Keynote, and Google Slides.


22 slides
Athena Creative Design Report Presentation
Showcase your creative projects with this vibrant design report template! Highlight objectives, concept development, prototypes, and design iterations with sleek visuals. Perfect for designers and creative teams. Compatible with PowerPoint, Keynote, and Google Slides.


5 slides
Business Challenges and Solutions
Visualize your journey from problem to progress with this Business Challenges and Solutions infographic. Designed with a mountain path metaphor, it effectively communicates four key stages or issues alongside their respective solutions. Ideal for project timelines, team planning, or strategic overviews. Fully editable in PowerPoint, Keynote, and Google Slides.


8 slides
Winning Strategies for Professional Success Presentation
Showcase your top performers, strategic milestones, or ranked insights with this podium-style template. Featuring vibrant visuals and structured layout, it’s ideal for performance reviews, leadership presentations, and competitive analysis. Fully editable in PowerPoint, Keynote, and Google Slides—perfect for professional success stories, rankings, and progress highlights.


5 slides
Defining Target Market and Audience Presentation
Identify and segment your ideal customer base with this visually structured pyramid slide. Designed to represent layered audience demographics or buyer personas, each level allows space for detailed insights and strategy alignment. The accompanying icons and side labels enhance clarity and storytelling for marketing, branding, or campaign planning presentations. Fully editable in PowerPoint, Keynote, and Google Slides to fit your branding and messaging needs.


26 slides
Summer Sale Presentation
Soak up the bright, sunny vibes of a presentation template that’s perfectly tailor-made for the lively summer season. Its radiant design, infused with the essence of summer sales and tropical aesthetics, is a perfect match for retail campaigns, travel promotions, or any topic that aims to bring the sizzle of summer into a room. Bright colors, playful graphics, and beach-inspired backgrounds set the stage for vibrant storytelling, whether you're introducing a seasonal team, showcasing hot vacation spots, or highlighting the latest summer fashion. The template not only captures the casual, cheerful spirit of the season but also ensures that your content makes a splash with clear, concise data displays and infographics. It’s a breeze to use across various platforms like PowerPoint, Keynote, and Google Slides, ensuring your summer message is as refreshing as a cool ocean wave.


4 slides
End-to-End Supply Chain Optimization Presentation
Streamline your logistics strategy with this modern End-to-End Supply Chain Optimization slide. Featuring bold vector icons representing production, automation, and distribution, this layout clearly visualizes key supply chain stages. Ideal for presenting operations flow, logistics planning, or manufacturing improvements. Fully customizable in PowerPoint, Keynote, and Google Slides for seamless integration into your business deck.

21 slides
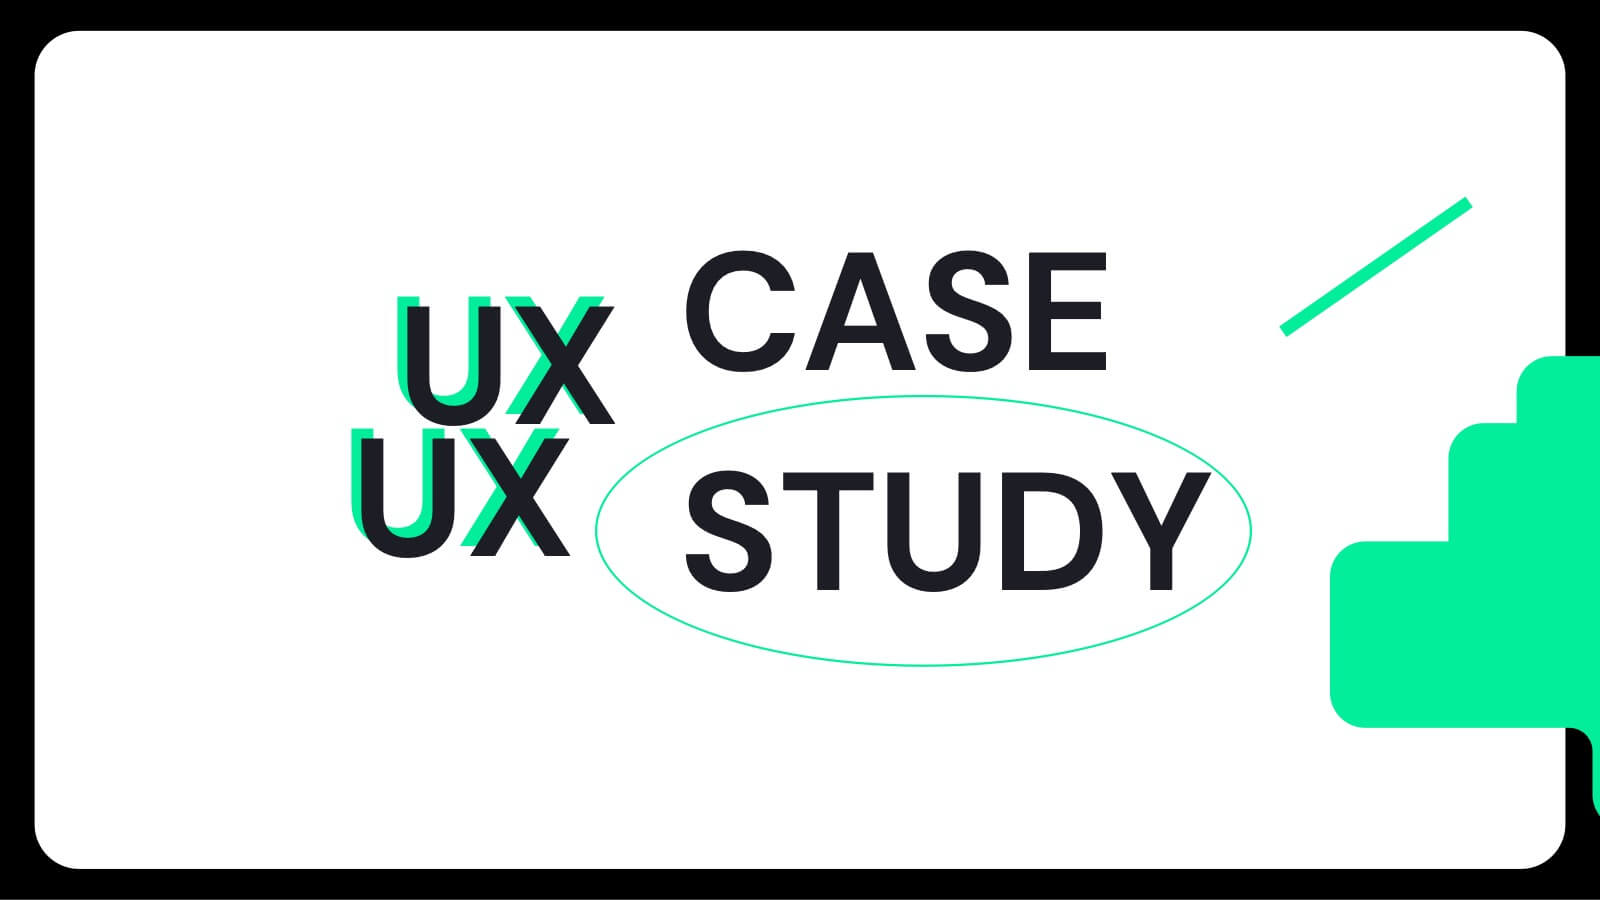
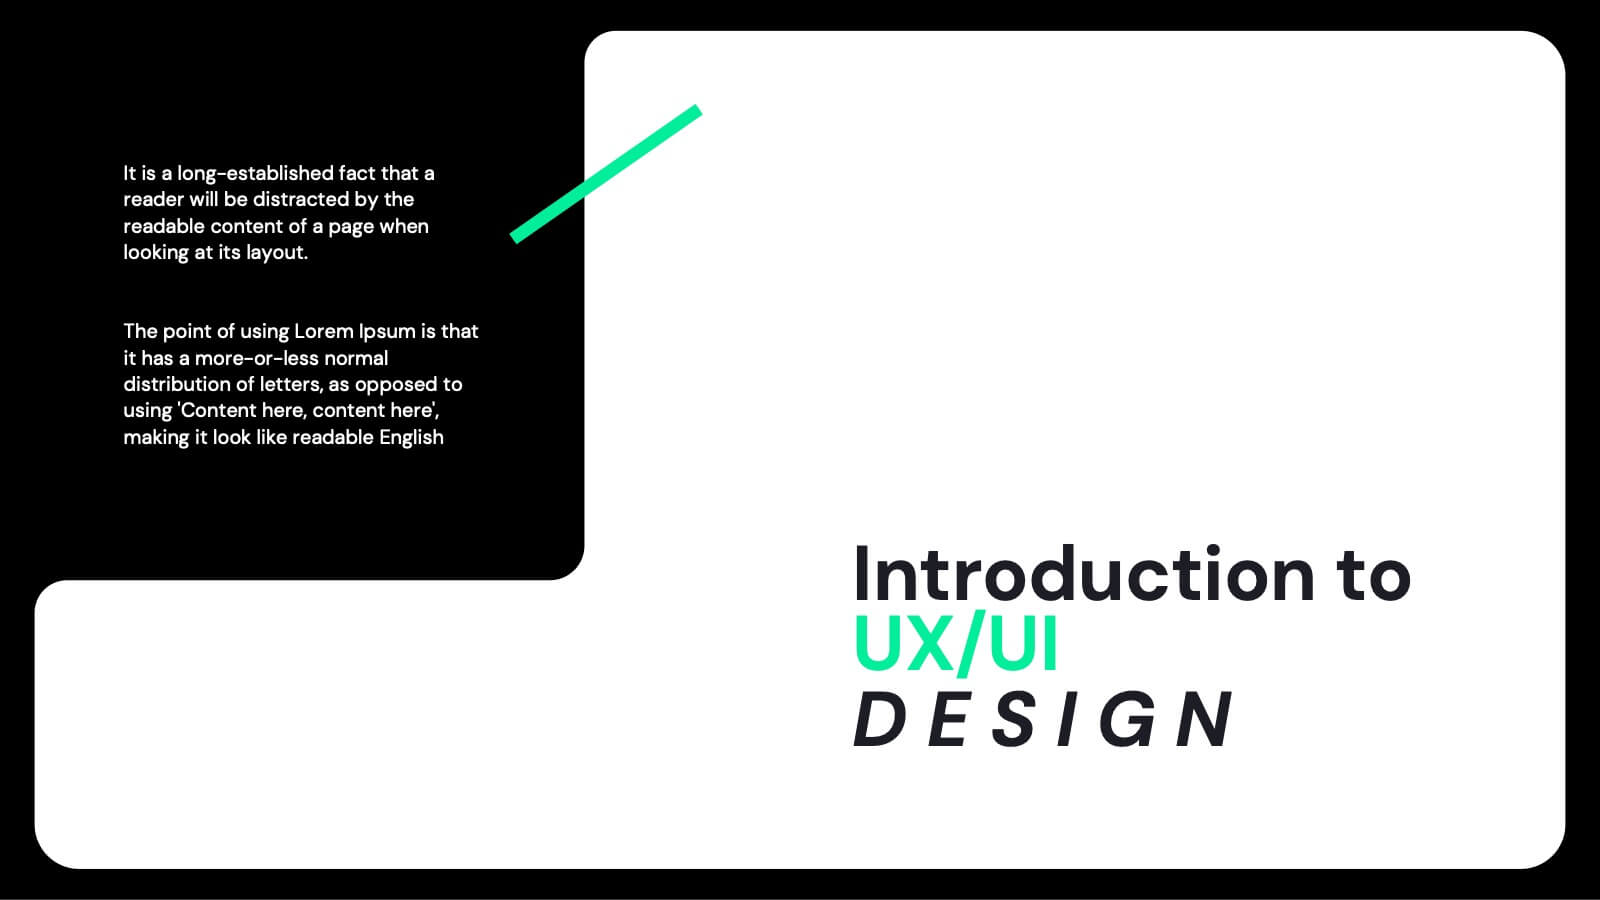
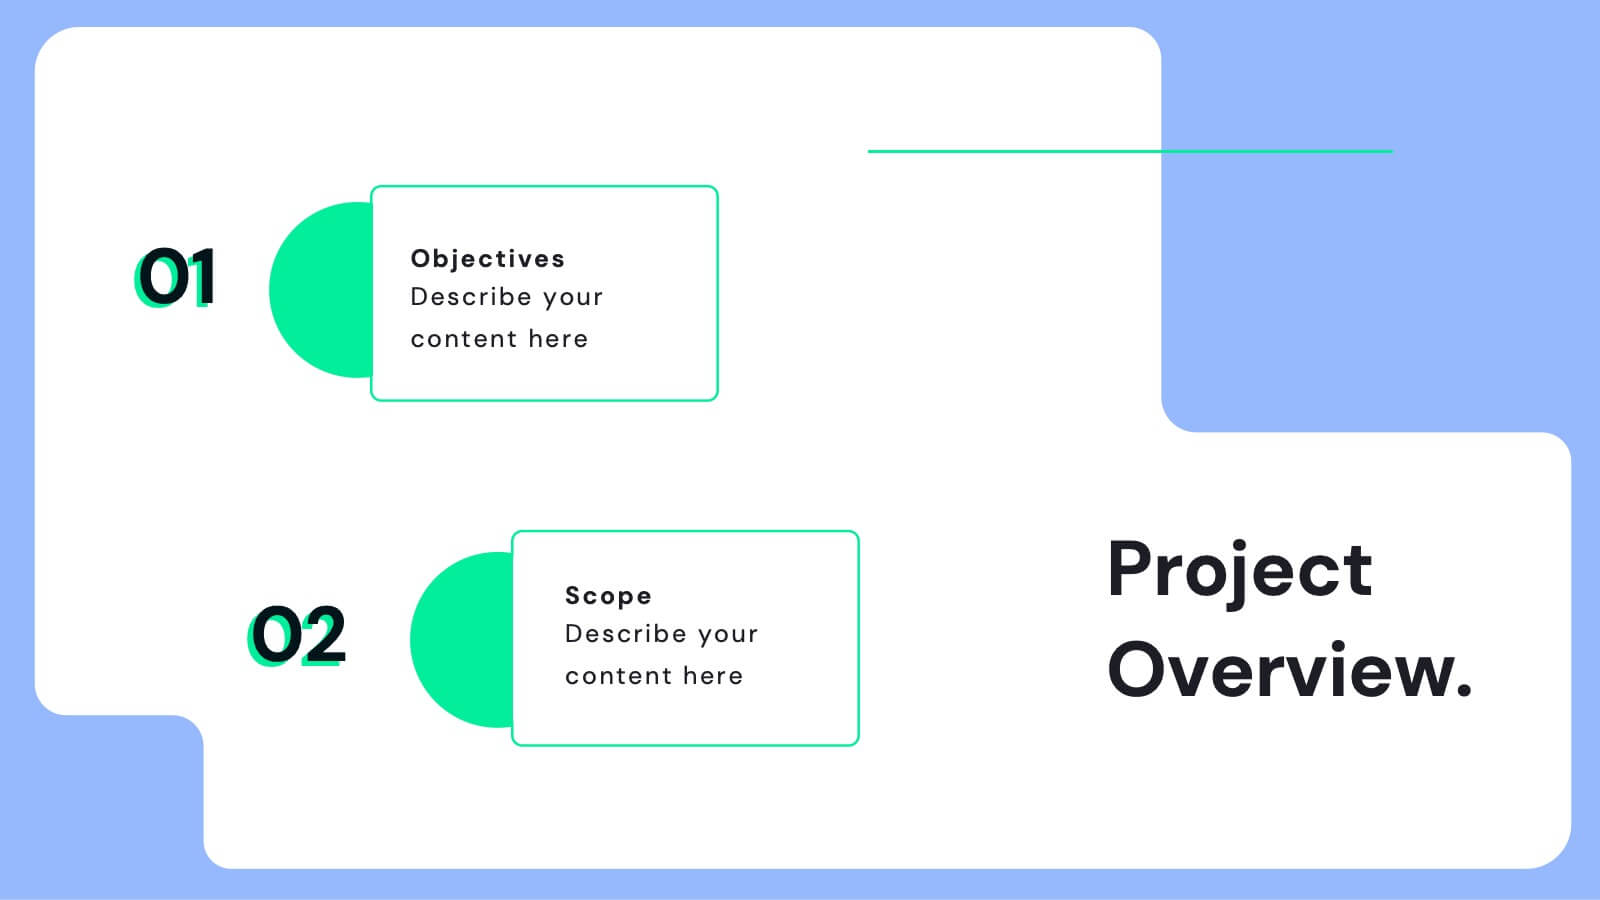
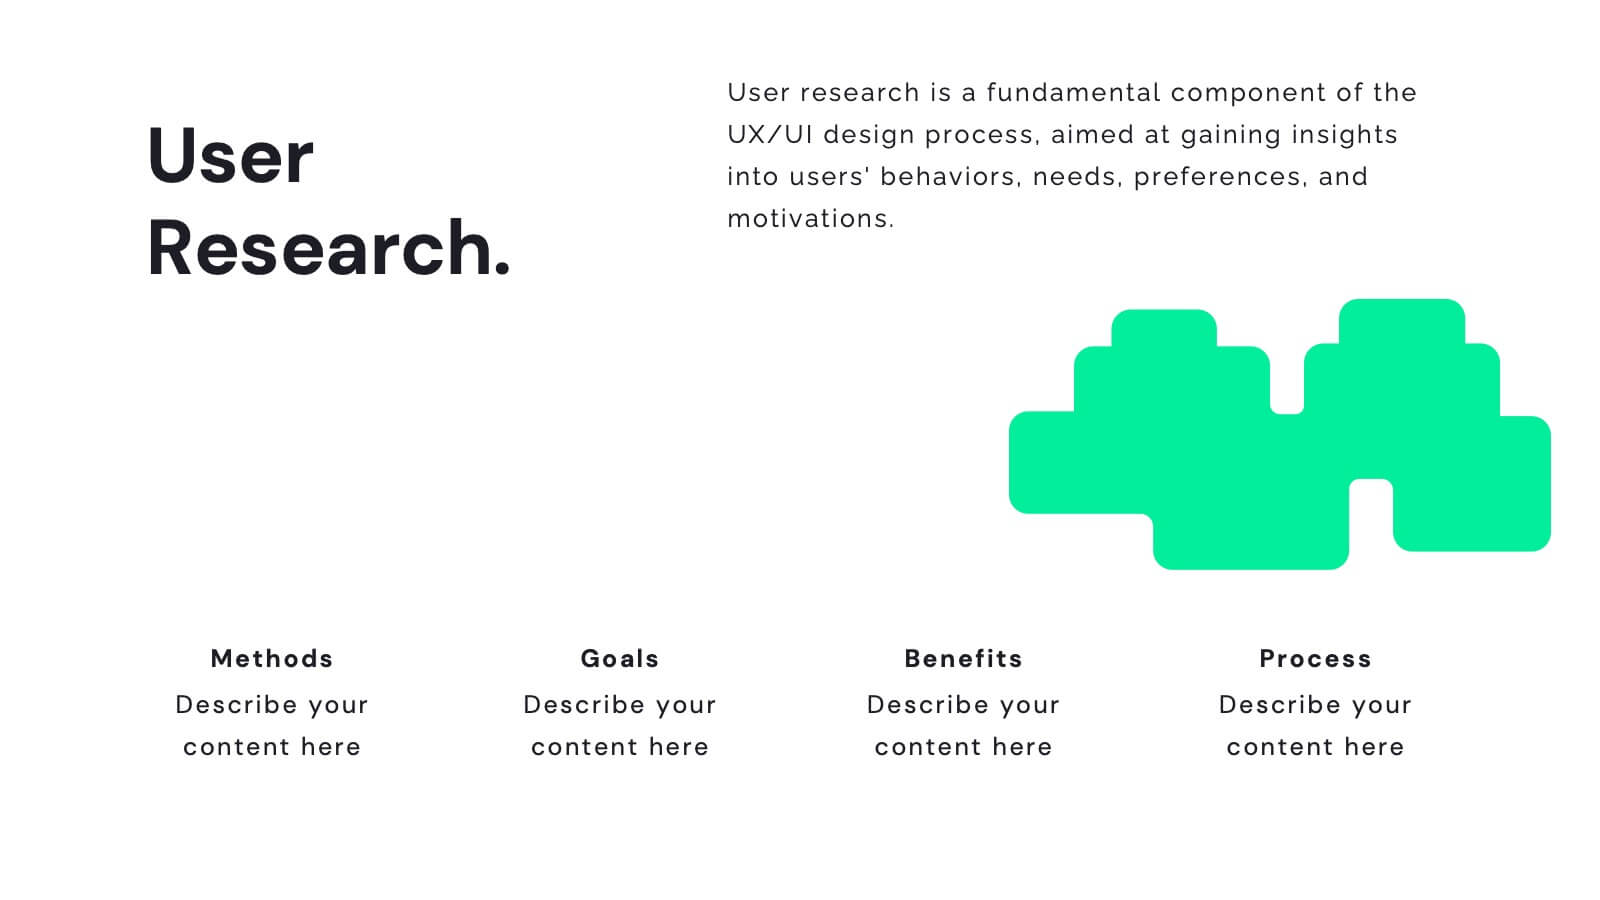
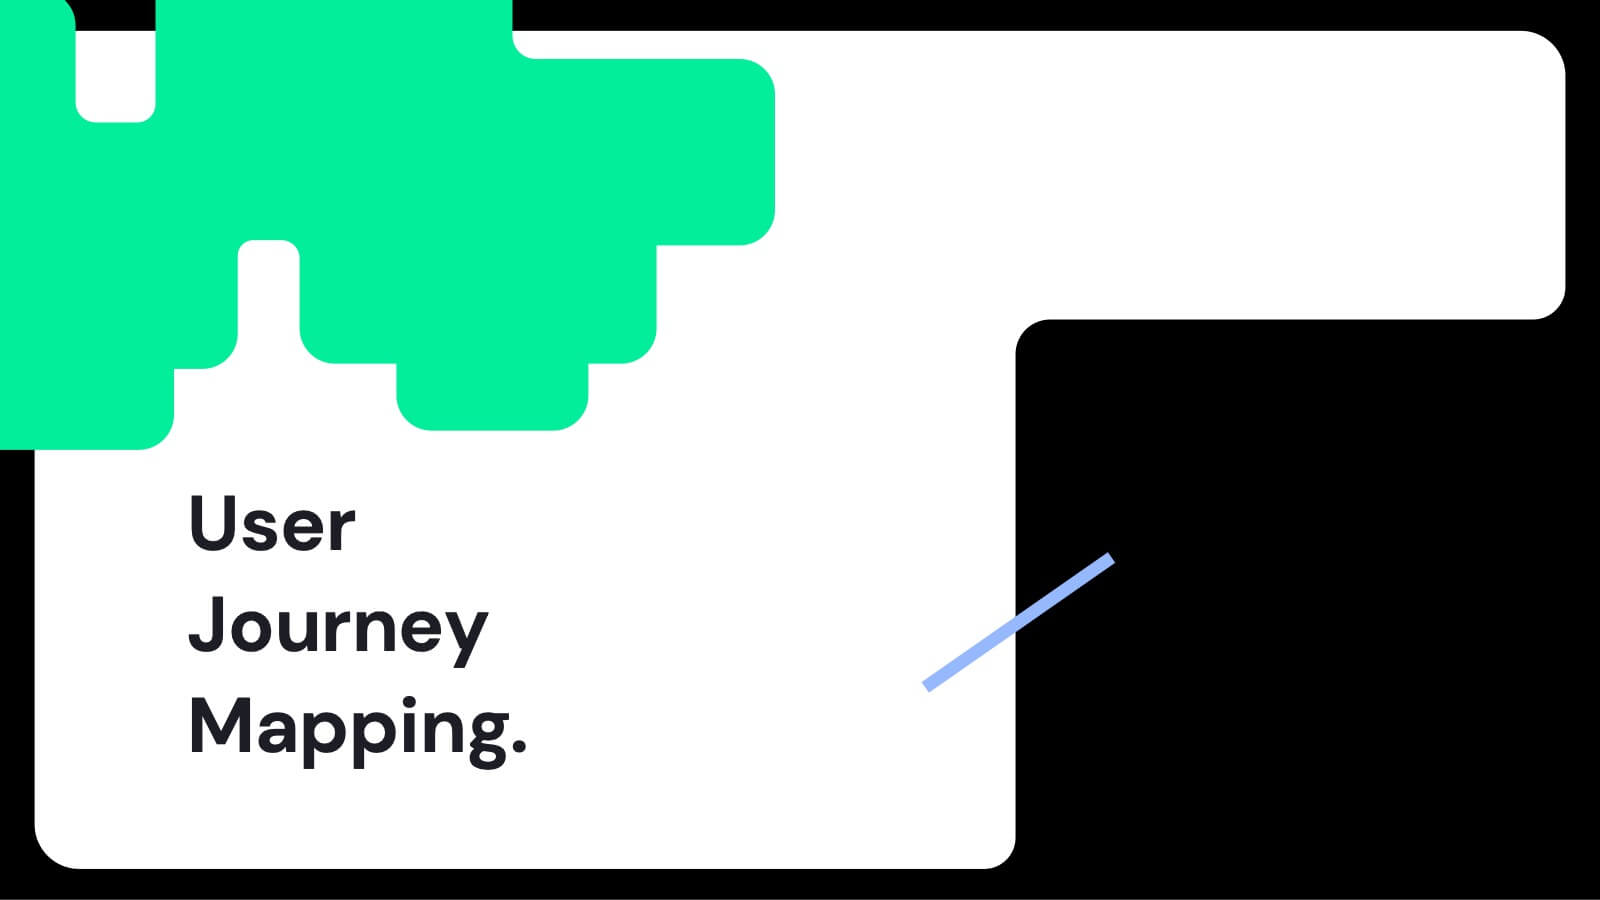
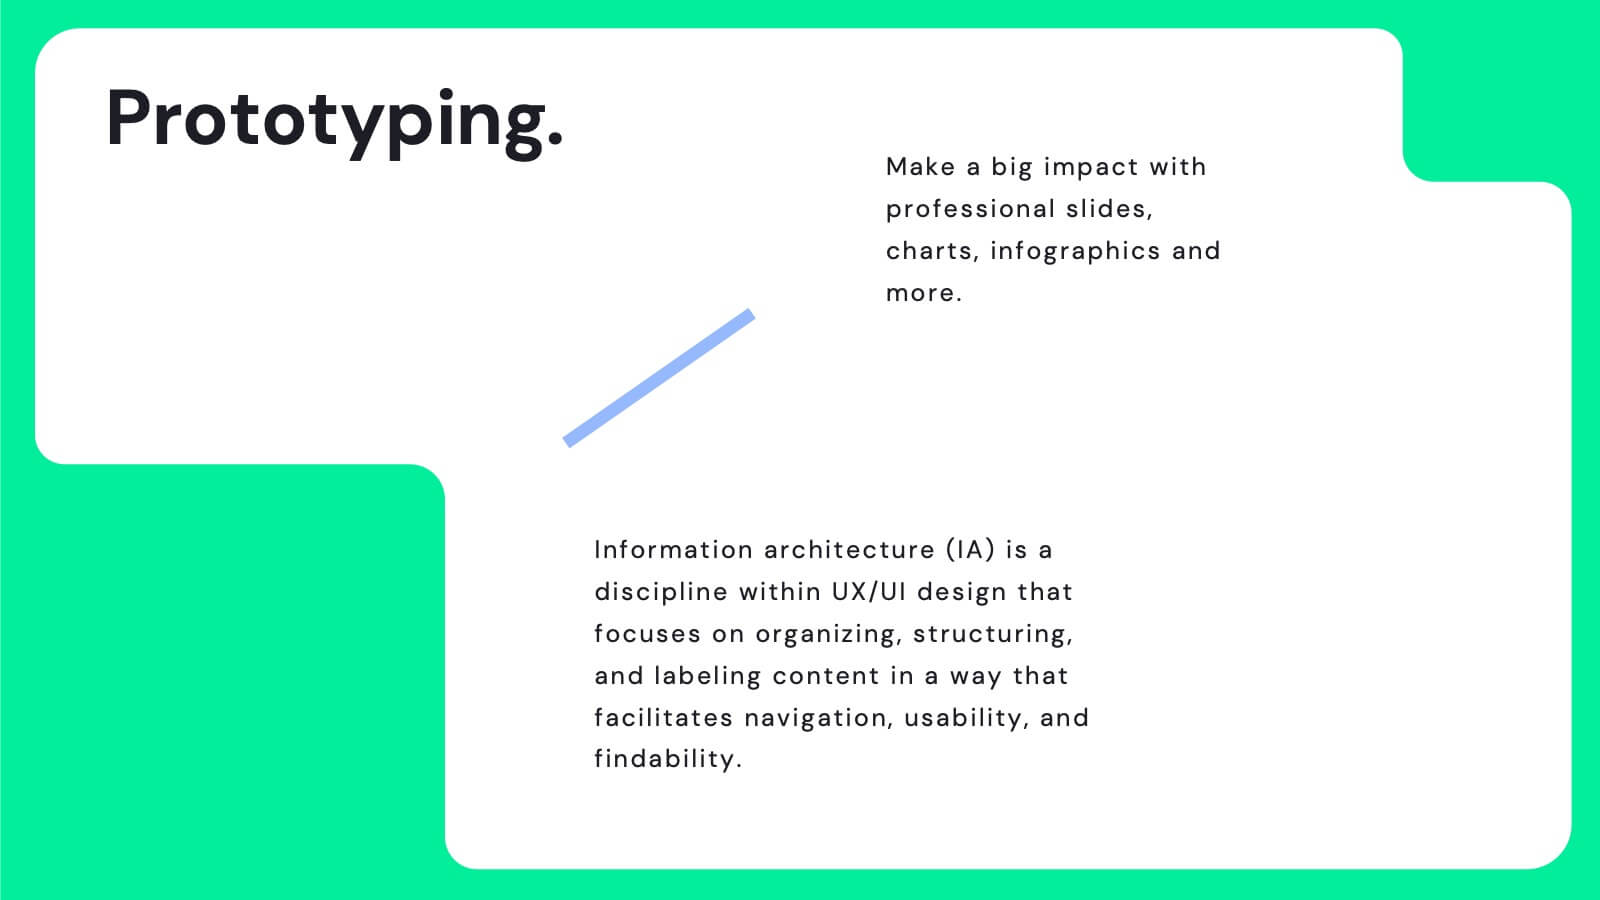
Juno UX Case Study Presentation
Enhance your UX presentations with this sleek, user-friendly template designed for showcasing detailed case studies and user research. With a modern layout and clear sections for user journey mapping, prototyping, and usability guidelines, this template ensures a professional and engaging presentation. Compatible with PowerPoint, Keynote, and Google Slides, it's perfect for any platform.


5 slides
Food Business Pitch Deck Presentation
Bring your food concept to life with a lively, story-driven presentation that highlights flavor, creativity, and business potential. This slide design helps you explain your menu vision, branding approach, and restaurant strategy in a clean and engaging format. Fully compatible with PowerPoint, Keynote, and Google Slides.


6 slides
Empathy to Prototype Framework Presentation
Transform ideas into real-world solutions with a clear, step-by-step framework that connects creativity with action. This presentation helps you visualize each stage of innovation—from understanding users to testing prototypes—in a professional, engaging way. Fully compatible with PowerPoint, Keynote, and Google Slides for effortless customization and presentation.


21 slides
Parthenon Marketing Proposal Template Presentation
Create an impactful marketing proposal with this vibrant and modern presentation template! Covering key sections such as industry overview, consumer behavior, social media strategies, and emerging technologies, it helps you present your marketing insights with style. Fully customizable and perfect for data-driven marketing plans, this template is compatible with PowerPoint, Keynote, and Google Slides for seamless presentation delivery.


5 slides
Behavioral Psychology in the Workplace Presentation
Boost employee engagement and team dynamics with the Behavioral Psychology in the Workplace Presentation. This slide deck is designed to help HR leaders, managers, and consultants visualize psychological insights that shape workplace behavior. Use it to present motivation theories, behavioral models, or communication styles. Fully editable in Canva, PowerPoint, Google Slides, and Keynote.


10 slides
Corporate Business Plan Strategy Presentation
Present your strategy with professionalism using this Corporate Business Plan slide. Designed with a handshake graphic and clean icon-labeled sections, this layout is ideal for showcasing four key pillars—such as partnerships, operations, goals, and performance. Each title is fully editable, helping you keep your message clear and concise. Compatible with PowerPoint, Keynote, and Google Slides.