


Features
- 5 Unique slides
- Fully editable and easy to edit in Microsoft Powerpoint, Keynote and Google Slides
- 16:9 widescreen layout
- Clean and professional designs
- Export to JPG, PDF or send by email


Do you have any questions?
Recommend


22 slides
Galvonic Research Proposal Presentation
Present research insights professionally with this comprehensive proposal template. Covering objectives, methodology, findings, and implications, it provides a clear structure for academic or market research projects. Compatible with PowerPoint, Keynote, and Google Slides, it’s ideal for presenting detailed analysis, conclusions, and future directions.


22 slides
SEO Report Presentation
Optimize your SEO strategies using our comprehensive SEO Report template. It includes sections for keyword performance, market trends, competitor insights, and client feedback. Tailored for digital marketers and SEO specialists, this template supports presentations in PowerPoint, Keynote, and Google Slides.


6 slides
Business Model Hexagon Infographic Presentation
Break down complex strategies with the Business Model Hexagon Infographic Presentation. This sleek, six-part hexagonal layout is perfect for illustrating interconnected components like operations, value propositions, and customer segments. Fully editable and easy to customize in PowerPoint, Keynote, or Google Slides—ideal for startups, consultants, and corporate teams.


4 slides
Root Cause Problem Solving Presentation
Uncover insights with a clear, visual approach that makes complex issues easy to understand and communicate. This presentation guides audiences through identifying underlying problems, mapping causes, and highlighting solutions in a structured, memorable way. Clean icons and tree-based visuals keep your message engaging. Fully compatible with PowerPoint, Keynote, and Google Slides.


20 slides
Uplift Content Marketing Pitch Deck Presentation
This content marketing presentation is designed to elevate your strategies to the next level! It covers everything from industry insights to the latest consumer behavior trends and SEO strategies. It helps streamline influencer marketing, data-driven approaches, and even includes sustainability in marketing. Perfect for PowerPoint, Keynote, and Google Slides presentations!


7 slides
Pillar Distribution Infographic
Discover a striking visual representation of data with the pillar distribution Infographic. Bathed in shades of blue, white, and green, this template masterfully showcases the core foundations of any topic in a 'pillar' format. Specifically tailored for business analysts, educators, and marketers, the infographic aids in simplifying dense information. With its crisp graphics, bespoke icons, and dedicated image placeholders, conveying your insights becomes an engaging narrative experience. Its versatility ensures smooth integration with PowerPoint, Keynote, and Google Slides, transforming any presentation into a captivating visual story.


6 slides
Creative Alphabetic Infographic
Bring your message to life with a bright, alphabet-inspired layout that turns simple letters into eye-catching storytelling elements. This presentation is perfect for organizing steps, categories, or key ideas in a memorable way while keeping everything clear and structured. Fully editable and compatible with PowerPoint, Keynote, and Google Slides.


21 slides
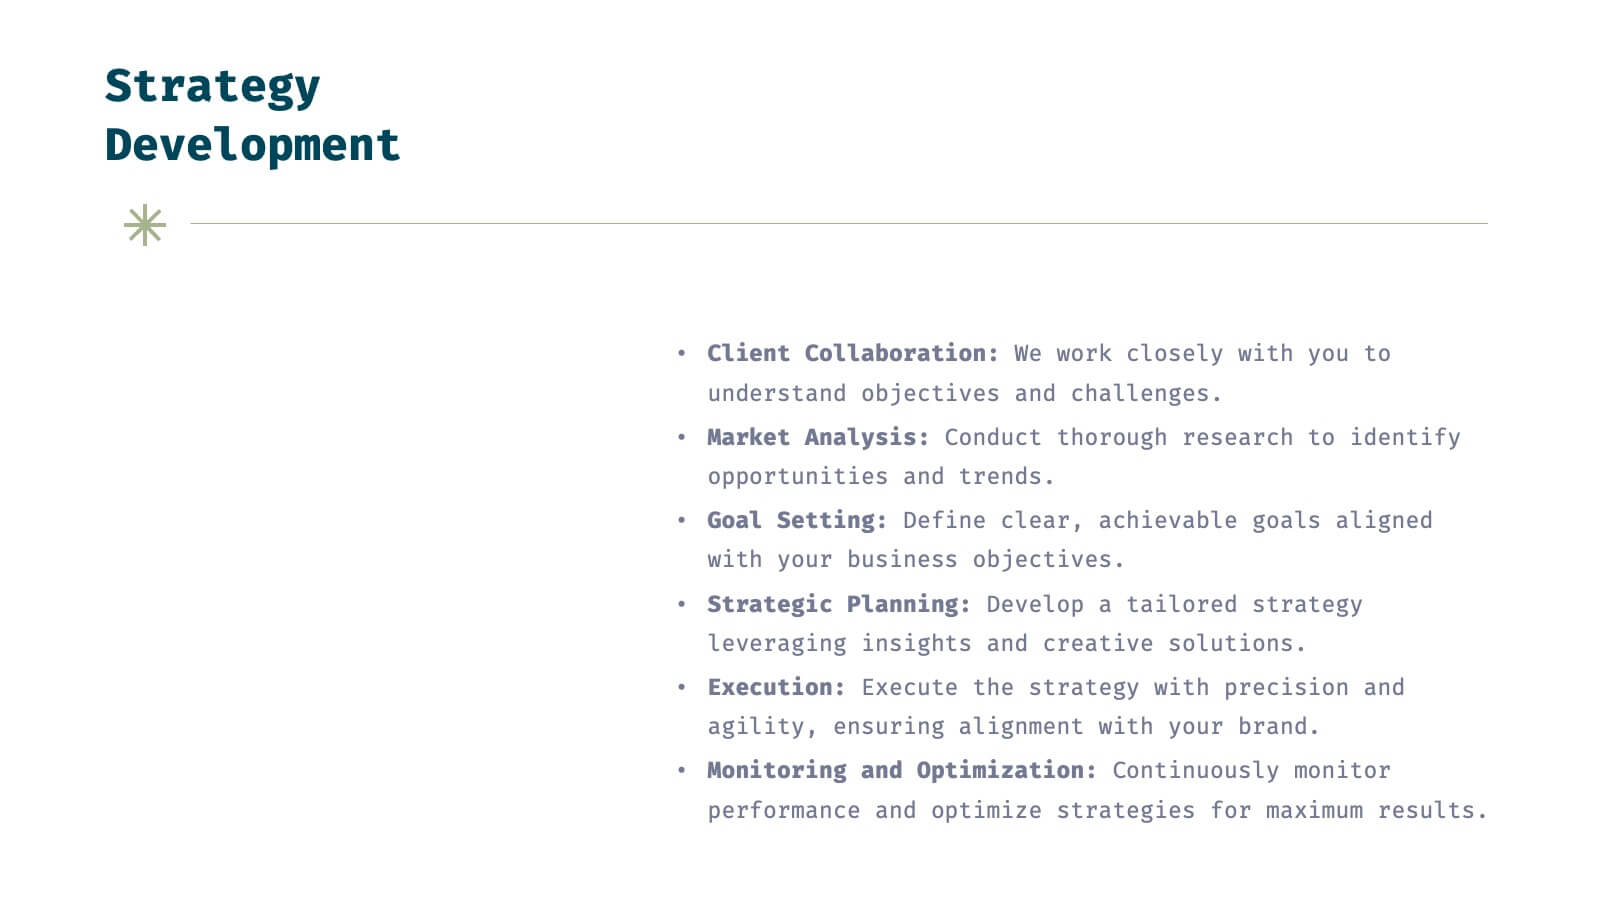
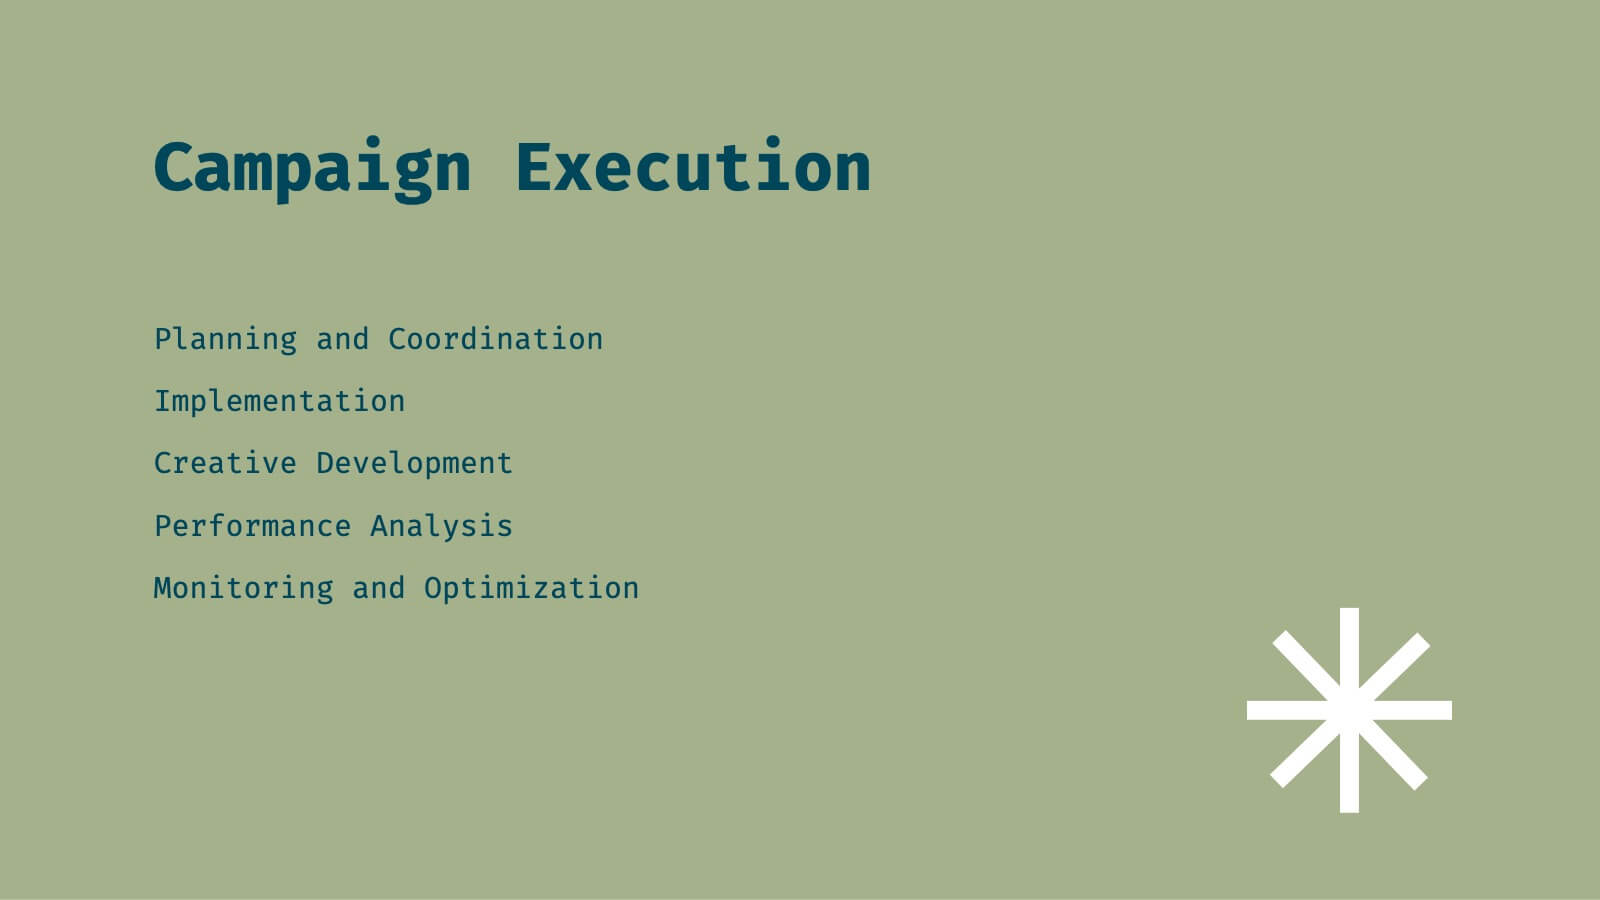
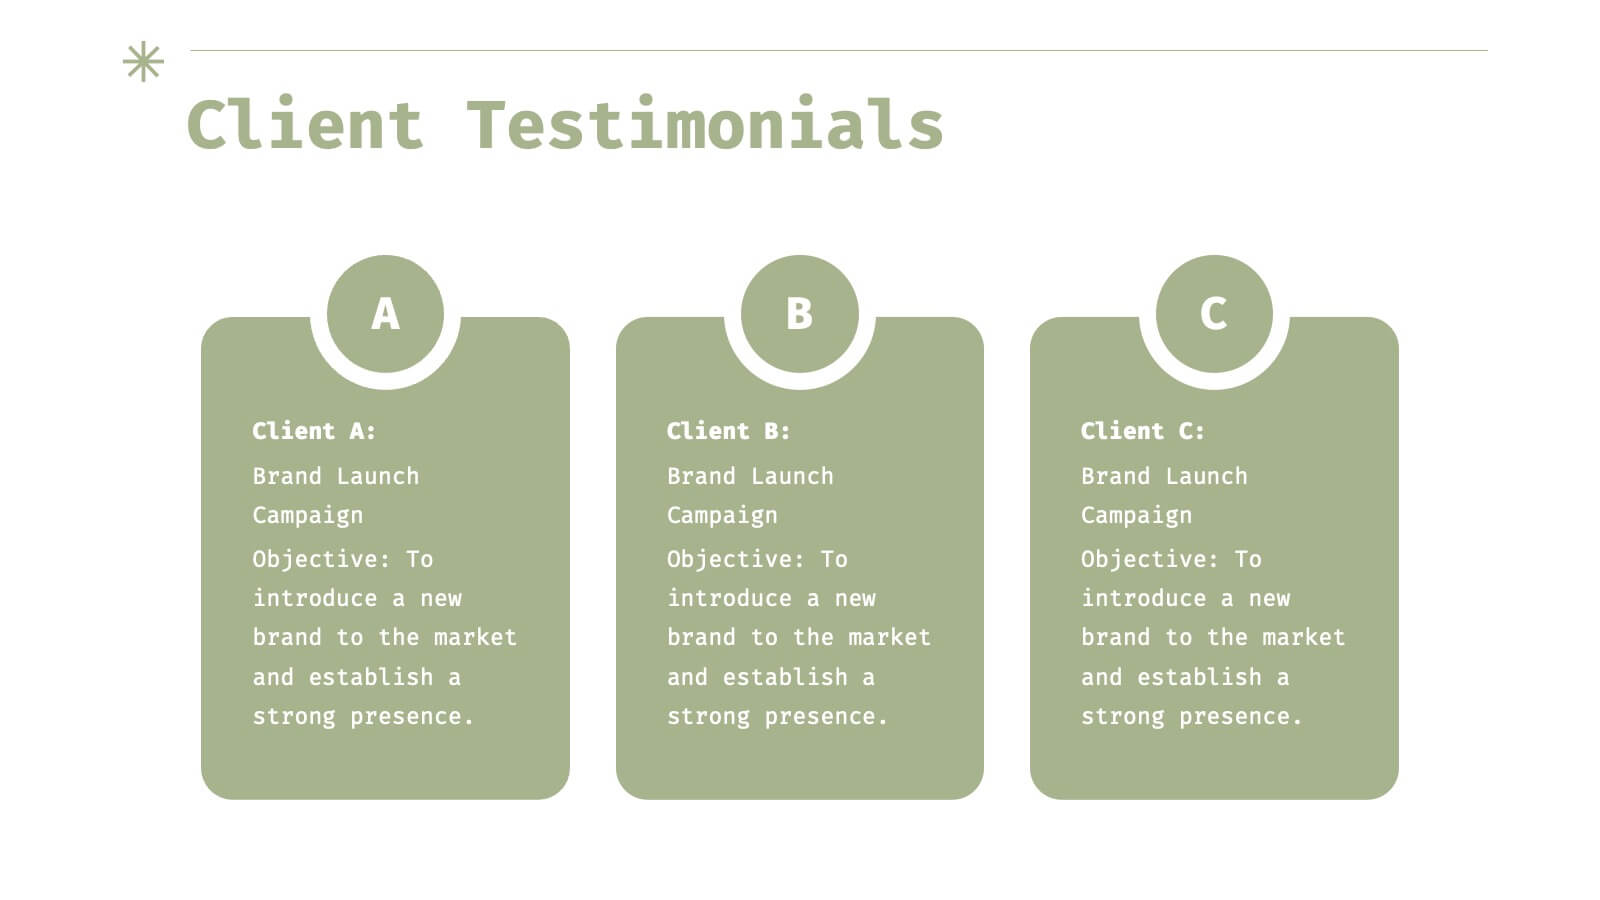
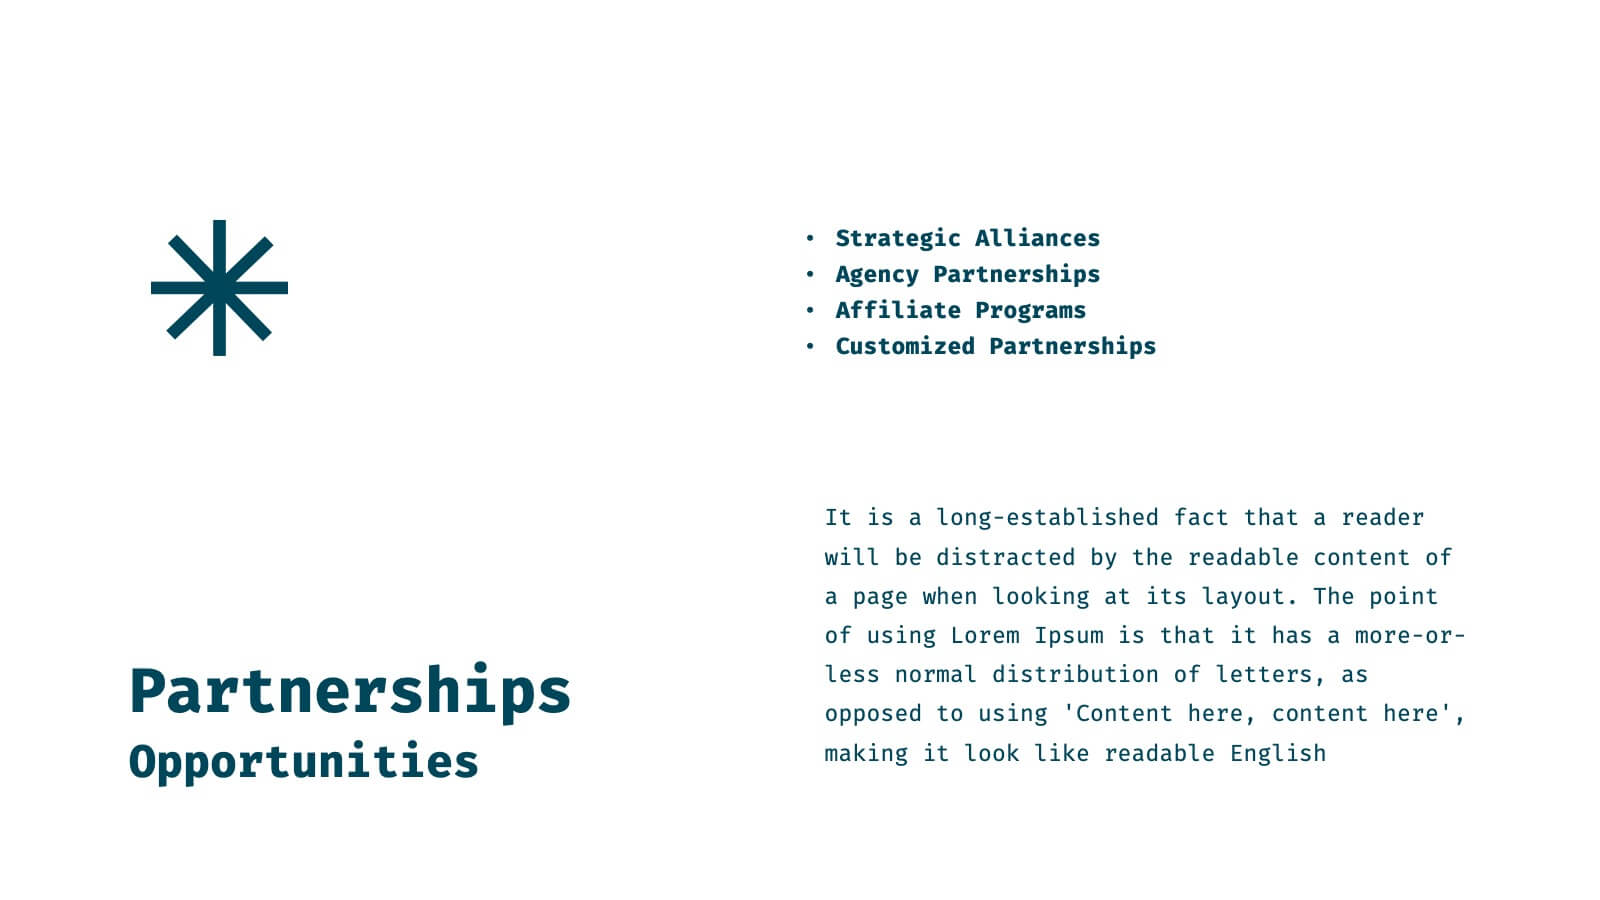
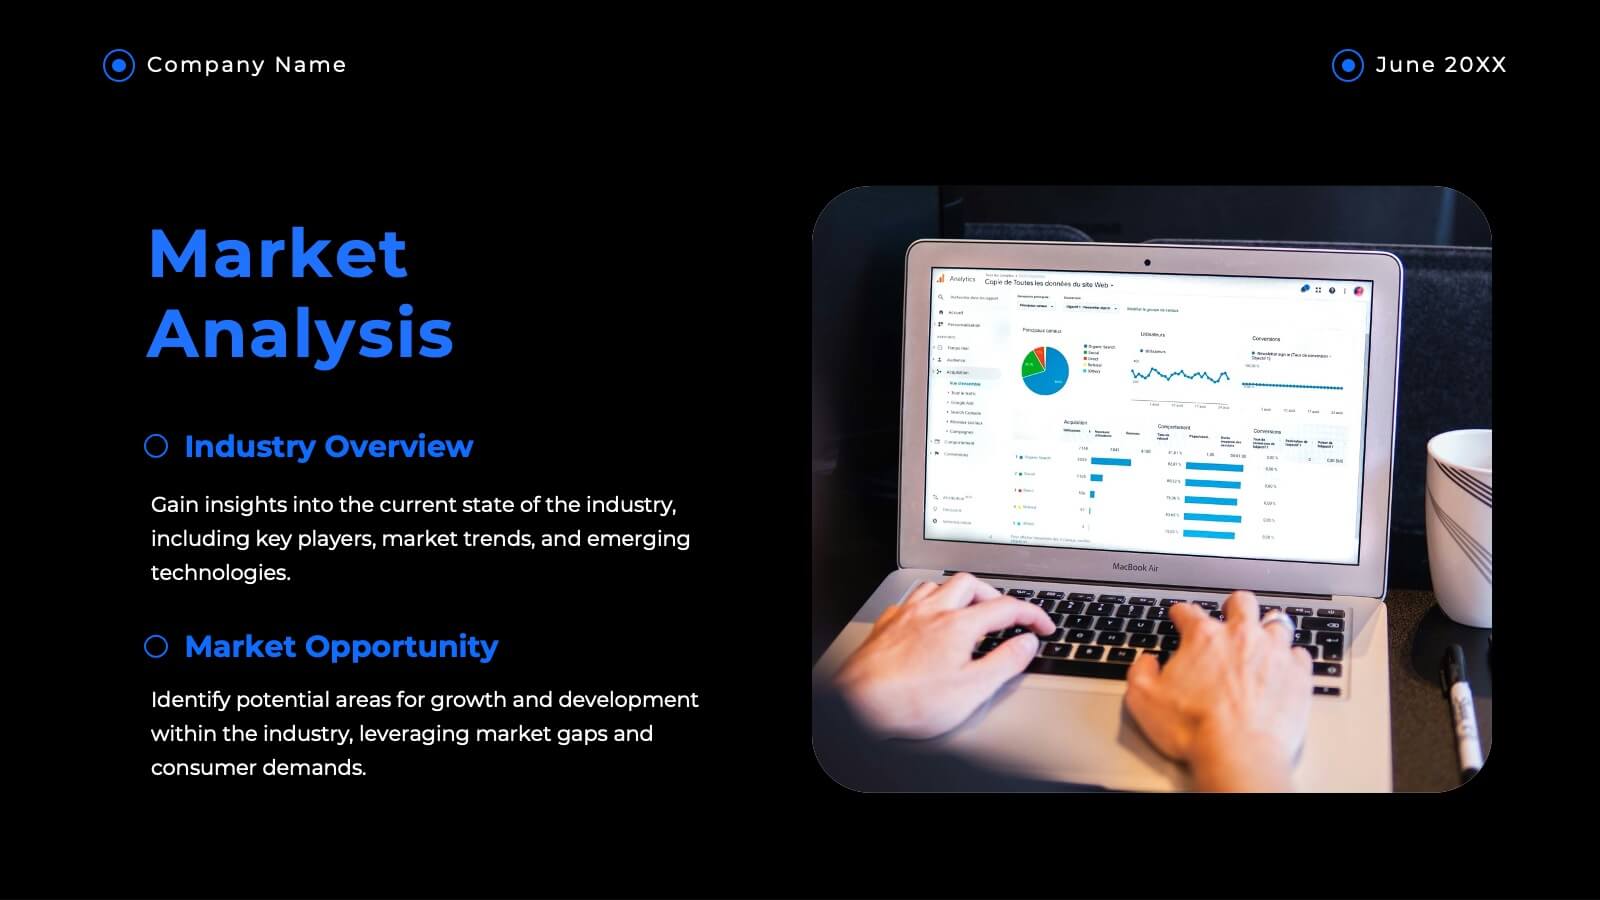
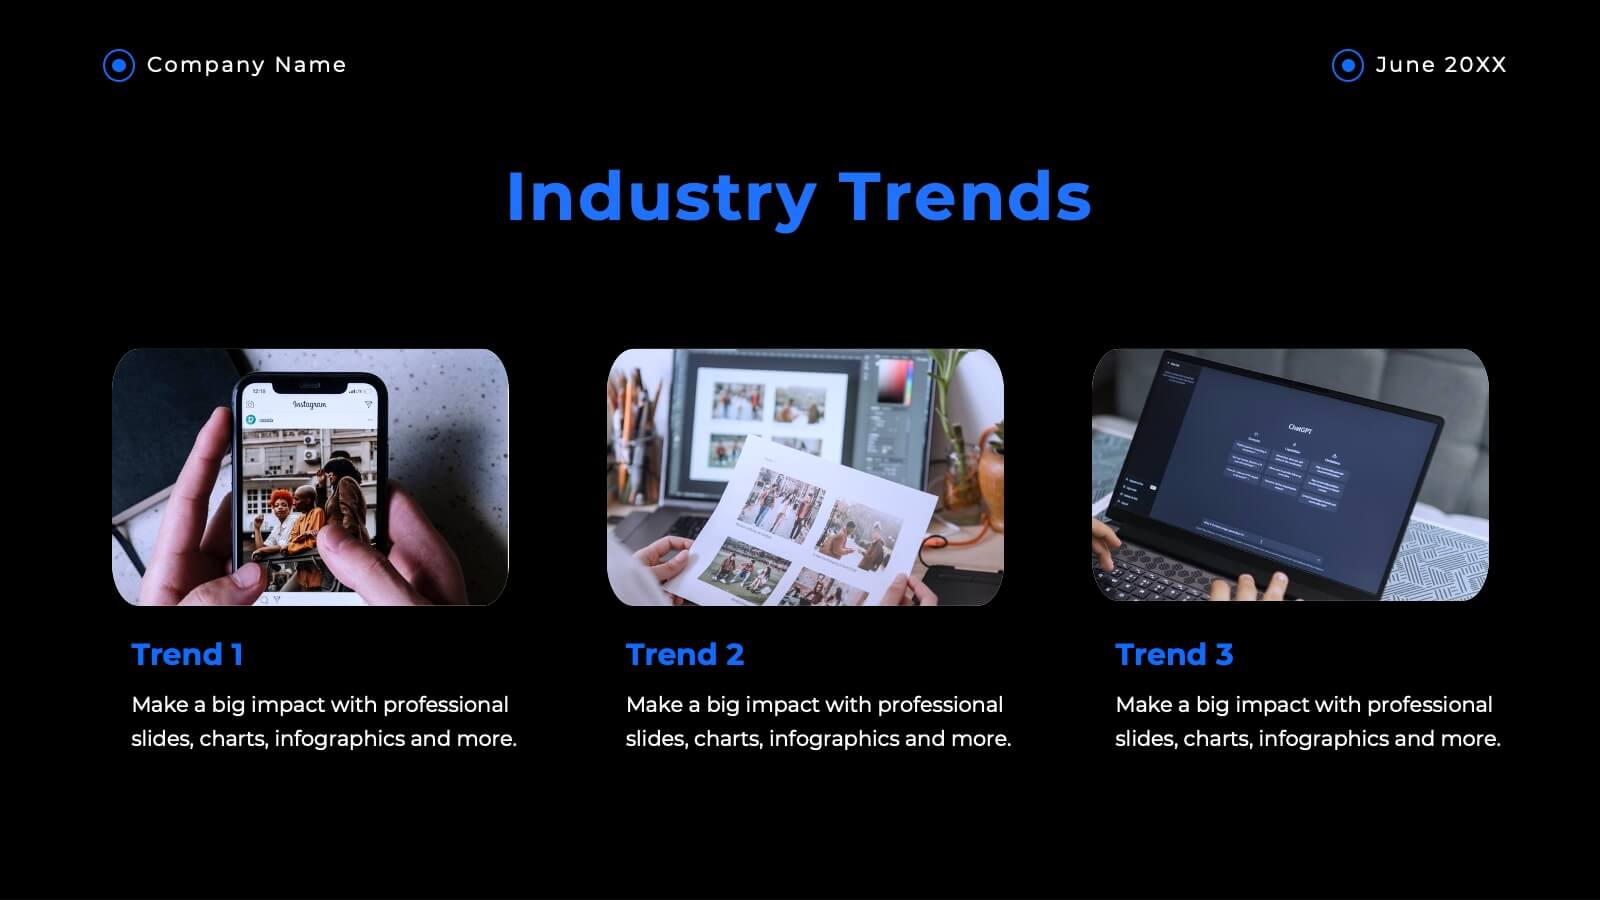
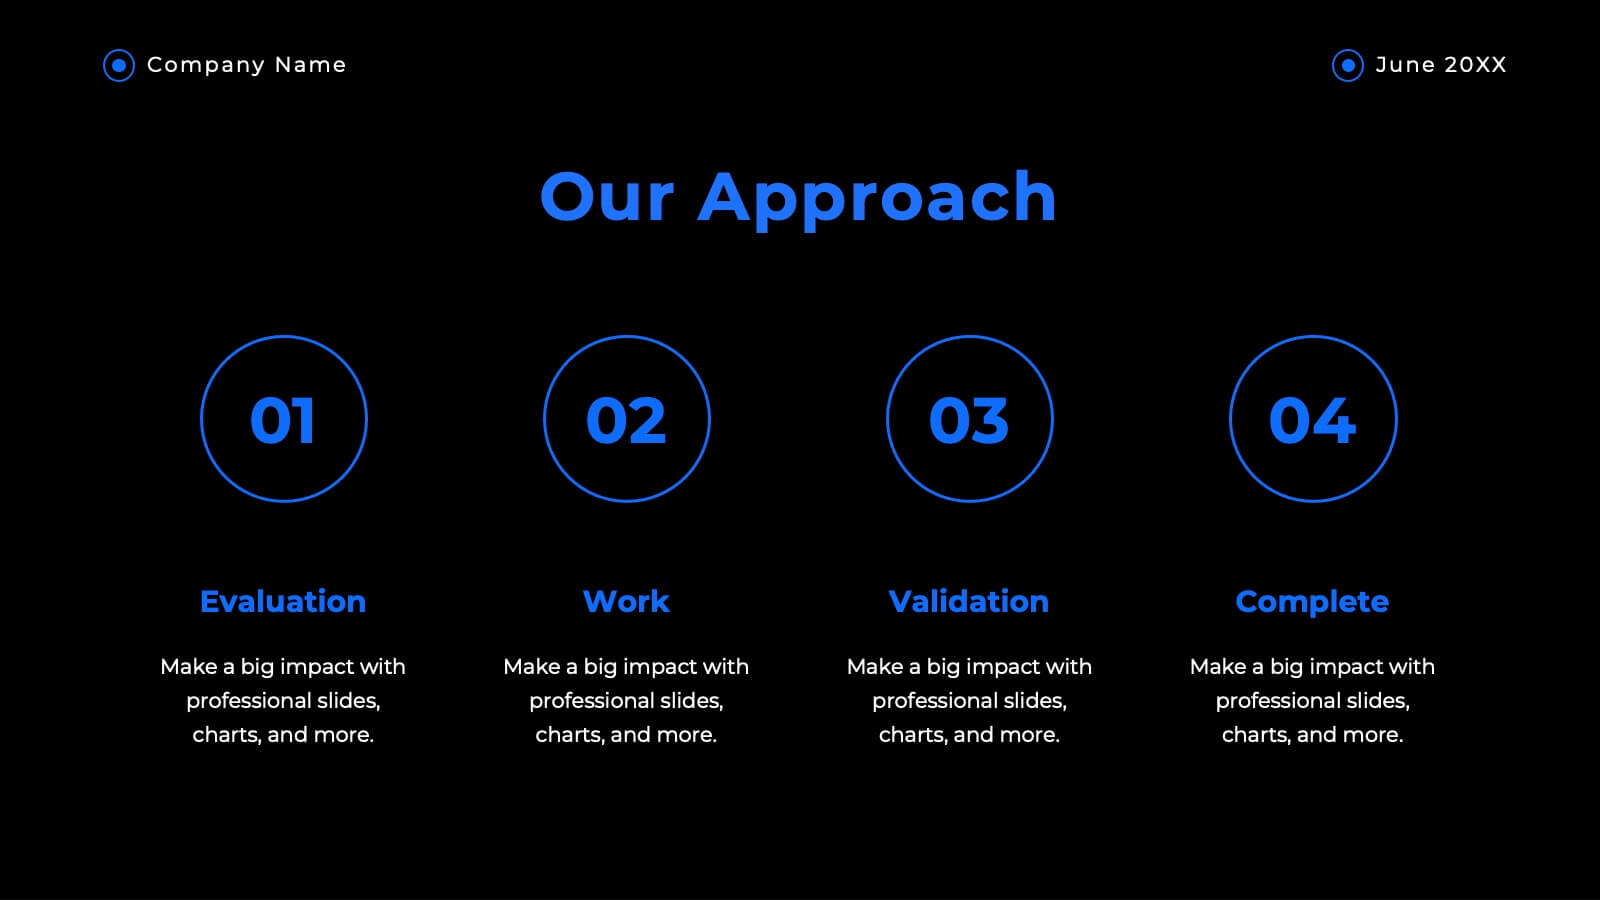
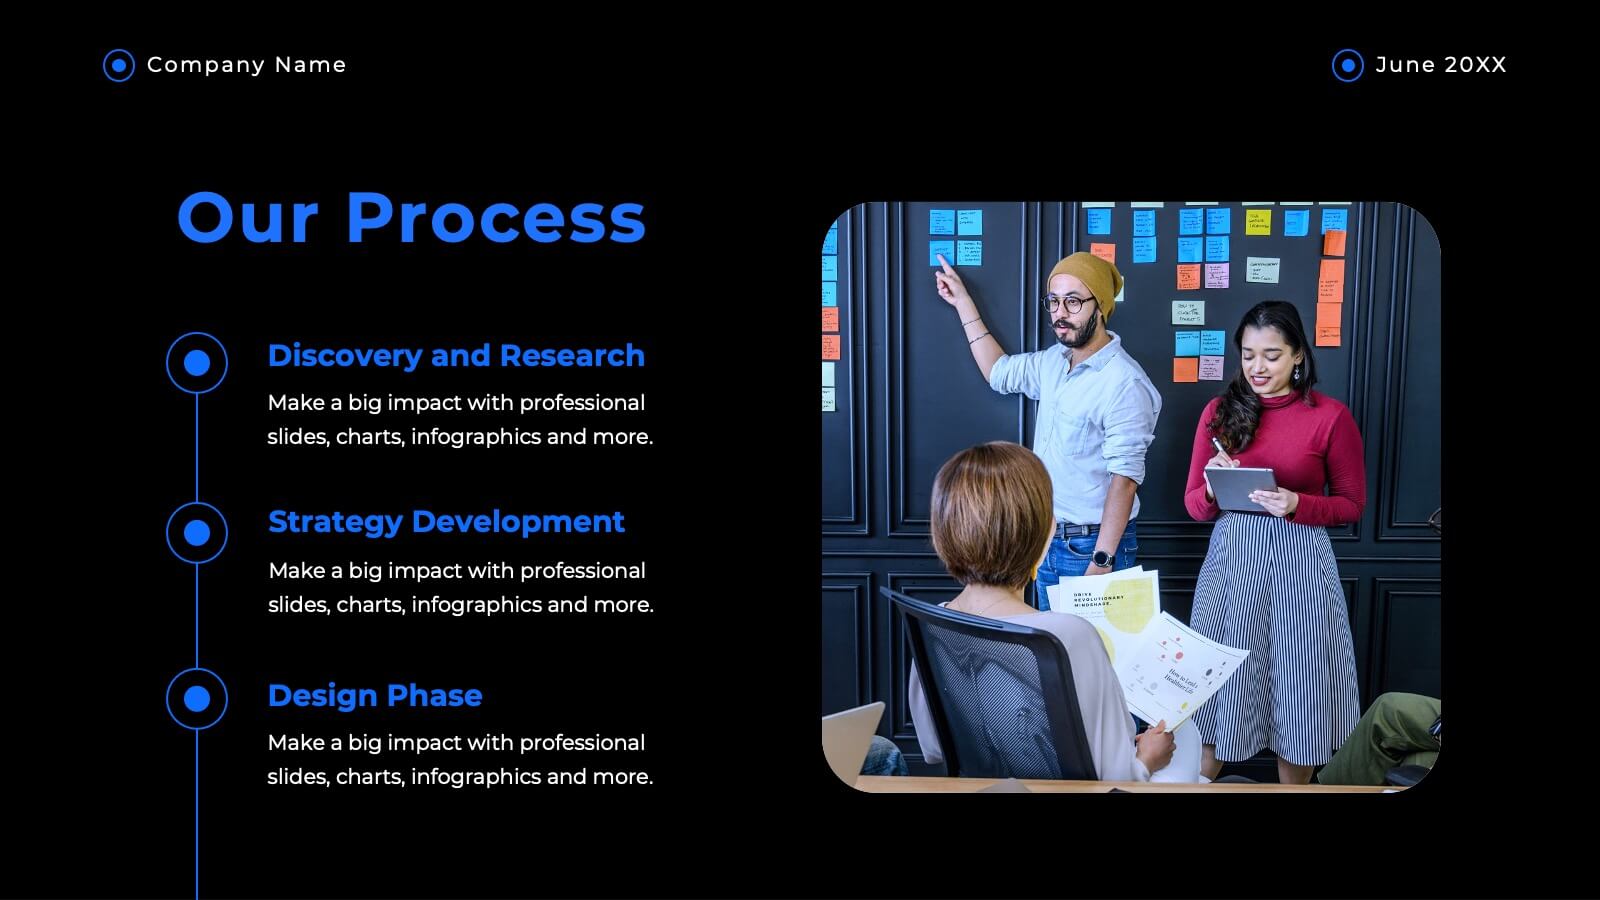
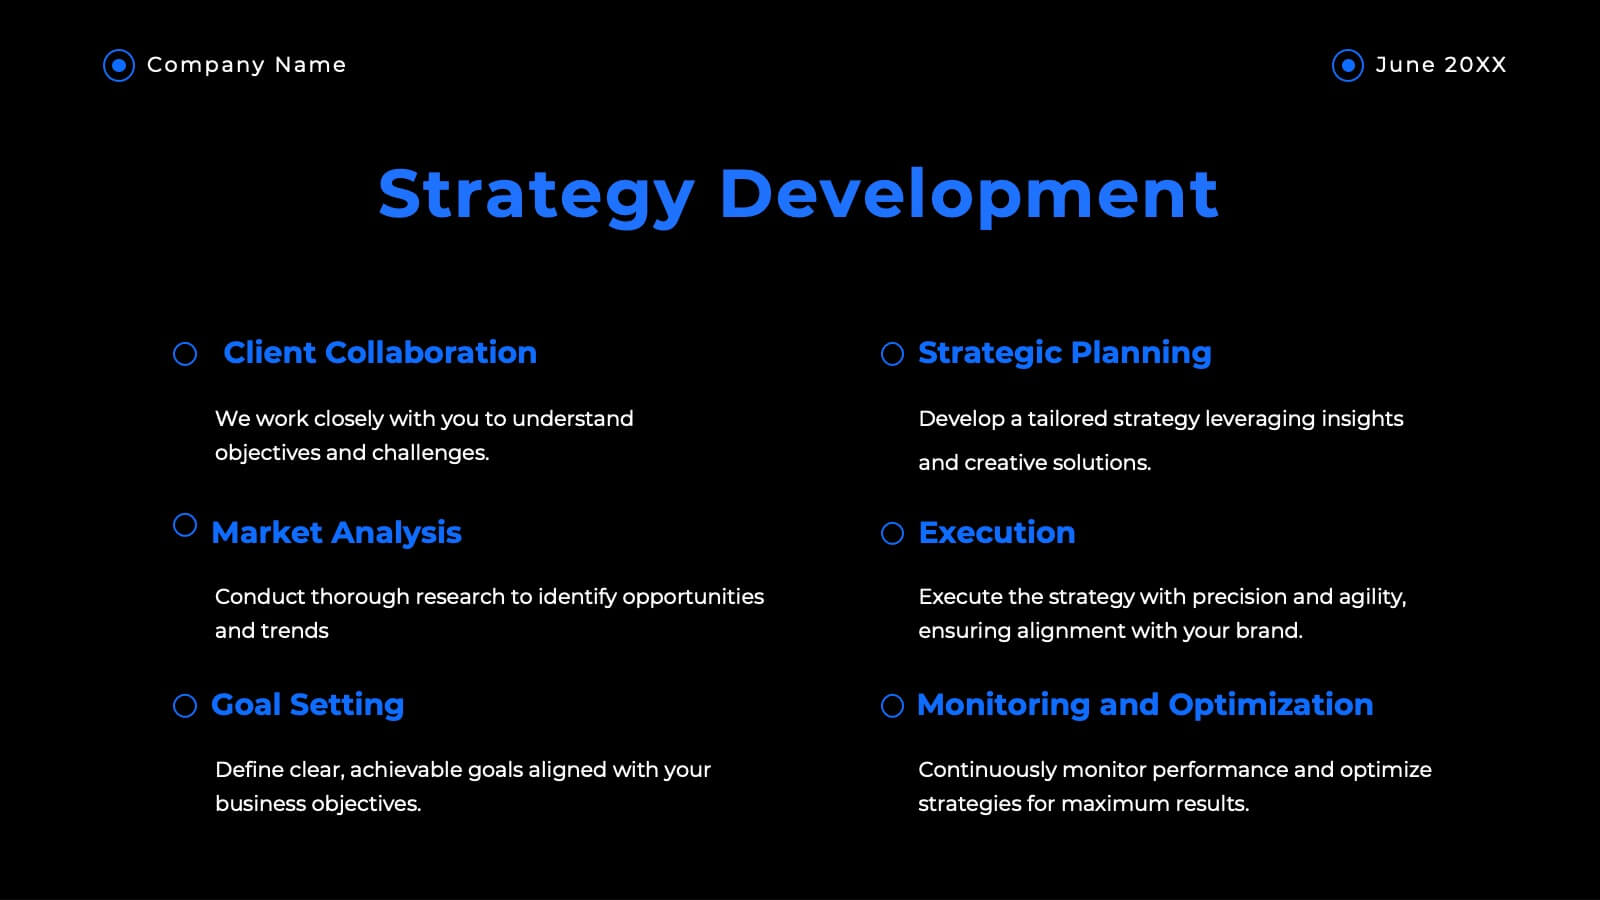
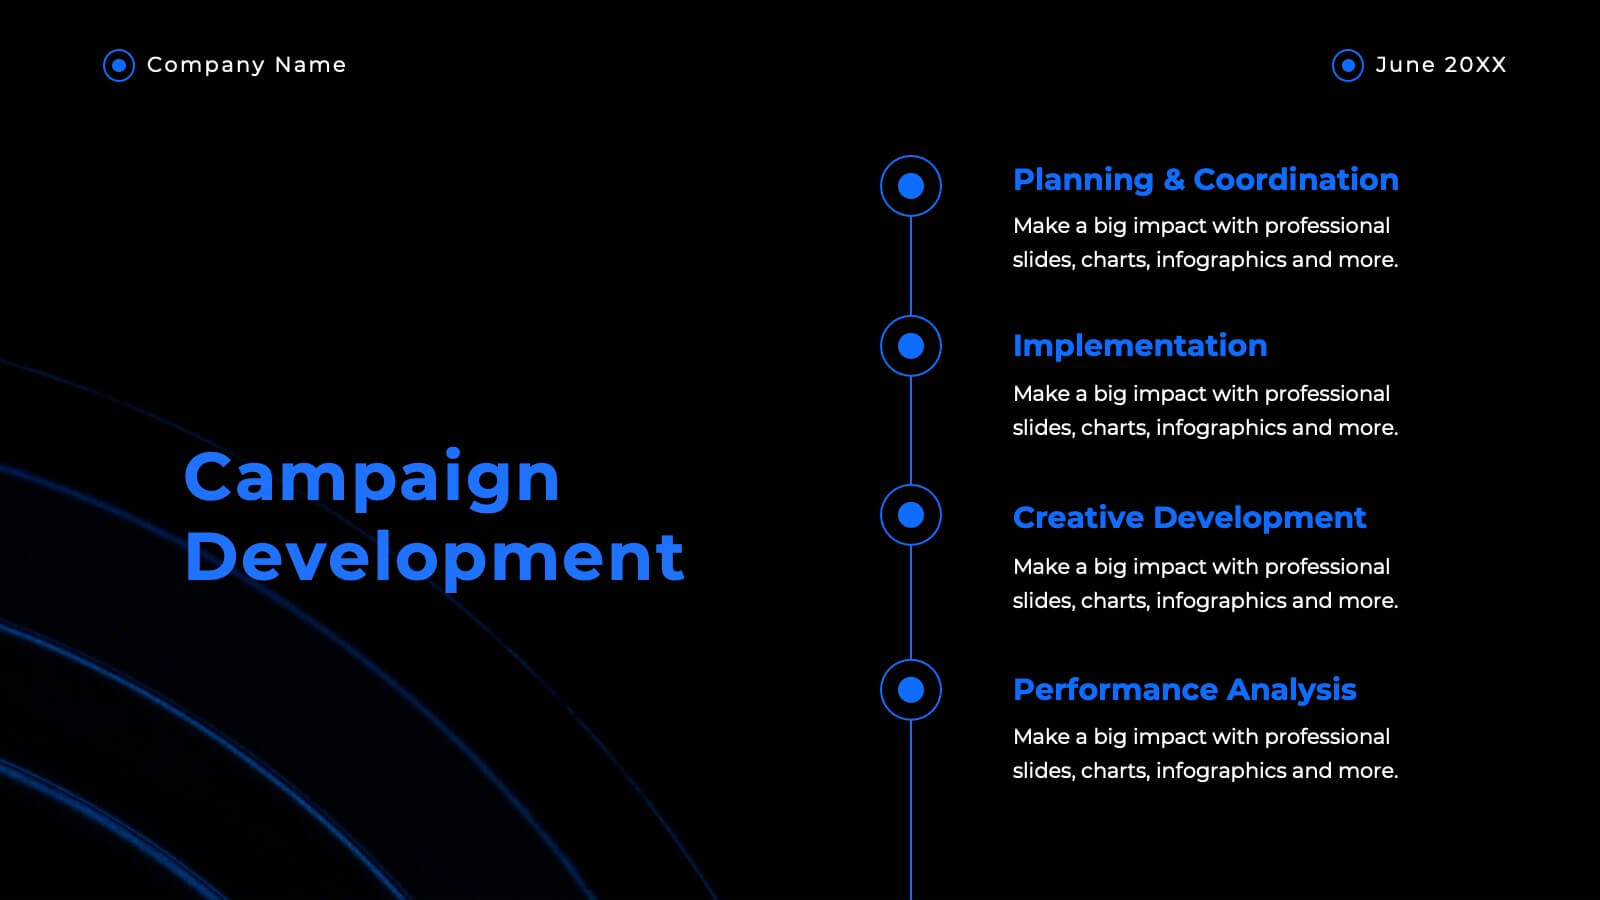
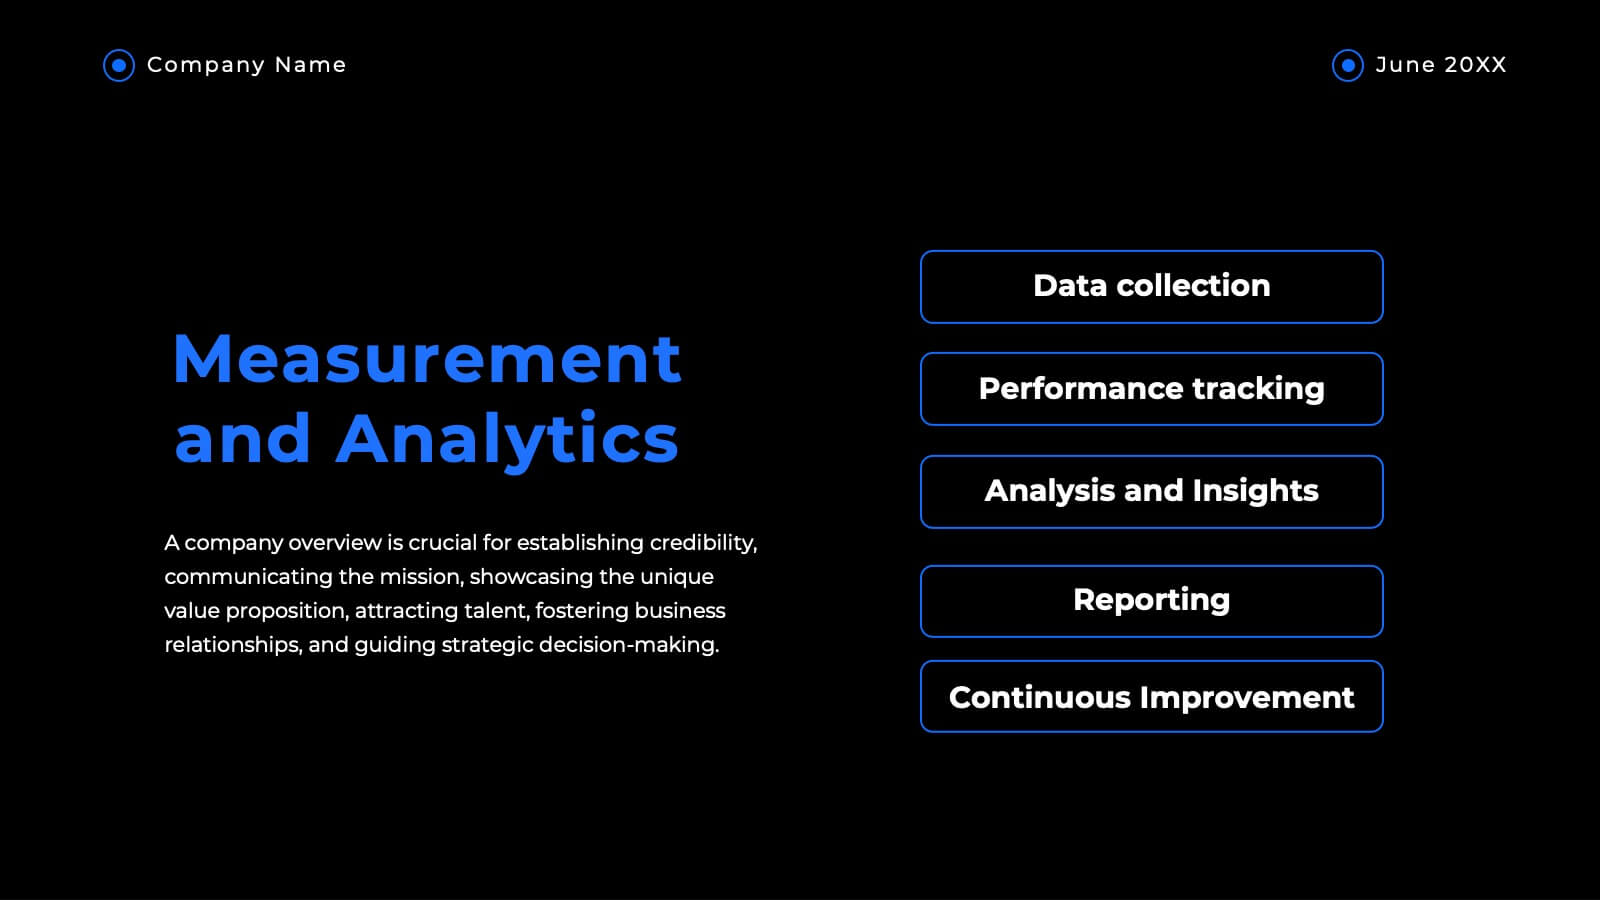
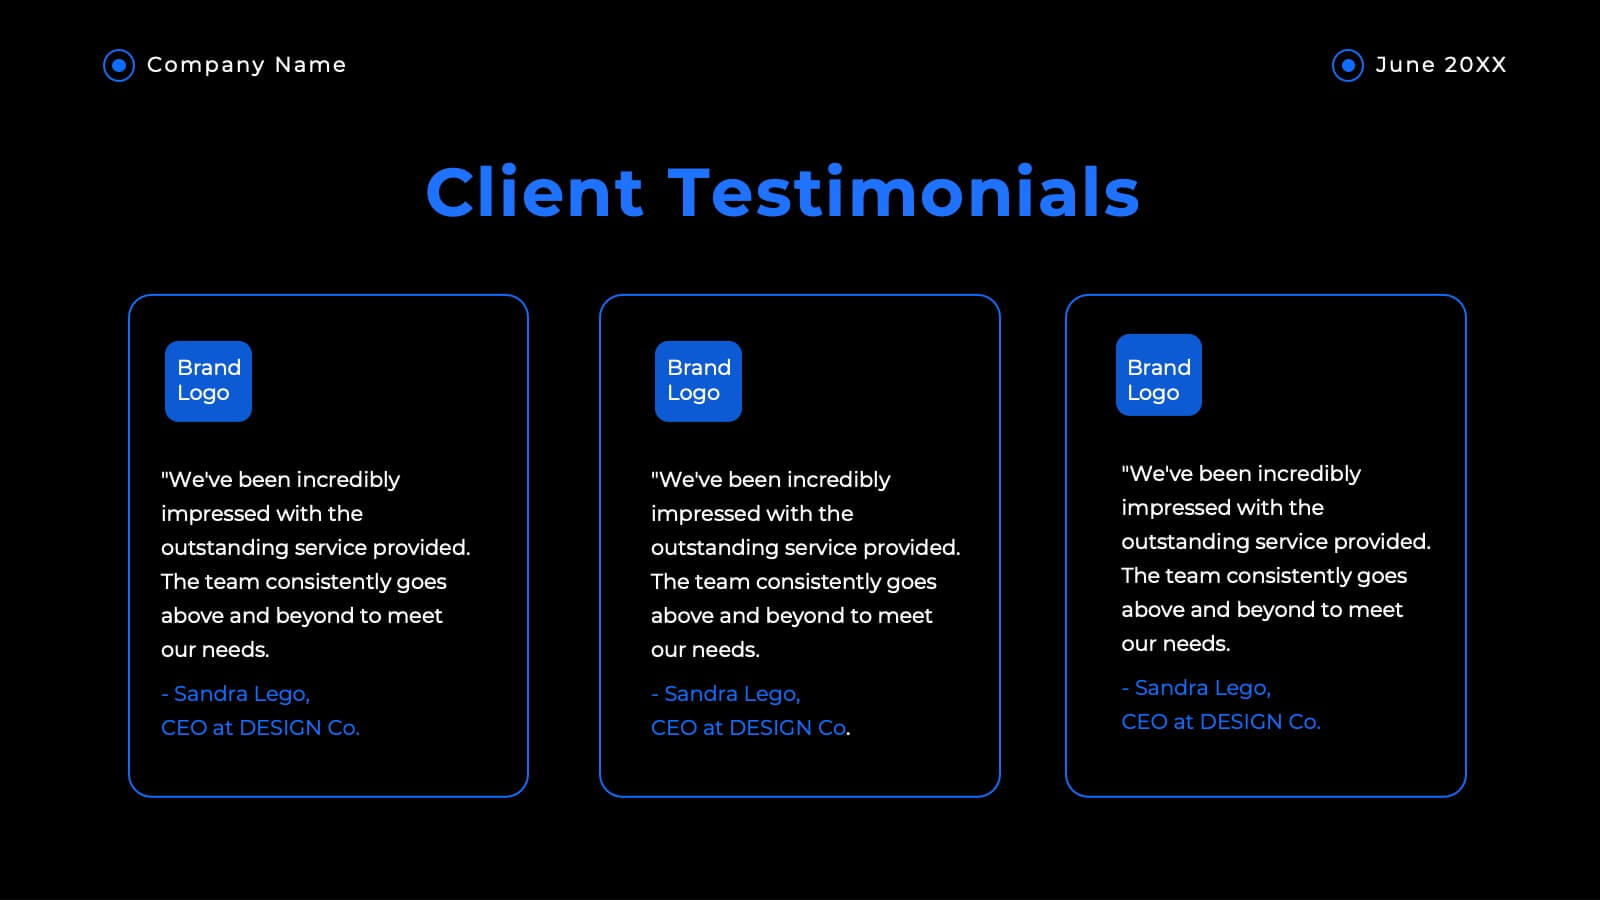
Helix Full-Service Agency Project Plan Presentation
Showcase your agency's expertise with this sophisticated, minimalistic presentation template. Designed to present comprehensive market analysis, strategy development, and client success stories, this template ensures your agency's capabilities are clearly communicated. Its clean design and professional layout make it perfect for building trust and credibility. Compatible with PowerPoint, Keynote, and Google Slides, it's versatile for any platform.


6 slides
Business Task and To-Do List Slide
Organize tasks with clarity using this colorful checklist-style layout, perfect for showcasing priorities, timelines, or team responsibilities. With six editable sections and engaging icons, this layout brings structure and visual appeal to business updates or project meetings. Fully customizable in PowerPoint, Keynote, and Google Slides.
4 slides
Arrow Path Business Journey Presentation
Visualize growth, decisions, and direction with the Arrow Path Business Journey Presentation. This dynamic slide is designed to illustrate key stages, multiple outcomes, or strategic forks in the road. Great for showing parallel team tracks, phased development, or transformation journeys. Fully editable and works seamlessly in PowerPoint, Google Slides, and Canva.


5 slides
Large-Scale Data Strategy Template Presentation
Present your data strategy with clarity using this four-step triangle layout. Each triangle highlights a key phase, ideal for outlining processes like planning, cloud adoption, integration, and scalability. Clean icons and a modern design enhance communication. Fully editable and compatible with PowerPoint, Keynote, and Google Slides for flexible use.


21 slides
Manticore Financial Report Presentation
This financial report template features a sleek, modern design for presenting key highlights, performance metrics, and financial summaries. It includes sections for market trends, competitor insights, and strategic initiatives. Fully customizable and compatible with PowerPoint, Keynote, and Google Slides, it's perfect for delivering impactful financial presentations with clarity and style.
22 slides
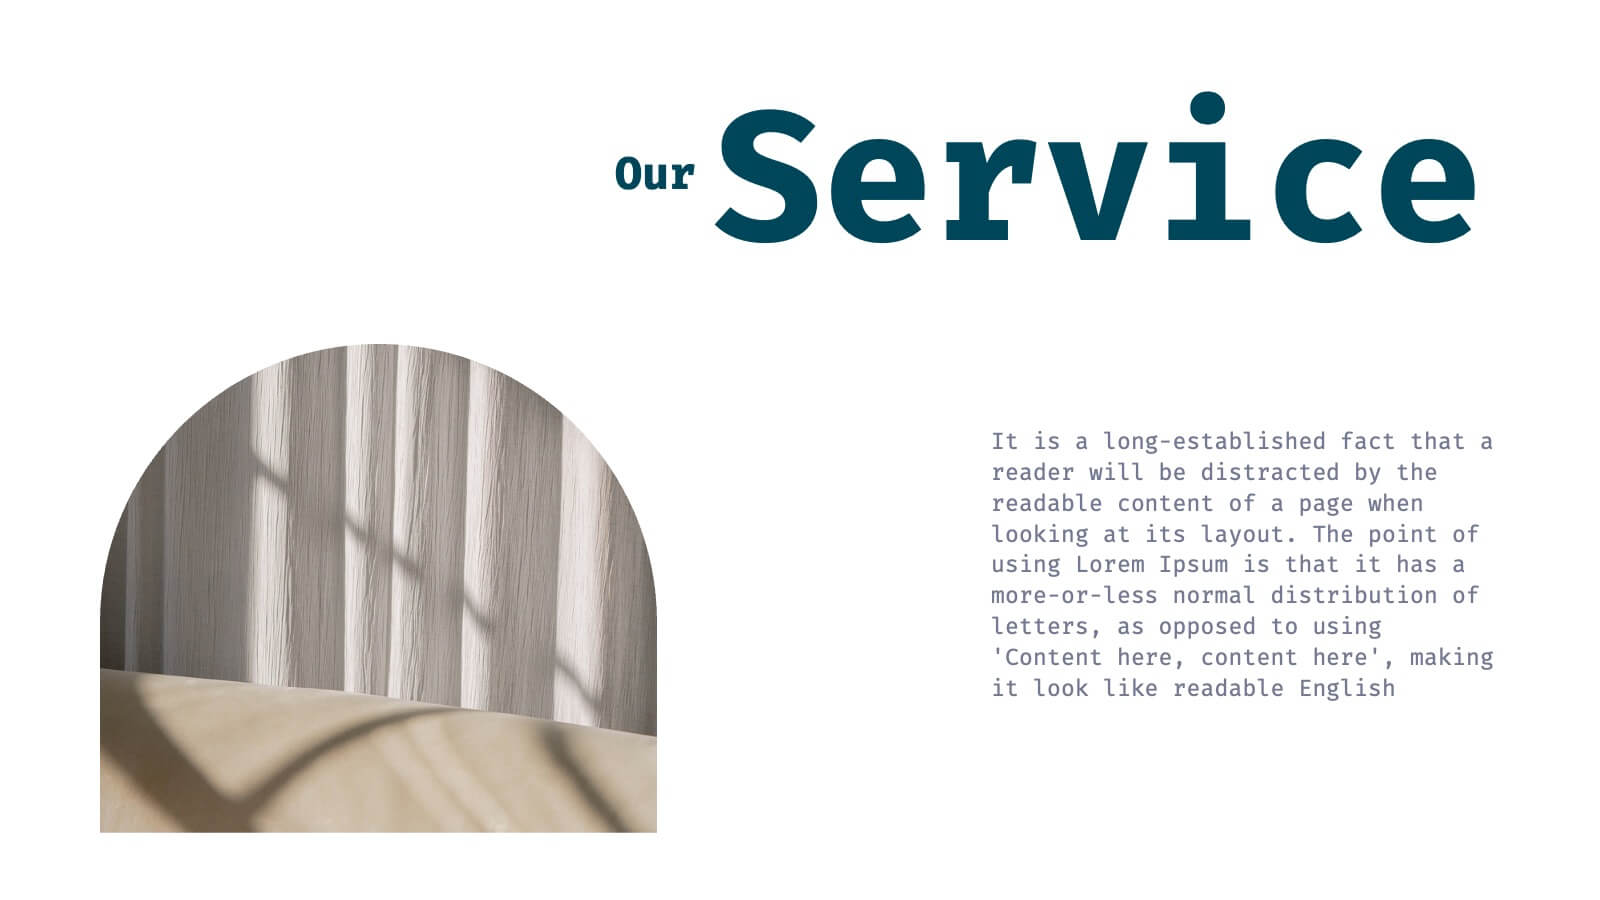
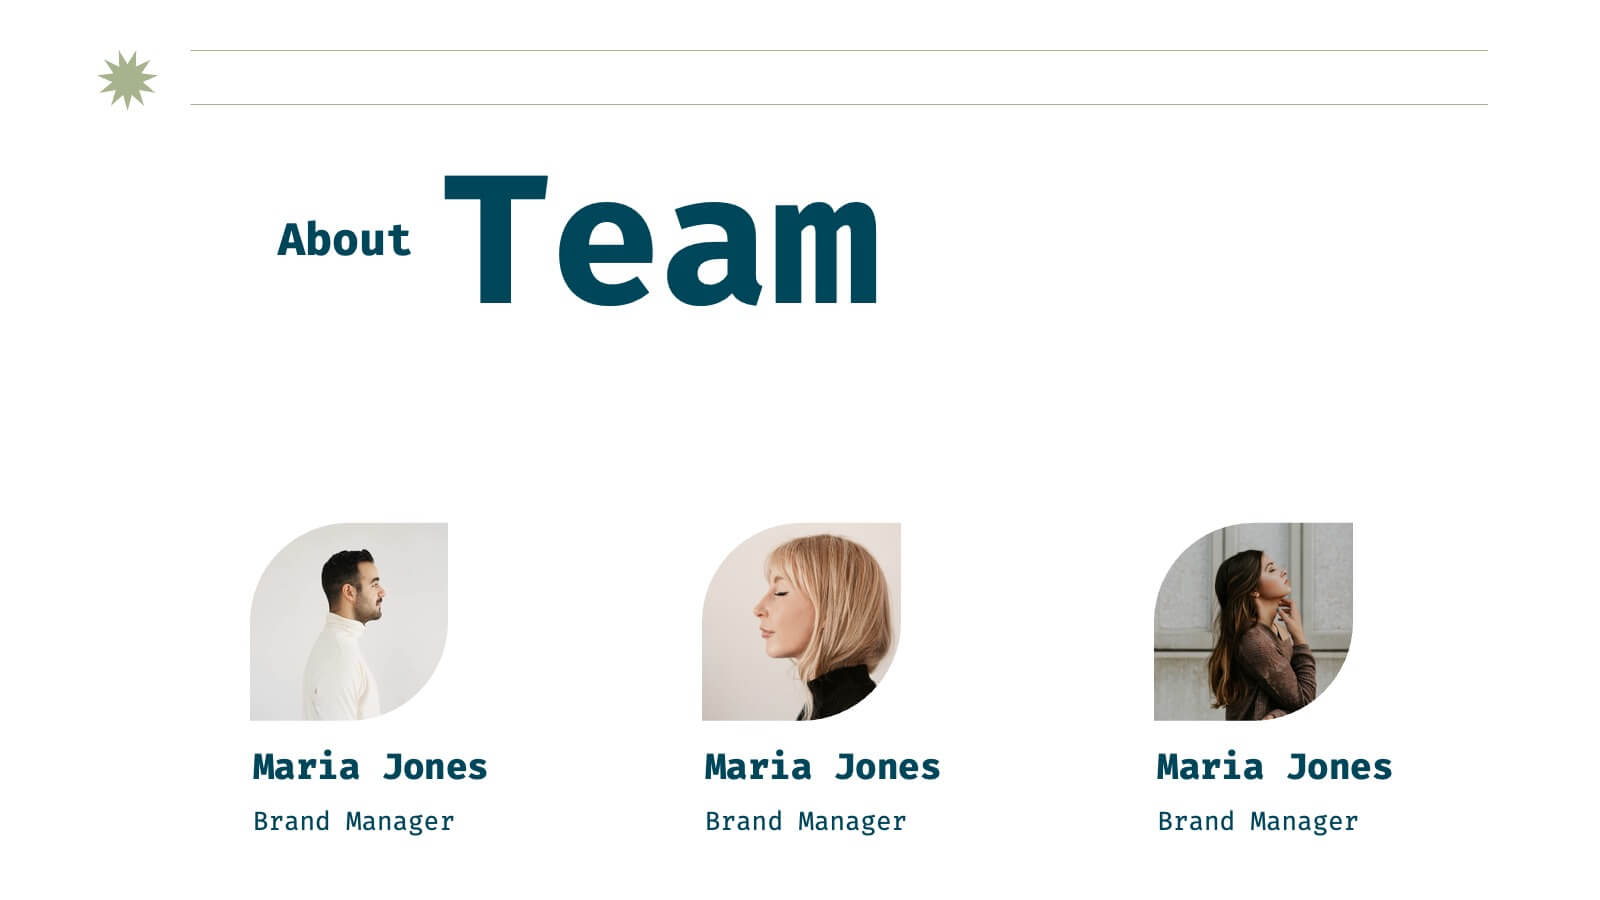
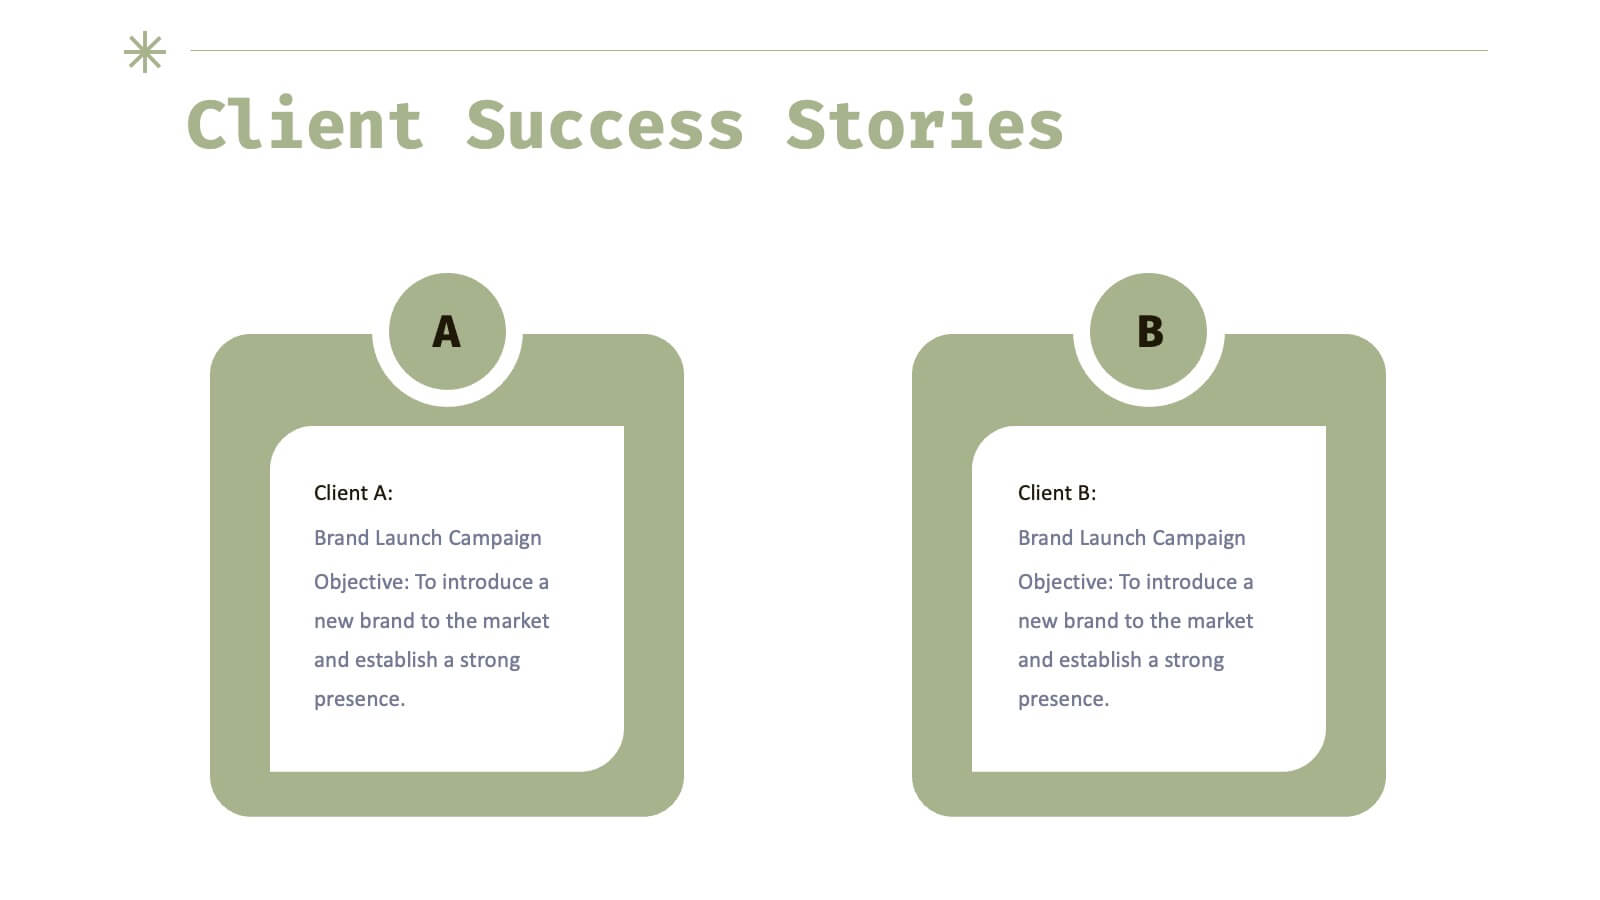
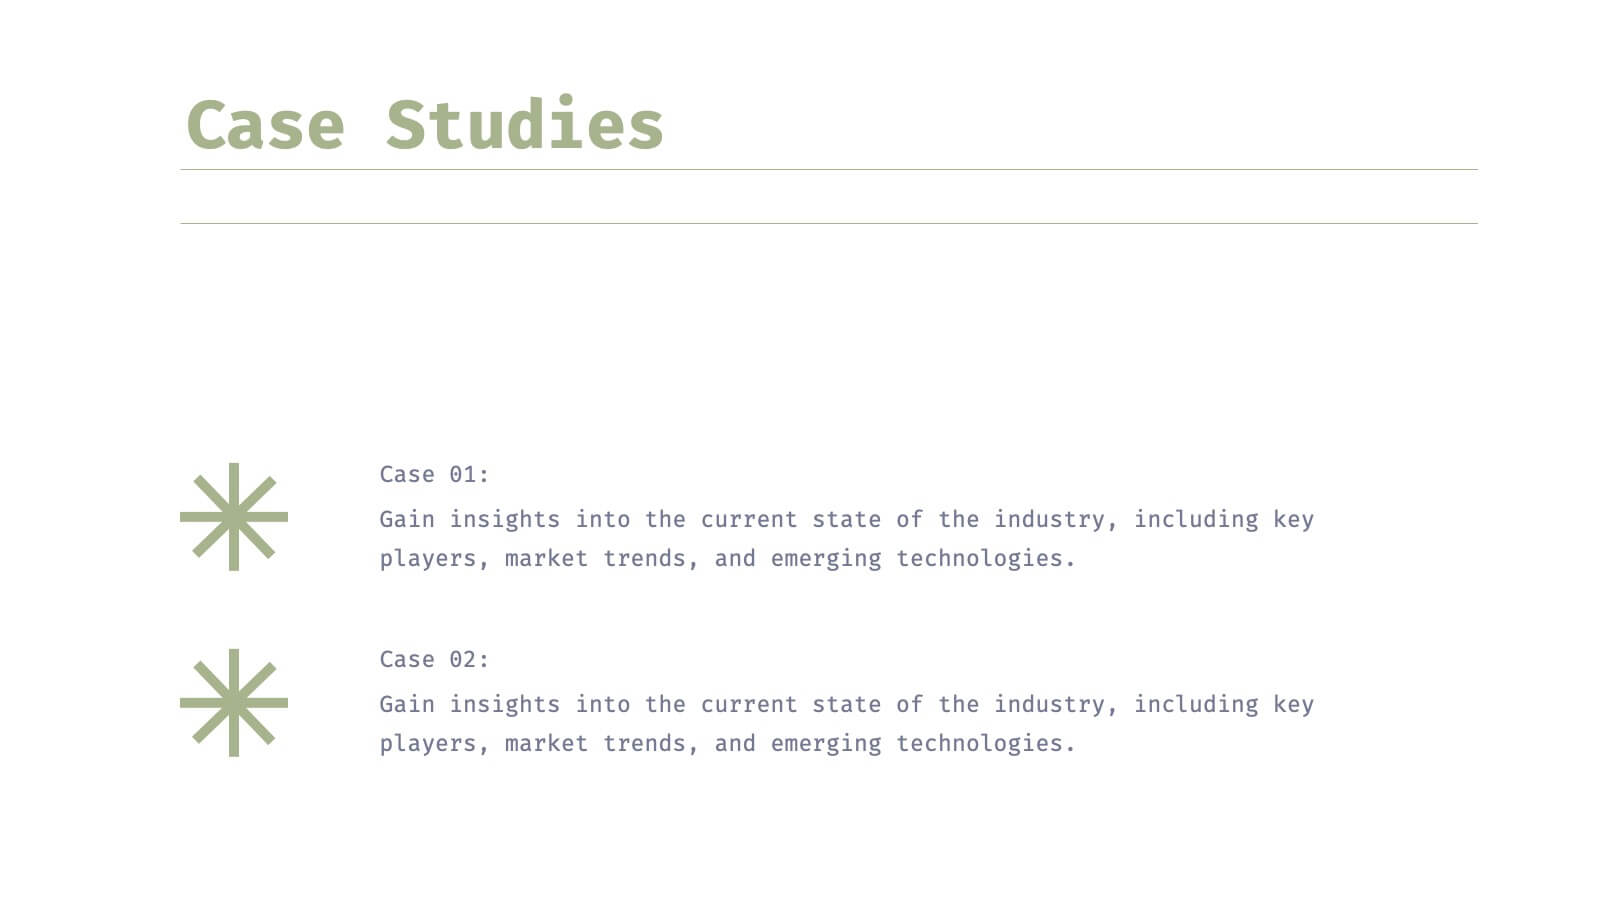
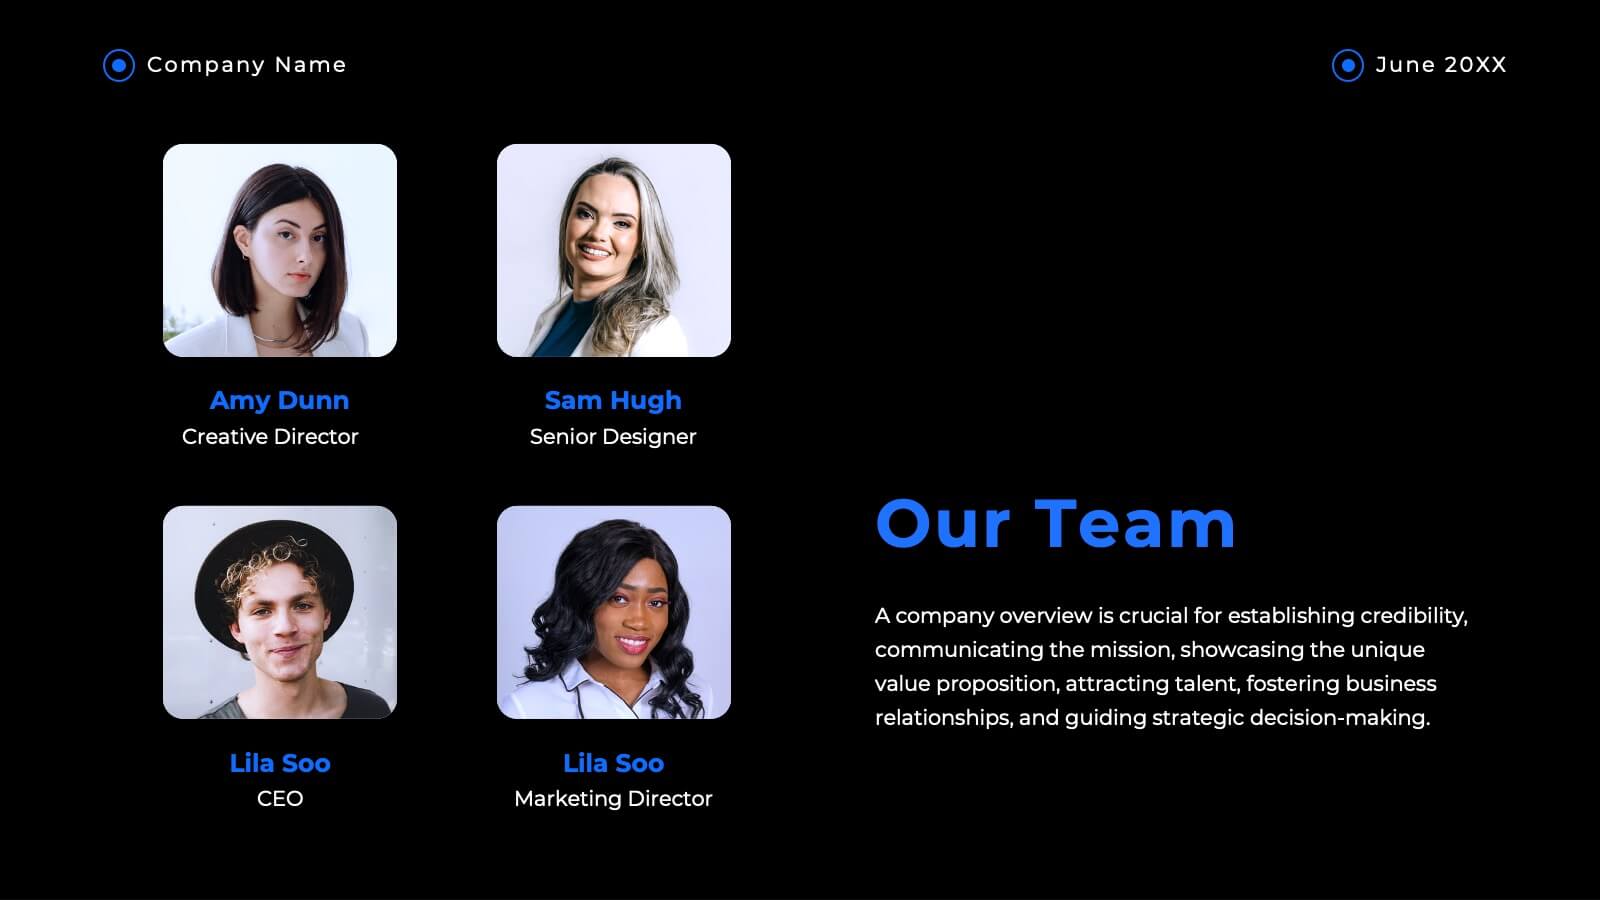
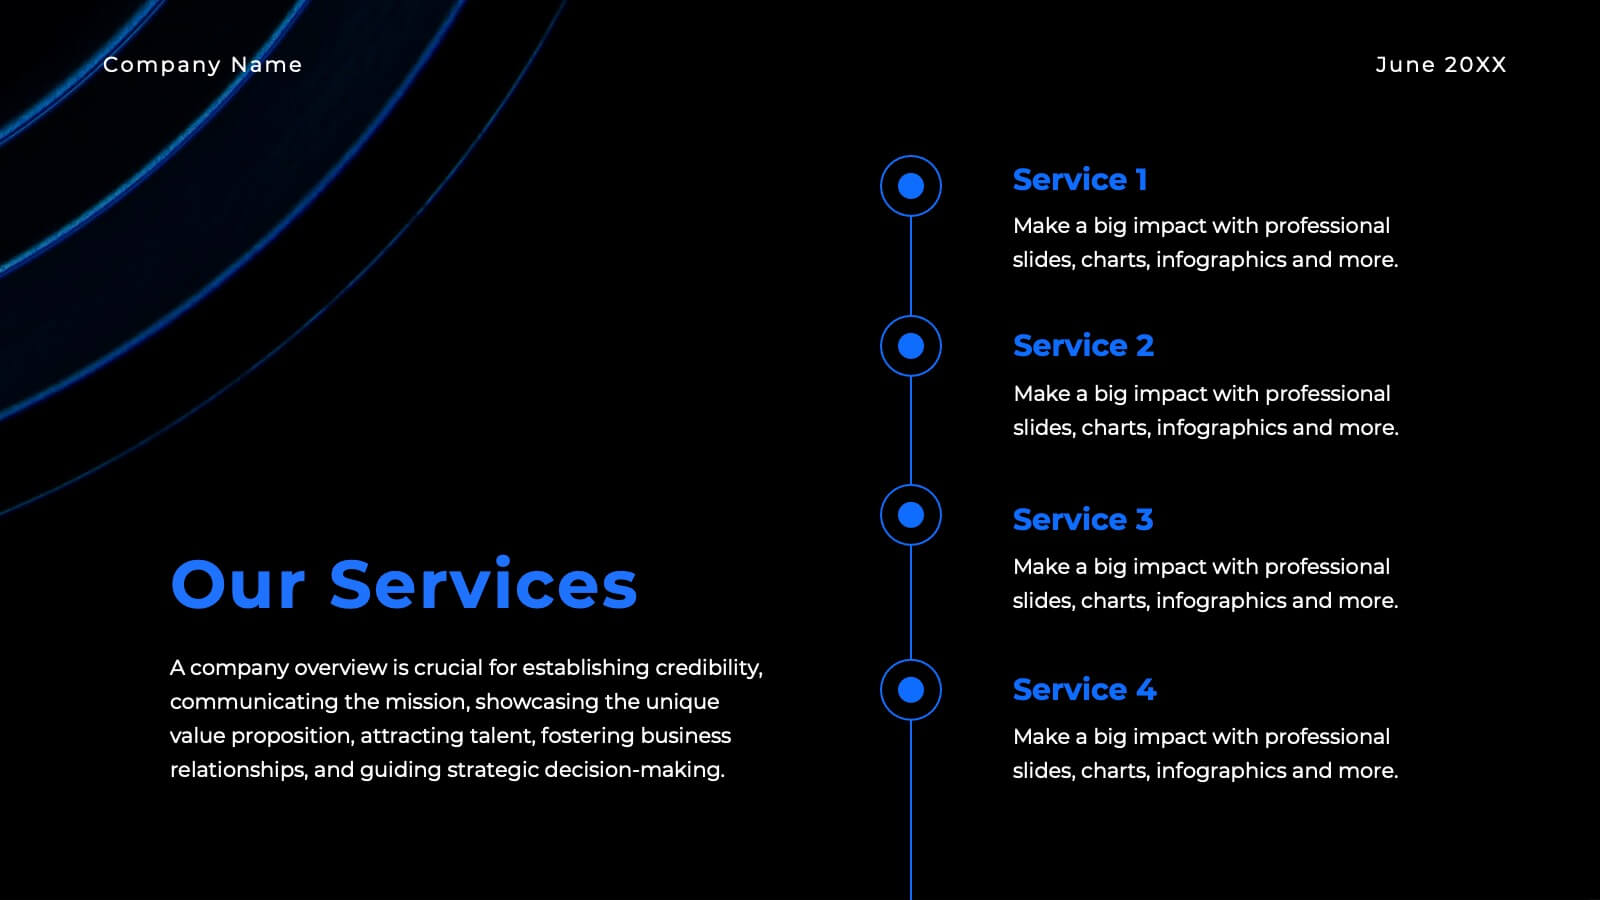
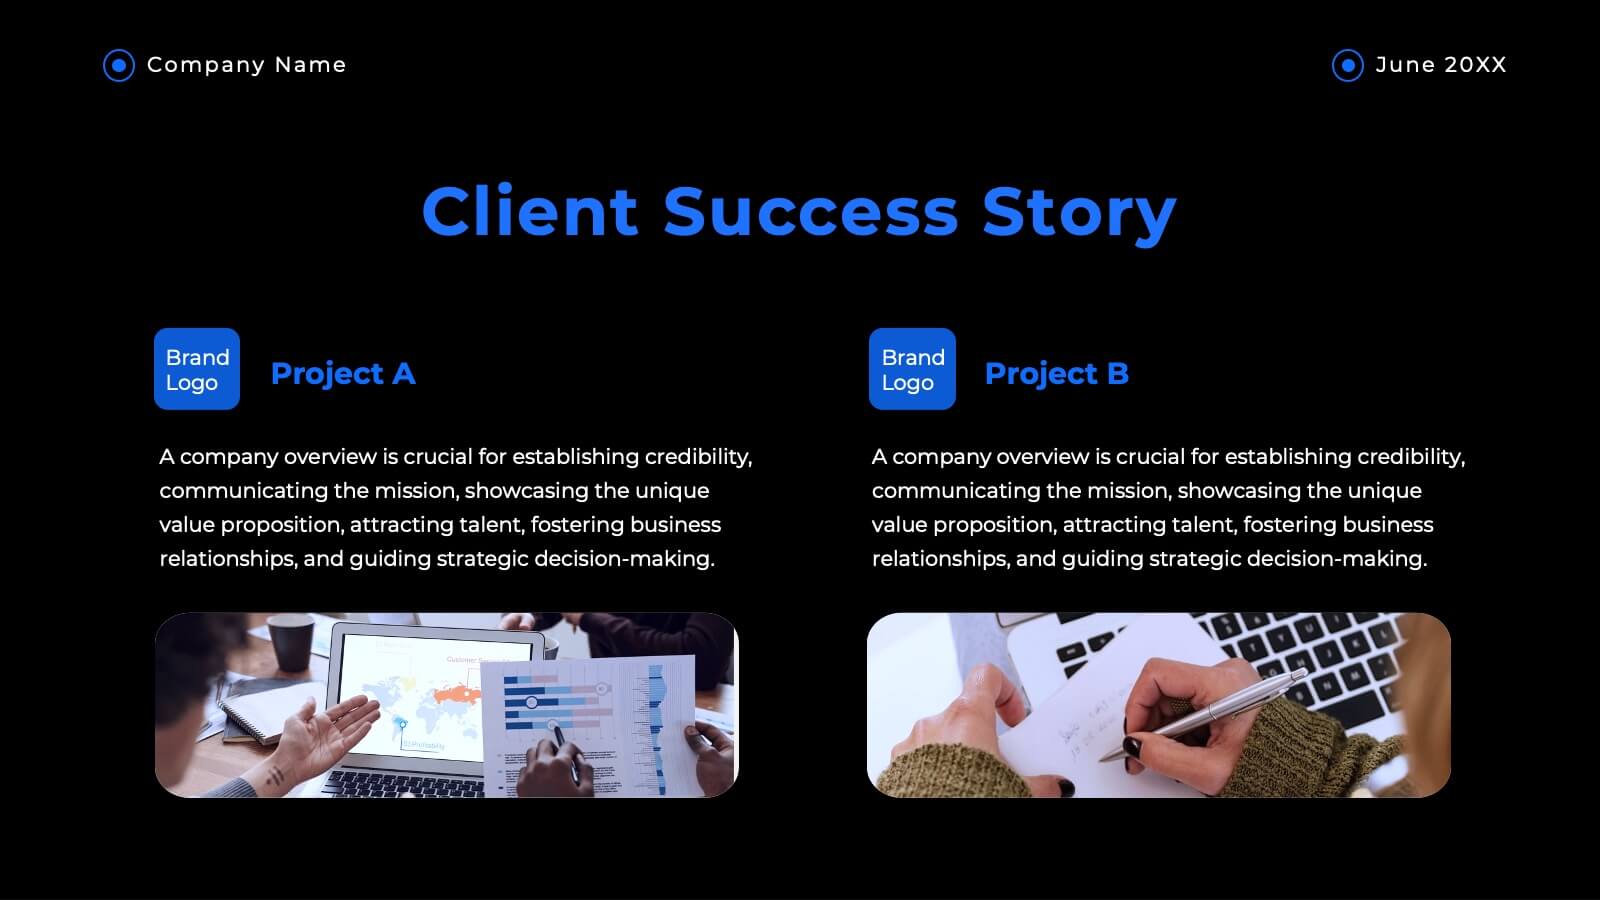
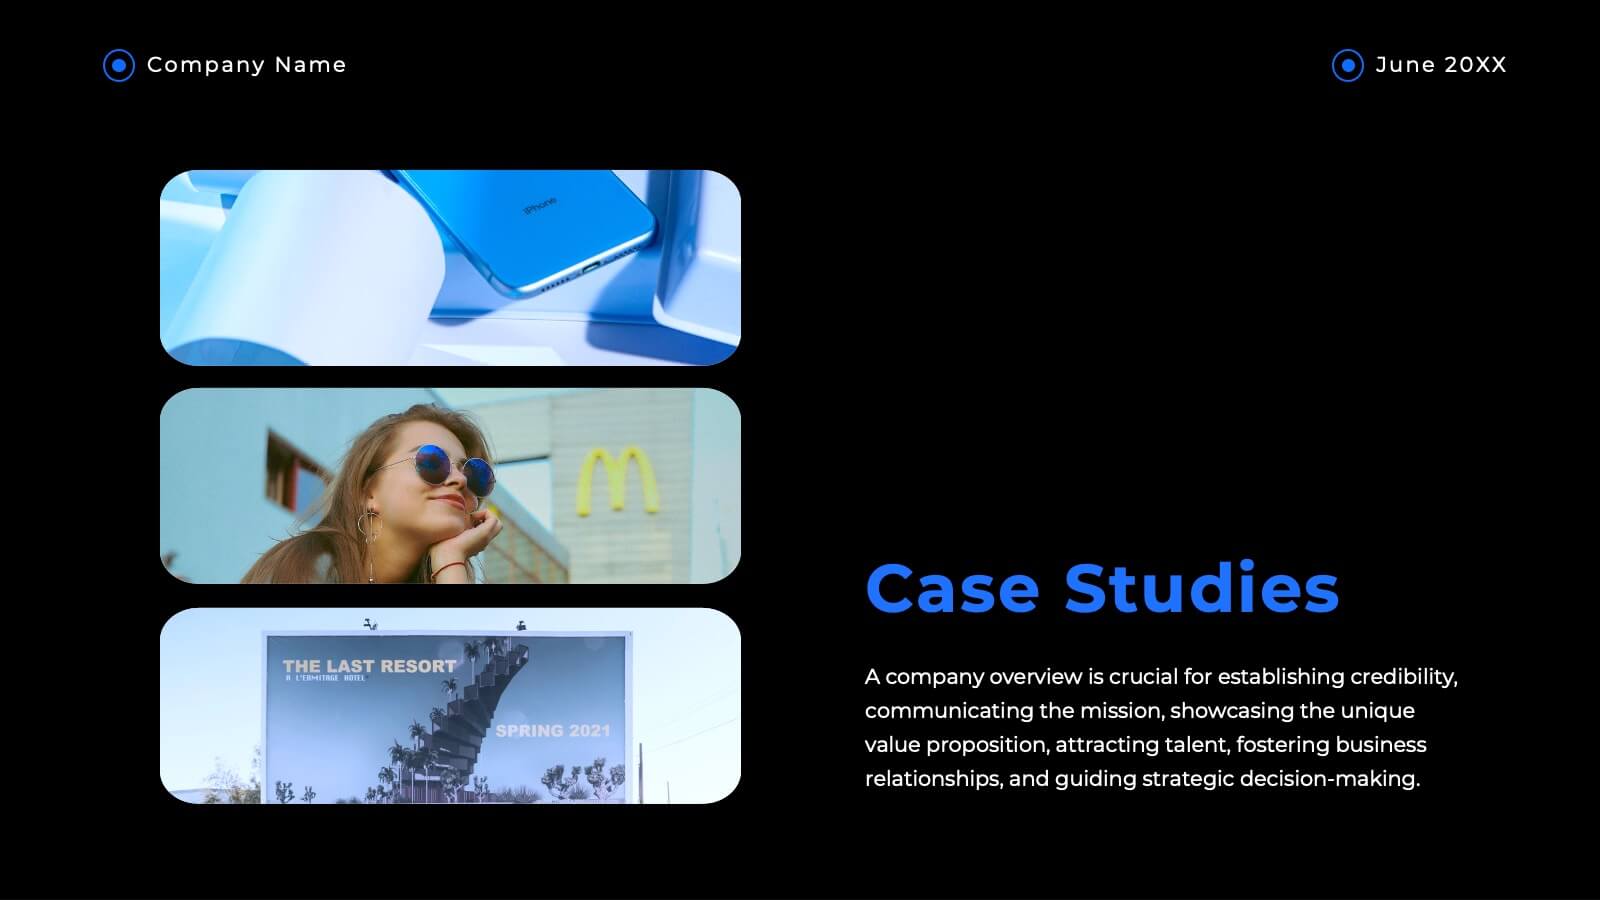
Haven Advertising Agency Proposal Presentation
Wow your clients with this sophisticated agency presentation template! Perfect for showcasing your services, client success stories, and market analysis. Ideal for agencies looking to impress and secure new business. Compatible with PowerPoint, Keynote, and Google Slides, this template ensures your proposals stand out with professional elegance. Perfect for any pitch or proposal.


5 slides
Compete-Free Market Space Creation Presentation
The Compete-Free Market Space Creation Presentation is designed to help illustrate a strategic shift toward innovation-led market growth. This circular diagram layout allows you to highlight four essential focus areas—each with customizable icons, titles, and supporting text. Ideal for presenting frameworks based on Blue Ocean Strategy, business differentiation, or uncontested market exploration. The clean, professional design supports storytelling with clarity and flow, making it perfect for consultants, business strategists, and executive teams. Fully editable in PowerPoint, Keynote, and Google Slides for maximum flexibility.


6 slides
E-Learning Industry Infographic
E-learning, short for "electronic learning," refers to the use of digital technologies to deliver educational content and programs to learners via the internet or other digital platforms. This infographic template is a visual representation that provides key information and insights about the e-learning industry. This encompasses a wide range of online learning methods, tools, and resources that cater to various educational needs and goals. This template serves as a valuable tool to educate viewers about the e-learning landscape, its benefits, and its potential for transforming education and training.


7 slides
30 60 90 Business Plan Infographic
A 30-60-90 day plan is a strategic outline of goals and objectives that a person plans to achieve within specific timeframes—30, 60, and 90 days. Dive into the heart of strategic planning with our 30 60 90 business plan infographic. This bold and dynamic template is a visual roadmap, guiding you through the critical phases of a business plan and setting a solid course for success. Compatible with Powerpoint, Keynote, and Google Slides. This infographic is a powerful tool, illustrating the journey from inception to triumph in 90 days. Explore each crucial phase in crafting an effective business plan.


7 slides
Relationship Connectivity Infographic
The Relationship Connectivity Infographic provides a structured visualization to represent the interconnectedness of various elements within a system or project. This graphic organizes components into a cohesive layout that highlights how each part is related to and impacts the others. Ideal for demonstrating the complex synergy between different departments, phases of a project, or any scenario requiring a clear display of relationships, this infographic serves as an essential tool for planners, educators, and managers. It is designed to be user-friendly and is compatible with a range of platforms, including PowerPoint, Google Slides, and Keynote, making it easily customizable.