


Features
- 26 Unique slides
- Fully editable and easy to edit in Microsoft Powerpoint, Keynote and Google Slides
- 16:9 widescreen layout
- Clean and professional designs
- Export to JPG, PDF or send by email


Do you have any questions?
Recommend


5 slides
Operational Planning in 5 Key Steps Presentation
Present your operational roadmap with this dynamic 5-step arrow diagram. Each line represents a strategic input streamlined toward a unified goal. Ideal for workflows, business processes, or implementation plans. Fully editable in PowerPoint, Keynote, and Google Slides—perfect for team planning, operations meetings, and project execution strategies.


2 slides
Clean Cover Page Presentation
Start your presentation with a bold first impression using this sleek and minimalistic cover design. Perfect for business proposals, reports, or client pitches, this layout draws attention with clean typography and a strong visual hierarchy. Fully editable and easy to personalize in PowerPoint, Keynote, and Google Slides for smooth customization.


5 slides
Business Future Vision Strategy Presentation
Visualize the roadmap to your company’s future with this engaging Business Future Vision Strategy slide. The stacked cylinder infographic helps you layer key initiatives, goals, or timelines in a clean and structured format. With five editable tiers and corresponding text areas, this layout is perfect for showcasing development phases, innovation strategies, or long-term planning. Ideal for strategic meetings, business proposals, or future-focused pitches. Compatible with PowerPoint, Keynote, and Google Slides for seamless customization.


6 slides
Weekly Gantt Planning Slide Presentation
Jump into your week with a layout that makes planning feel effortless and visually clear. This presentation helps teams map tasks across each day, track progress, and organize priorities with a clean, modern weekly timeline. Perfect for project updates and team coordination. Fully compatible with PowerPoint, Keynote, and Google Slides.


21 slides
Vibrato Startup Funding Proposal Presentation
This bold startup funding proposal sparks investor interest with a powerful story, innovative solutions, and high-growth strategies. Showcase game-changing technology, a passionate team, and an unstoppable roadmap to success. With clear metrics and dynamic visuals, this pitch invites investors to fuel the next big breakthrough.


26 slides
Hypnosia Brand Guidelines Proposal Presentation
This Brand Guidelines Proposal Template provides a sleek, professional layout to showcase key branding elements like vision, values, identity, and strategy. Perfect for businesses and agencies, it ensures brand consistency. Fully customizable and compatible with PowerPoint, Keynote, and Google Slides for seamless adaptation to your brand’s style.


21 slides
Ecliptica Design Strategy Proposal Presentation
Elevate your design strategy proposals with this clean and professional presentation template. Featuring a structured layout, it covers essential sections like design briefs, target audience analysis, concept development, and final presentation deliverables. Visuals such as wireframes, design process breakdowns, and project timelines help convey your creative ideas effectively. With placeholders for typography, color schemes, and visual direction, this template is tailored for creative professionals, agencies, and designers. Easily adaptable to suit your branding needs, it's compatible with PowerPoint, Google Slides, and Keynote for seamless customization and presentation. Perfect for pitching new strategies or showcasing your design process.


20 slides
Oracle Startup Strategy Presentation
Launch your startup strategy with this sleek template! Perfect for detailing your mission, vision, business model, and market analysis. Ideal for entrepreneurs aiming to impress investors and stakeholders. Compatible with PowerPoint, Keynote, and Google Slides, this template ensures your startup strategy is professional, clear, and compelling. Secure your path to success!


7 slides
Scope Management and Planning Presentation
Ensure clear project scope definition with the Scope Management and Planning Presentation. This structured template highlights key elements of project scope, responsibilities, and deliverables using an intuitive layout. Ideal for project managers, business analysts, and teams aligning project goals. Fully editable and compatible with PowerPoint, Keynote, and Google Slides.


5 slides
Defining Target Market and Audience Presentation
Identify and segment your ideal customer base with this visually structured pyramid slide. Designed to represent layered audience demographics or buyer personas, each level allows space for detailed insights and strategy alignment. The accompanying icons and side labels enhance clarity and storytelling for marketing, branding, or campaign planning presentations. Fully editable in PowerPoint, Keynote, and Google Slides to fit your branding and messaging needs.


4 slides
Communication Model and Channels Presentation
Illustrate how your messages move through various channels using this clean, visual communication model slide. Ideal for team briefings, marketing workflows, or internal training, it simplifies how information is shared across platforms. Fully editable in Canva, PowerPoint, and Google Slides for seamless customization to match your branding and messaging goals.


8 slides
Business Challenge & Solution Presentation
Address complex issues with clarity using this business challenges and solutions presentation. Featuring a chess knight visual, it helps outline problems and corresponding strategies. Ideal for strategic planning, risk management, and executive briefings. Fully customizable in PowerPoint, Keynote, and Google Slides to fit your corporate or consulting presentation needs.


12 slides
Business Environmental Factors PESTEL Analysis Presentation
Visualize critical external influences on your business strategy with this Business Environmental Factors PESTEL Analysis slide. Designed for consultants, business analysts, and executive teams, this template uses a circular layout to highlight the six core PESTEL categories—Political, Economic, Sociocultural, Technological, Environmental, and Legal. Each segment is clearly marked with icons and labels, offering space to insert key insights or impact notes. Perfect for competitive analysis, board presentations, and long-term planning. Fully editable in PowerPoint, Keynote, and Google Slides.


6 slides
Hexagonal Grid for Process Mapping Presentation
Visualize your workflow with structure using the Hexagonal Grid for Process Mapping Presentation. This clean, geometric layout guides viewers through each phase of your process with clarity and consistency. Ideal for outlining steps, stages, or interconnected tasks in a modern format. Fully editable in Canva, PowerPoint, Keynote, and Google Slides.


4 slides
End-to-End Supply Chain Optimization Presentation
Streamline your logistics strategy with this modern End-to-End Supply Chain Optimization slide. Featuring bold vector icons representing production, automation, and distribution, this layout clearly visualizes key supply chain stages. Ideal for presenting operations flow, logistics planning, or manufacturing improvements. Fully customizable in PowerPoint, Keynote, and Google Slides for seamless integration into your business deck.
22 slides
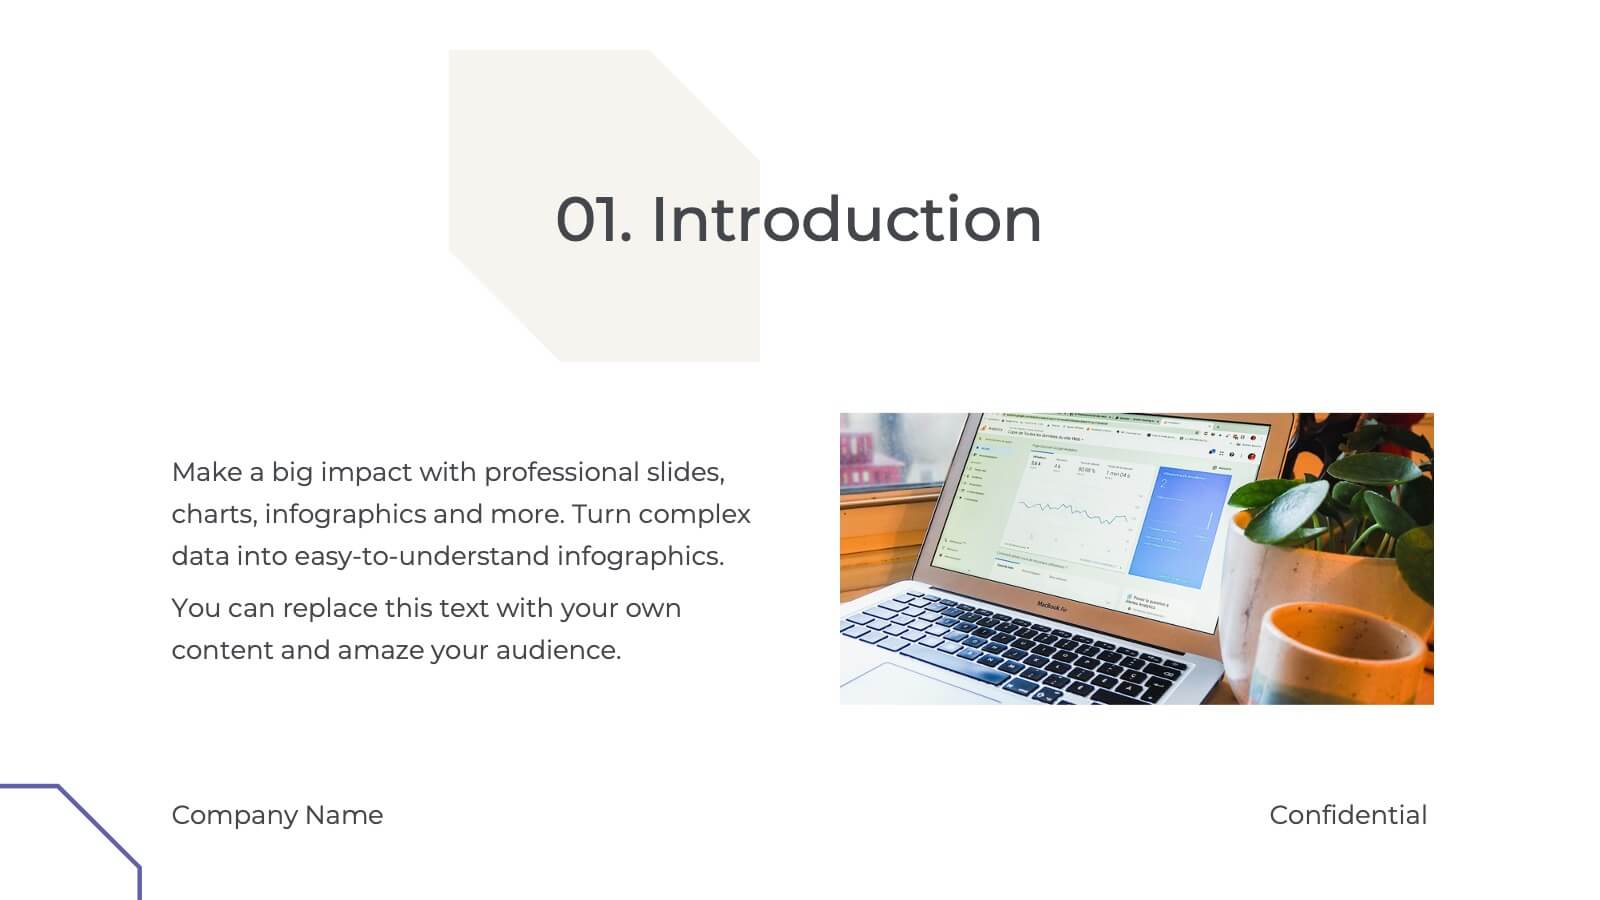
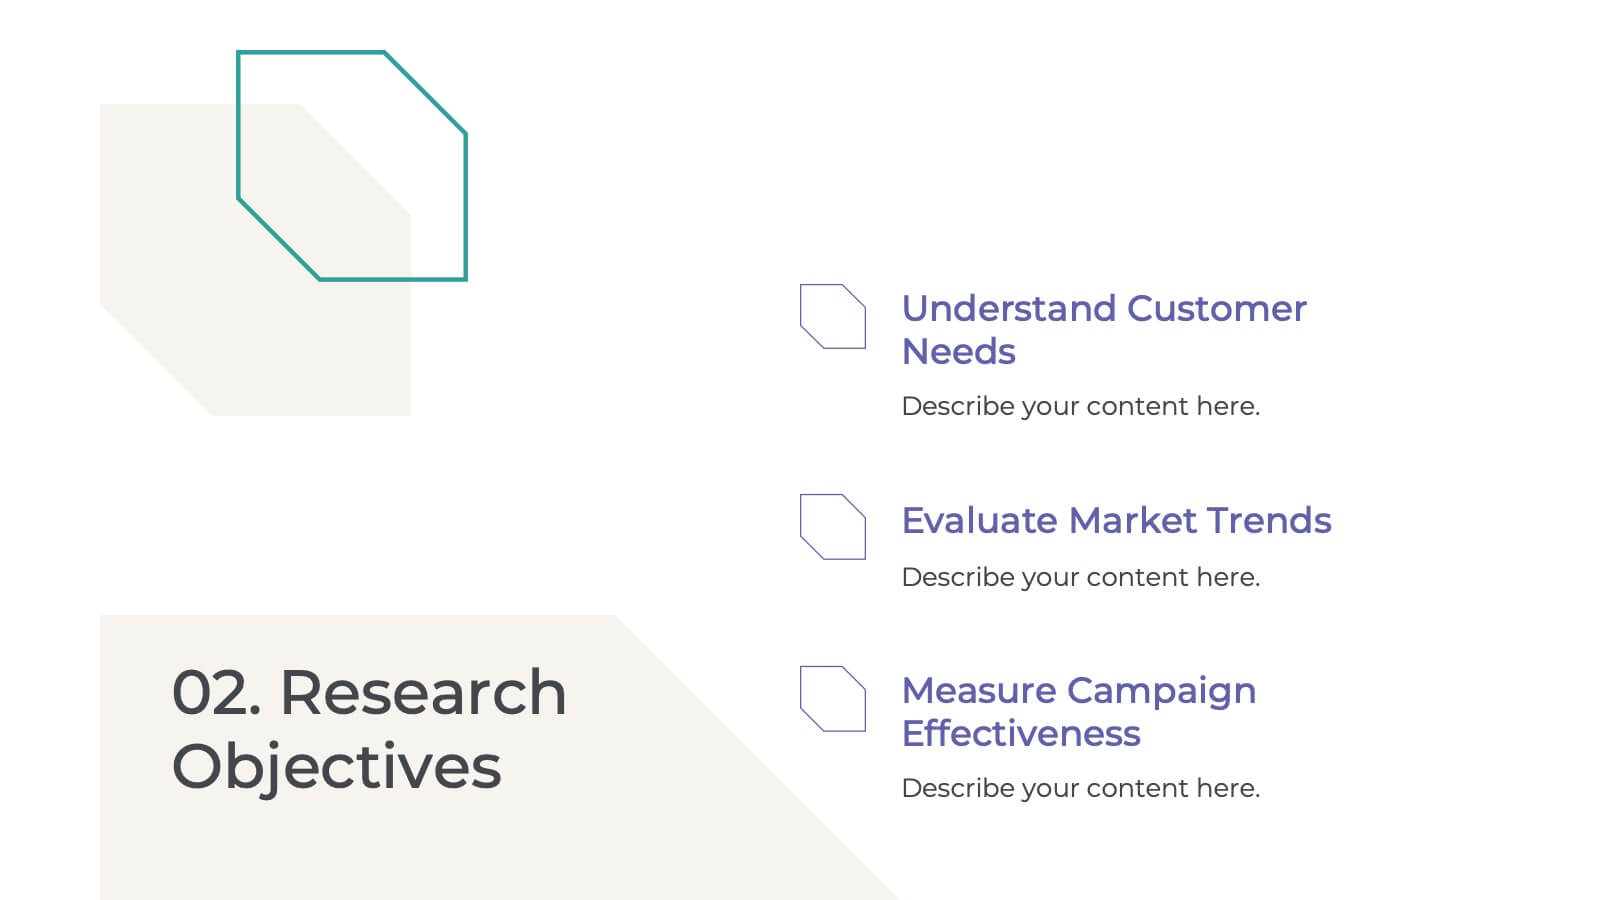
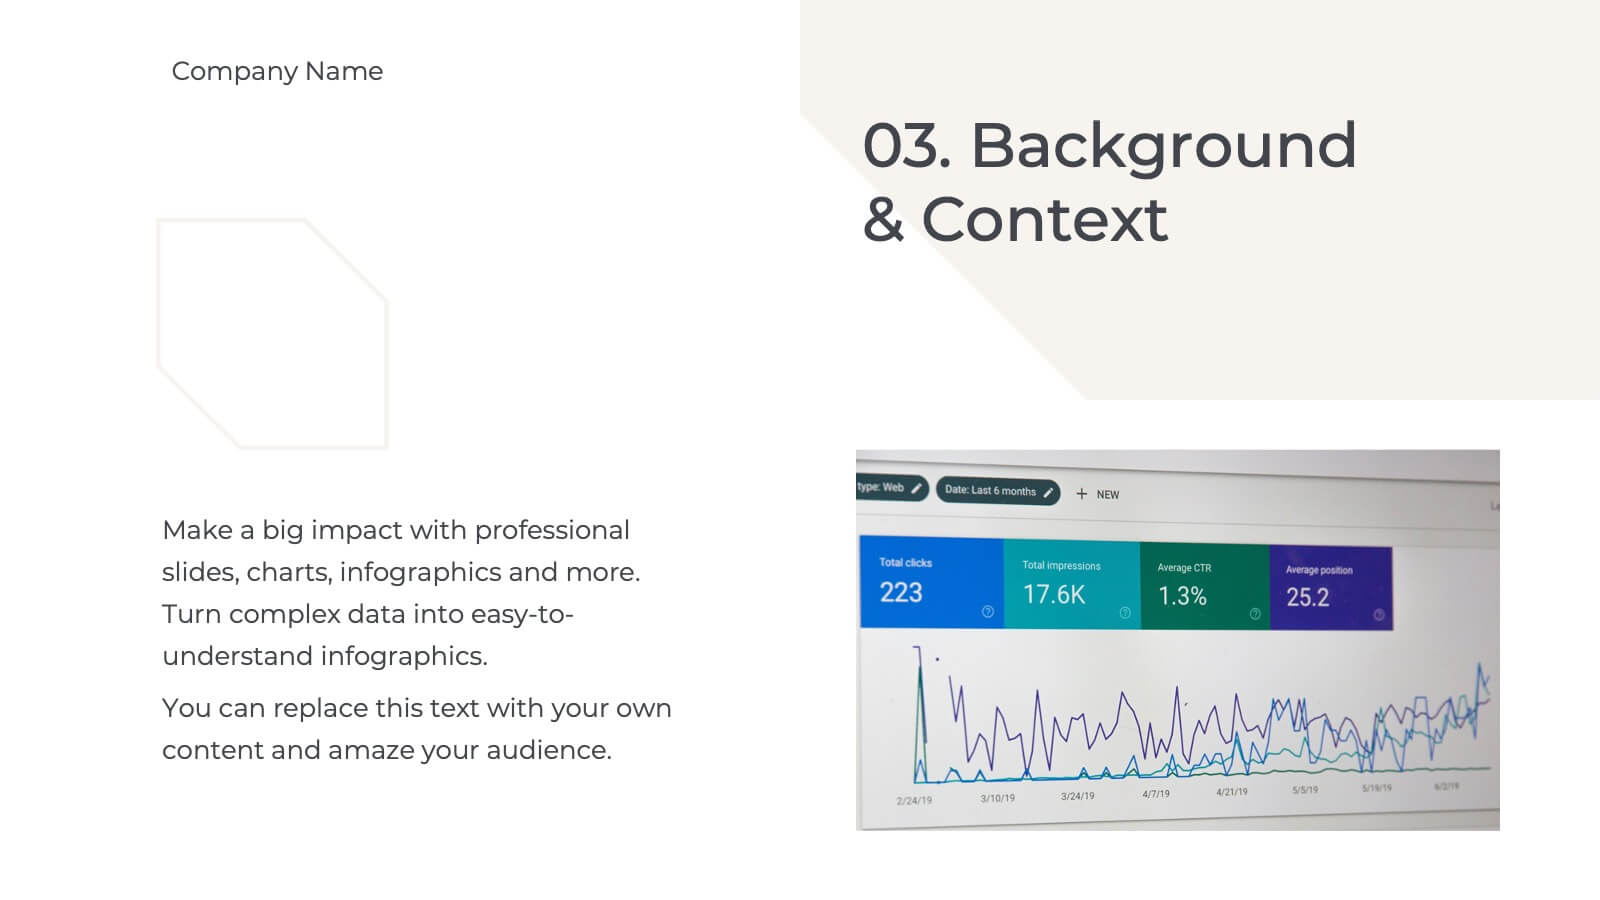
Palladium Qualitative Research Findings Presentation
Present your qualitative research findings effectively with this sleek, professional template. It includes sections for objectives, data analysis, key findings, and recommendations. Ideal for organizing research insights clearly, it's customizable and compatible with PowerPoint, Keynote, and Google Slides, ensuring smooth collaboration and impactful presentations for your audience.


5 slides
5-Level Smile Rating Presentation
Give your audience a fun, visual way to understand sentiment with this colorful rating slide. Perfect for feedback summaries, project reviews, or performance insights, it displays five clear emotion levels in a simple, engaging format. Easy to customize and fully compatible with PowerPoint, Keynote, and Google Slides.