


Features
- 5 Unique slides
- Fully editable and easy to edit in Microsoft Powerpoint, Keynote and Google Slides
- 16:9 widescreen layout
- Clean and professional designs
- Export to JPG, PDF or send by email


Do you have any questions?
Recommend


5 slides
Strategic Budget Planning Forecasting Presentation
For strategic financial management, our Strategic Budget Planning Forecasting template provides a clear visual guide for balancing income and expenses. Ideal for financial planners, it simplifies quarter-by-quarter planning with dynamic charts, ensuring clarity and precision in forecasting financial outcomes. Fully compatible with PowerPoint, Keynote, and Google Slides, it's a versatile tool for any financial presentation or workshop.


7 slides
McKinsey 7S Model Strategy Presentation
Bring clarity to complex organizational relationships with a clean, structured layout that highlights how key elements connect and influence performance. This presentation helps you explain core components, identify alignment gaps, and guide strategic decision-making with confidence. Easy to customize and fully compatible with PowerPoint, Keynote, and Google Slides.


21 slides
Cupid Sales Proposal Presentation
Elevate your next proposal with this sleek and professional presentation template! Ideal for outlining project goals, scope of work, and timelines, this template ensures that every detail is presented with clarity and impact. It includes sections for budget breakdowns, team expertise, and risk management strategies. Compatible with PowerPoint, Keynote, and Google Slides, it’s designed for flexibility and success.

1 slide
Professional Presentation Cover Slide Presentation
Make a bold first impression with this sleek and modern cover slide designed to introduce your presentation with confidence. Its clean layout and striking geometric shapes create a polished look while giving viewers a clear sense of professionalism. Perfect for business, marketing, or project presentations, and fully compatible with PowerPoint, Keynote, and Google Slides.


5 slides
Marijuana Cultivation Infographics
Marijuana cultivation refers to the process of growing and cultivating marijuana plants for various purposes, primarily for medicinal or recreational use. These vertical infographics are designed to provide essential information about the cultivation of marijuana. It offers an in-depth overview of the cultivation process, growing techniques, equipment, and best practices. The template outlines the step-by-step cultivation process of marijuana, starting from seed germination to harvesting and drying. It includes visuals and icons to illustrate each stage, making it easy to understand for beginners and everyone.

20 slides
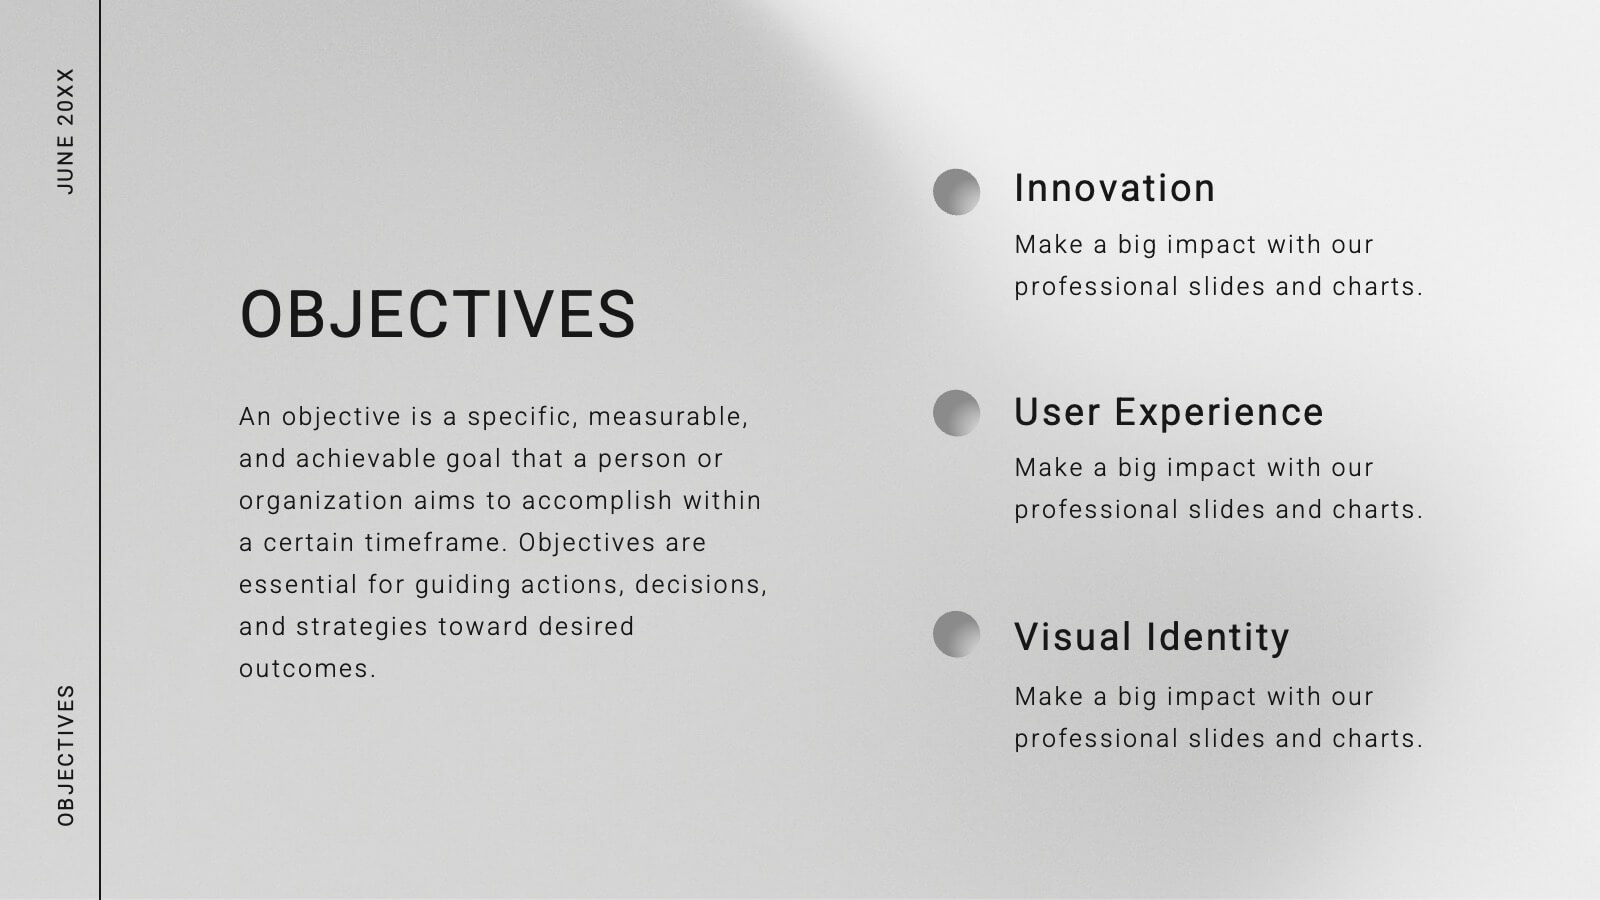
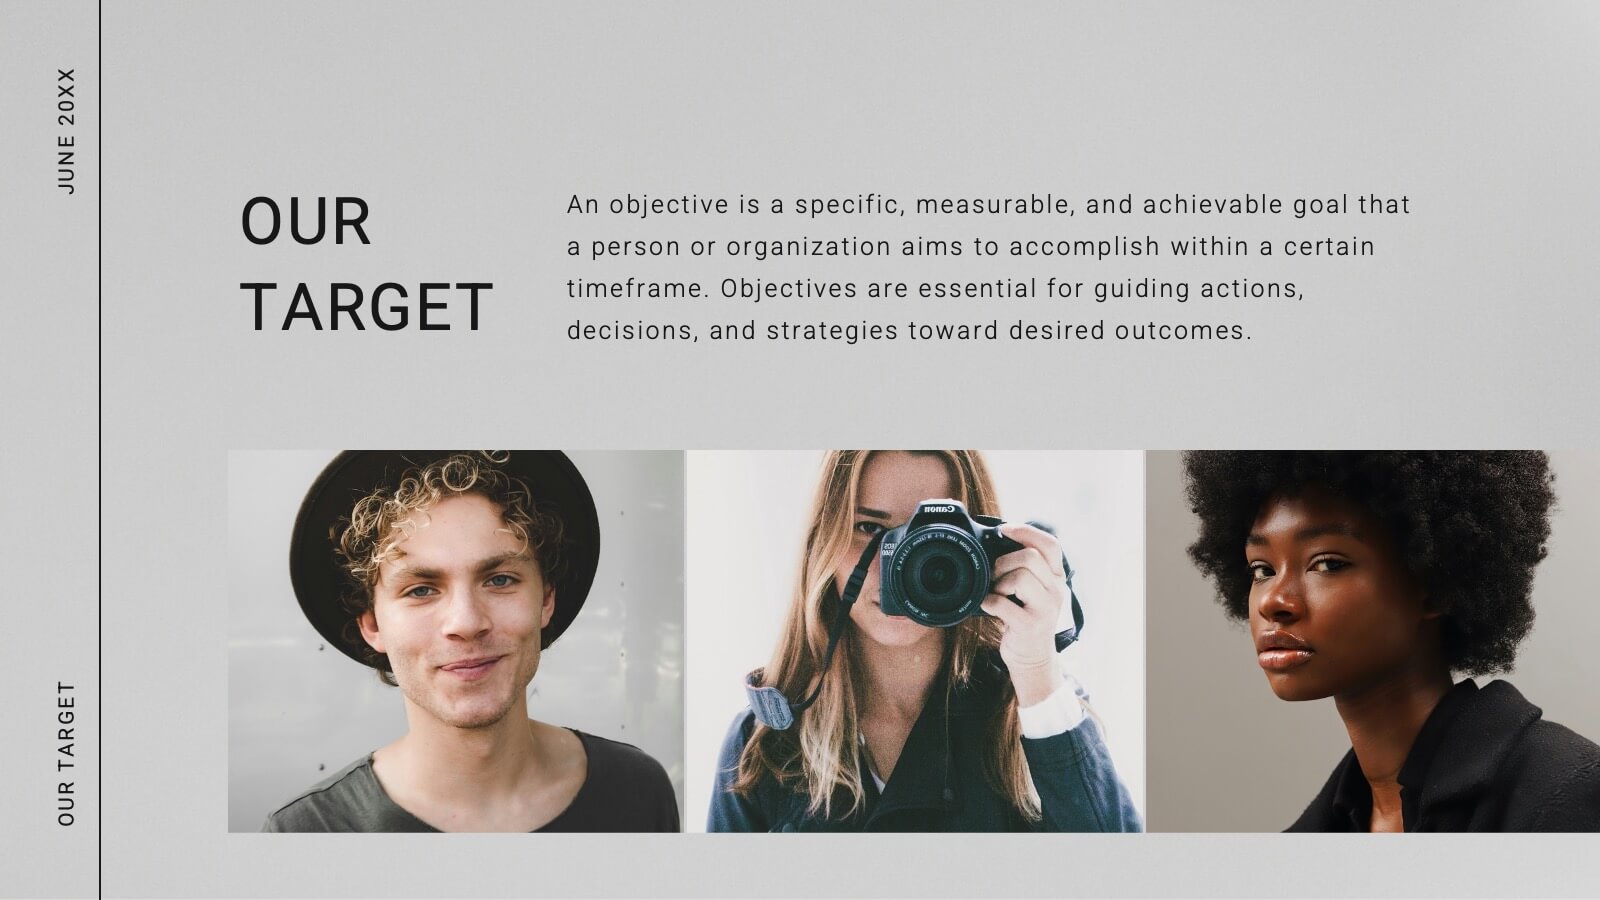
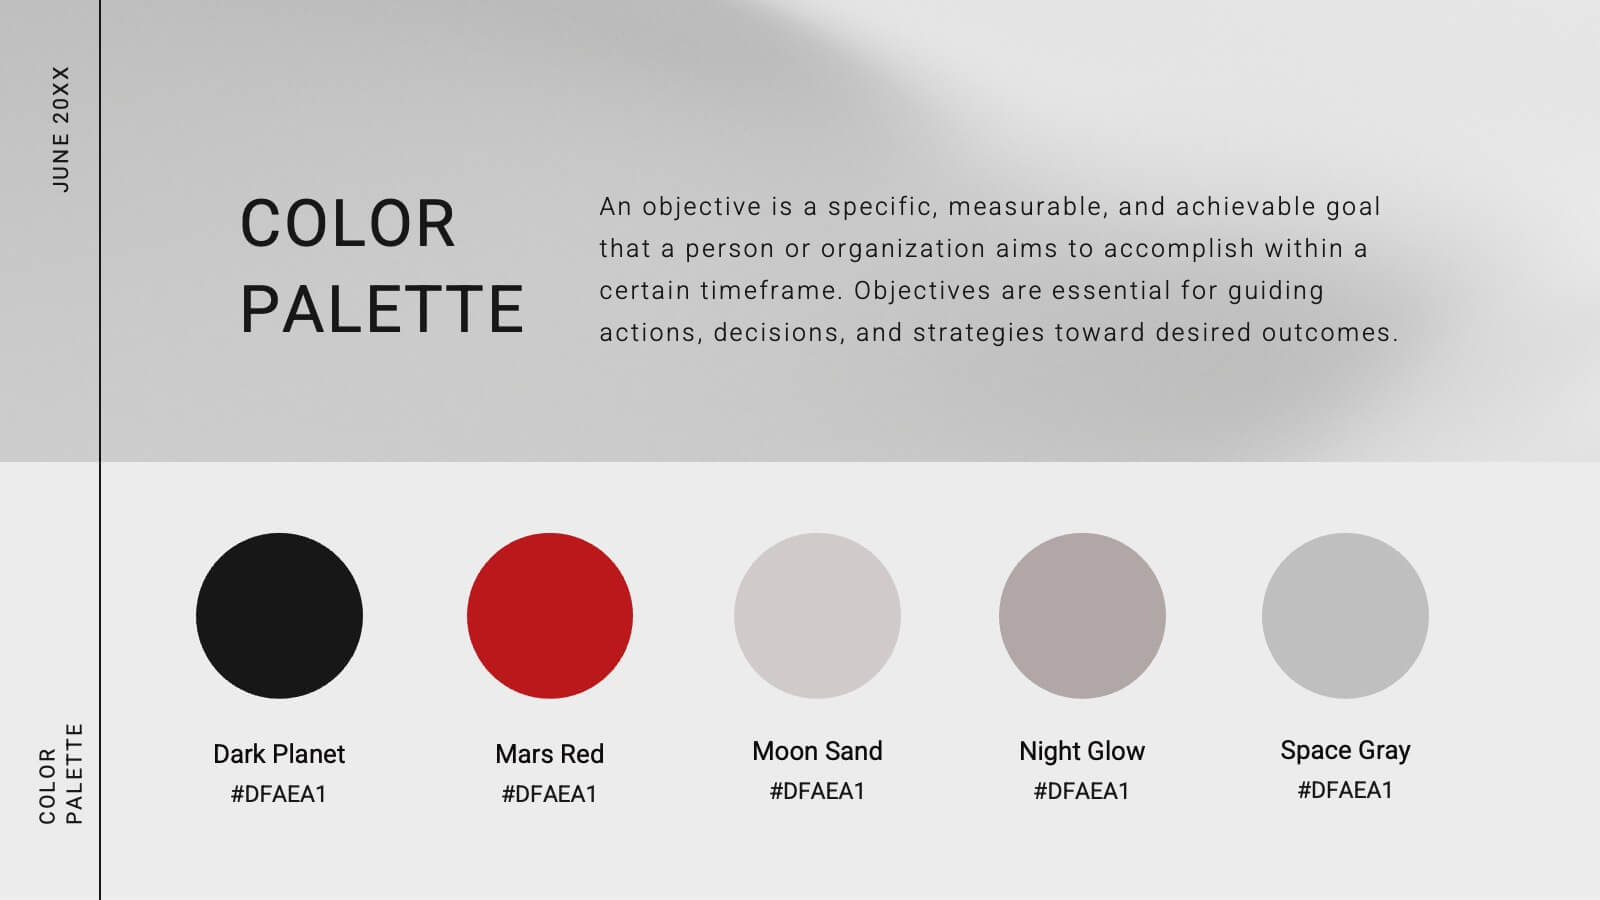
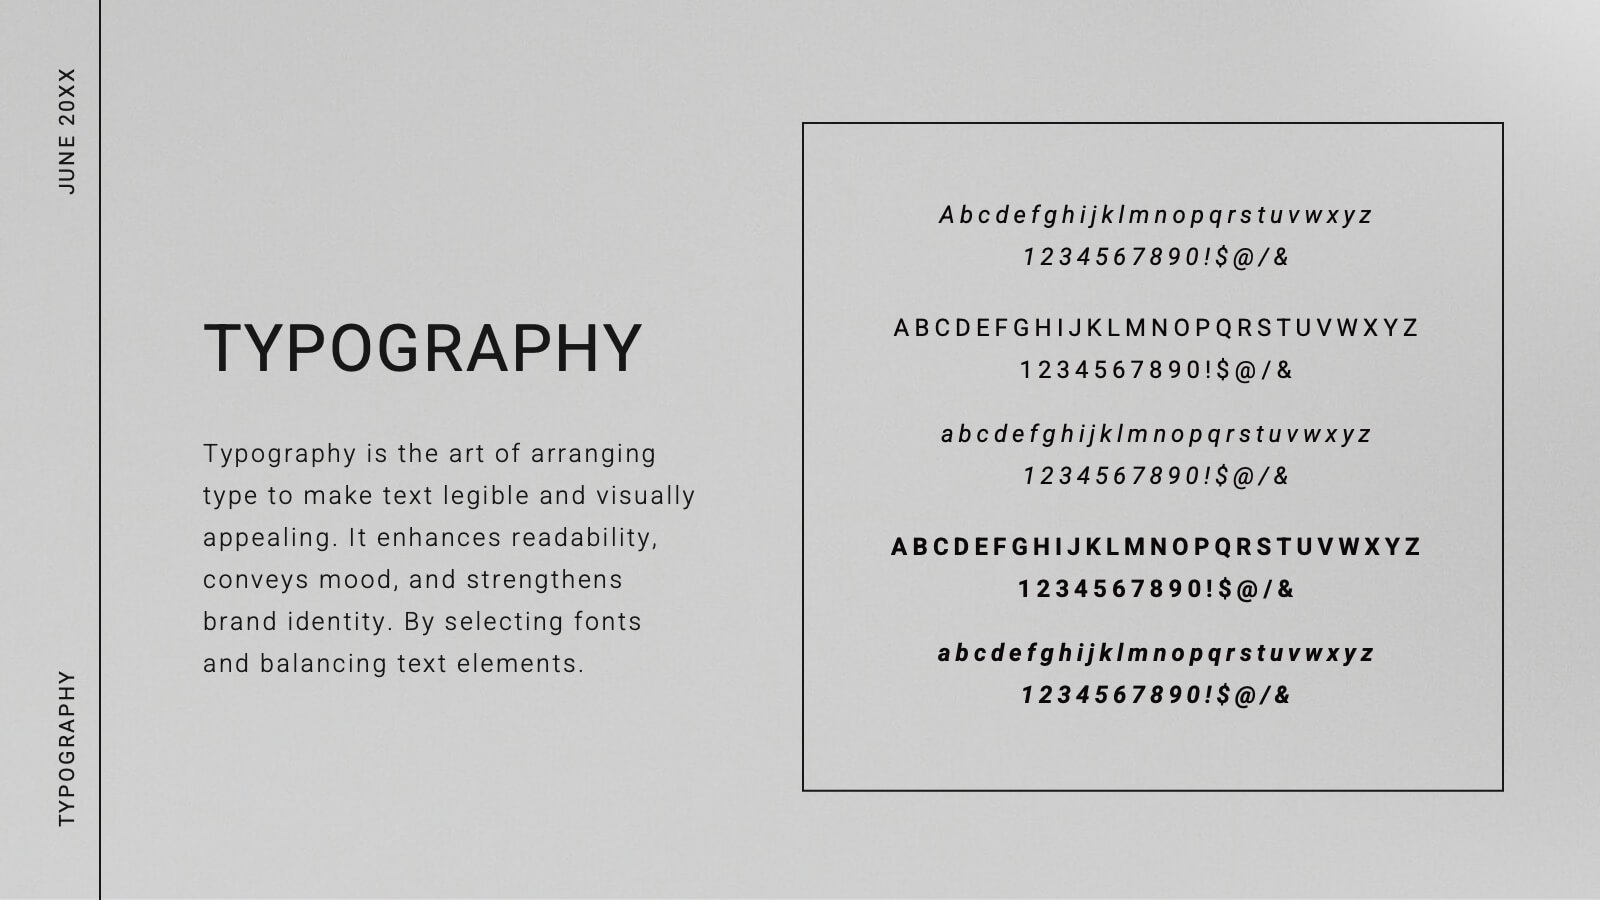
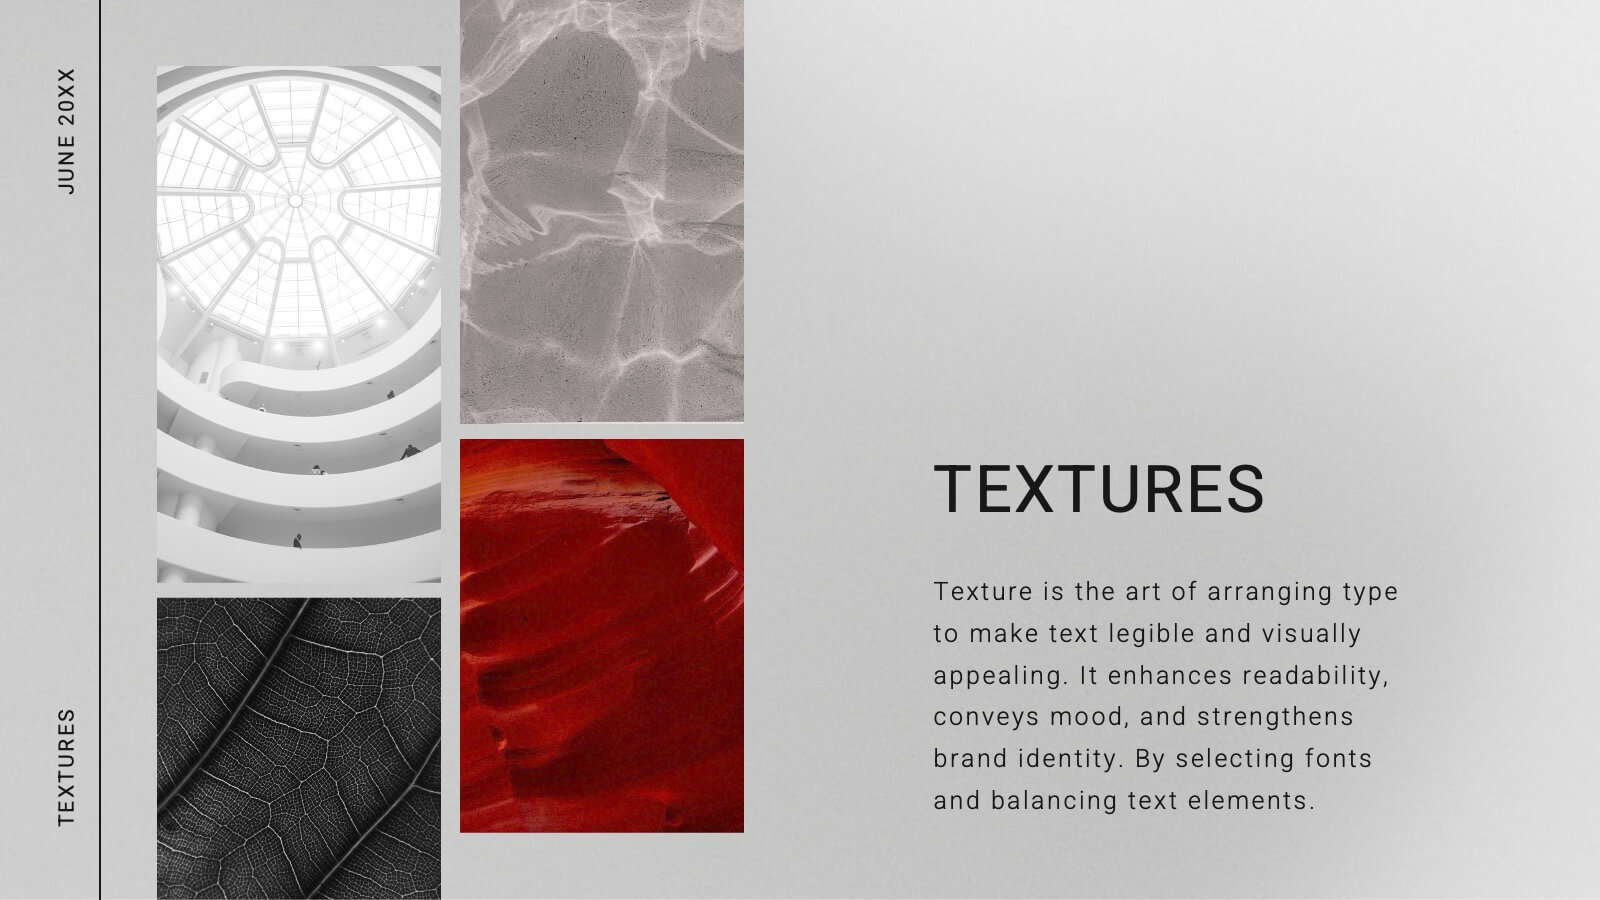
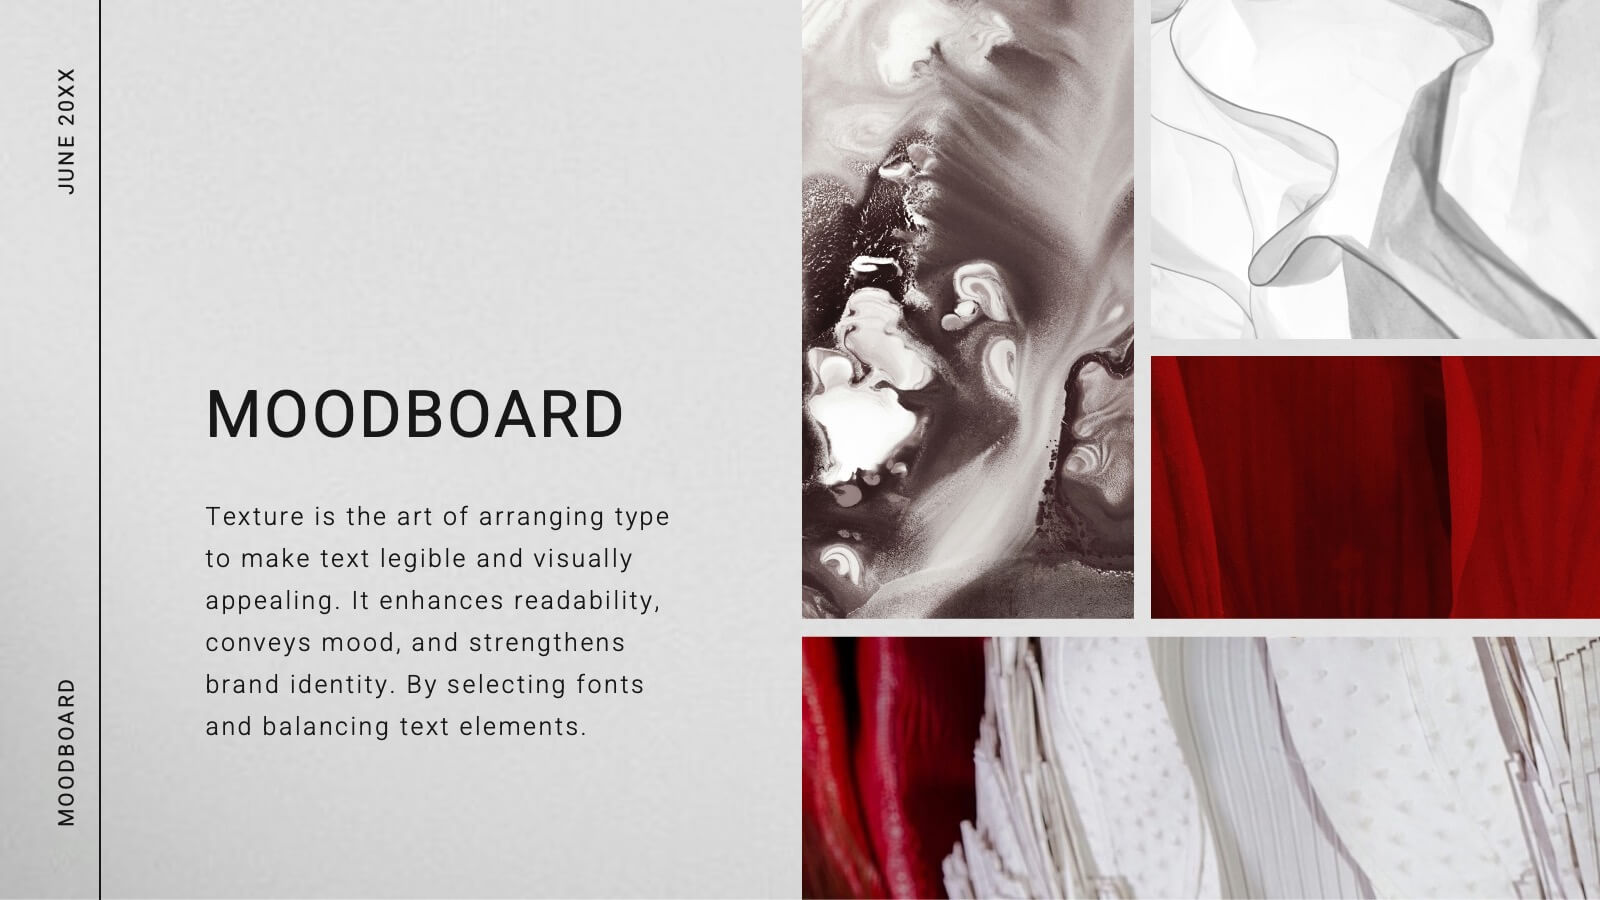
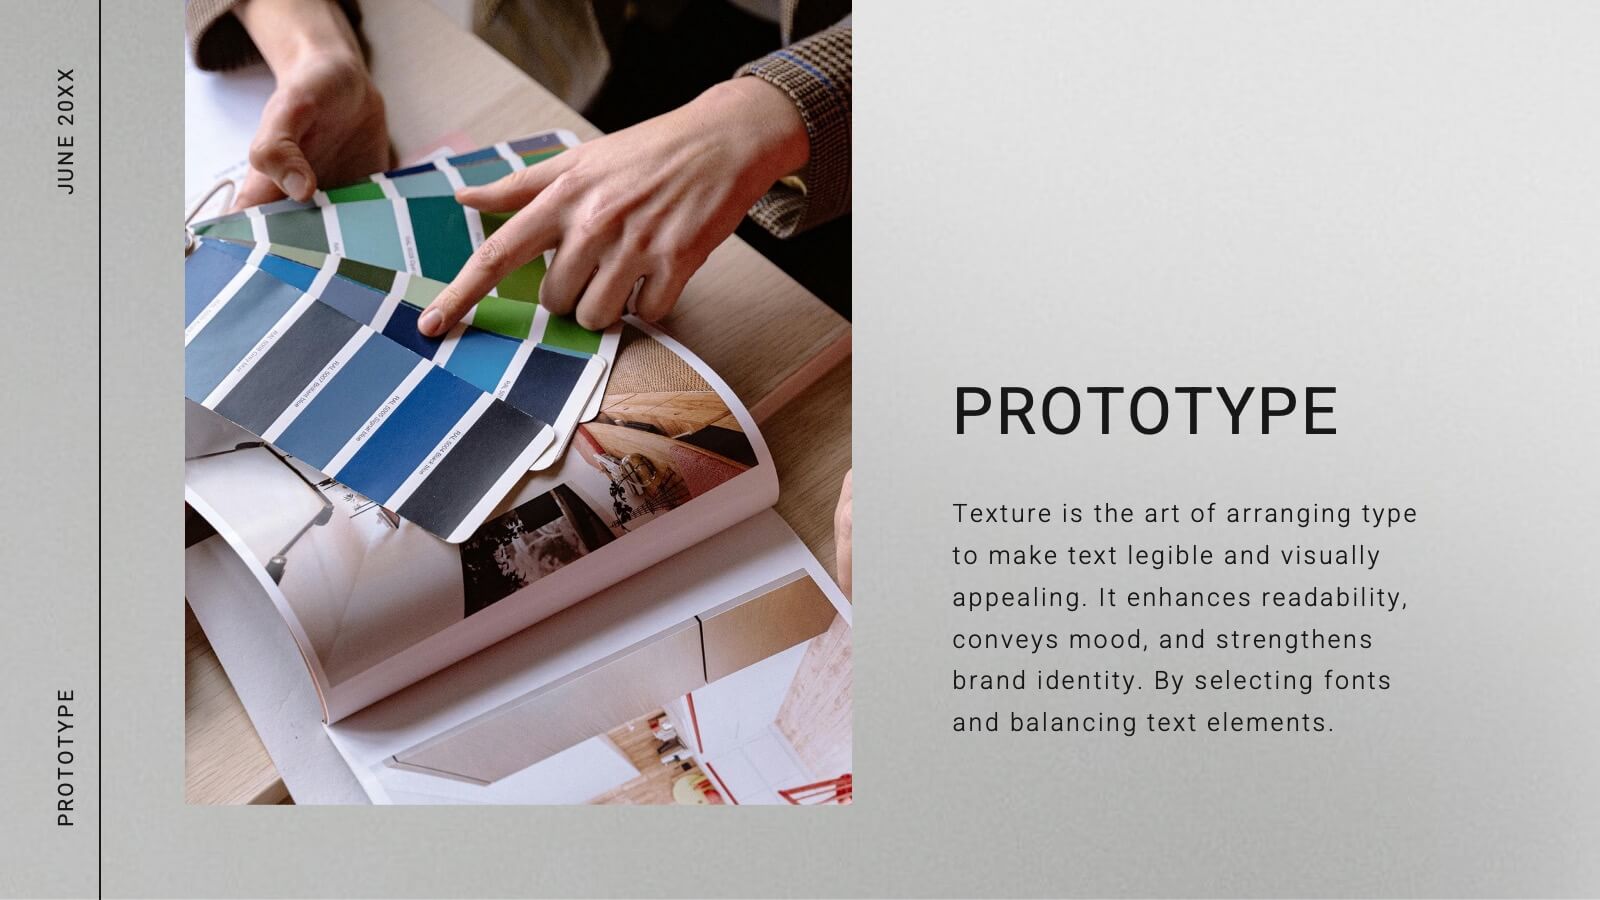
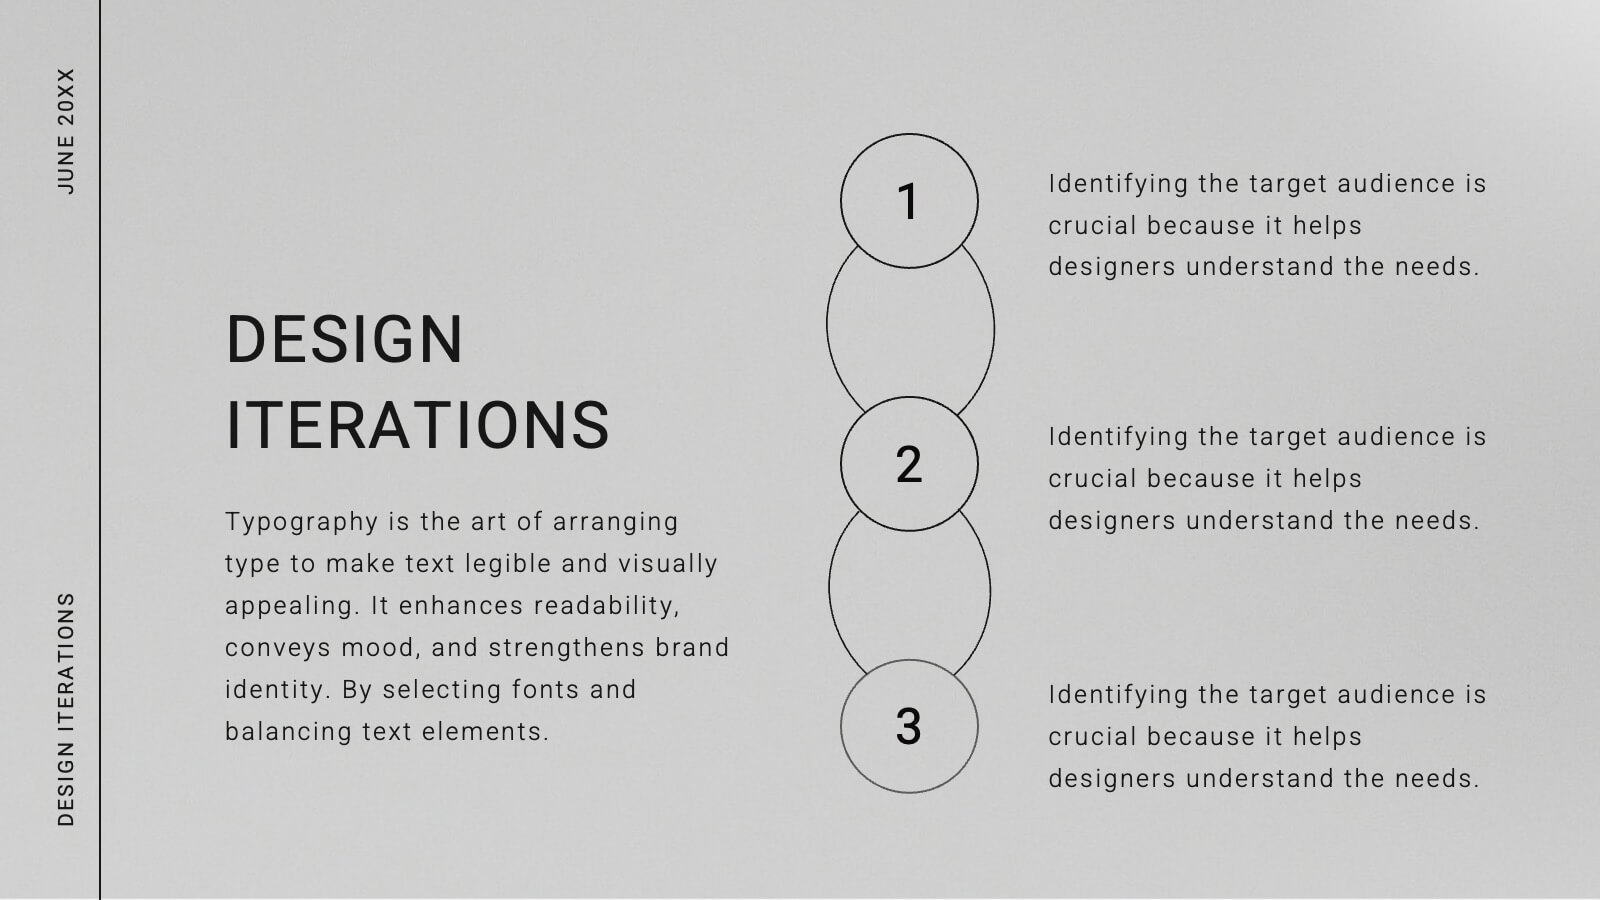
Comet Graphic Design Project Plan Presentation
Craft stunning design project presentations with this elegant template. Showcase objectives, processes, mood boards, and final designs effectively. Ideal for creative teams and clients. Fully compatible with PowerPoint, Keynote, and Google Slides.


6 slides
Big Data Technology Infographic
Big Data technology refers to the tools, techniques, and frameworks used to capture, store, process, analyze, and visualize large and complex datasets that are beyond the capabilities of traditional data processing systems. This infographic template is perfect for organizations that deal with massive volumes of data from various sources, including social media, sensors, machines, and more. This template enables businesses to gain valuable insights, make informed decisions, and create new opportunities. This infographic can be used for various industries, including e-commerce, healthcare, finance, manufacturing, and more.


6 slides
Clinical Case and Research Presentation
Bring science to life with a presentation that blends precision and clarity. Perfect for showcasing clinical findings, lab results, and research data, this professional layout helps communicate complex studies with ease and visual balance. Fully customizable and compatible with PowerPoint, Keynote, and Google Slides for seamless editing and presentation.


6 slides
Corporate Sustainability Management Presentation
Step into the future of business with our Corporate Sustainability Management Presentation template. Perfect for strategists seeking to integrate eco-friendly practices, this template facilitates effective communication of sustainability goals and initiatives. It’s a powerful tool for illustrating how environmental strategies can be interwoven with business objectives to foster long-term growth. Tailored for presentations on PowerPoint, Keynote, and Google Slides, it helps leaders inspire action and commitment to sustainability across their organizations.


6 slides
Work from Home Best Practices Presentation
The "Work from Home Best Practices" presentation template is thoughtfully designed to display metrics and insights for remote work effectiveness. Each slide provides visual elements like bar graphs, line charts, and icon grids to represent various data points such as weekly activity percentage, hours worked, and number of projects managed. This setup is ideal for illustrating best practices and benchmarks in remote work environments, enabling clear communication of goals, achievements, and areas for improvement. The template uses a clean and professional layout with plenty of space for customization, making it a versatile tool for remote teams looking to optimize their workflows and productivity.


7 slides
Leadership Principles Infographic Presentation
A Leadership Infographic provides information about leadership principles, practices, and strategies. This template has been designed as a tool for presenting complex leadership concepts and ideas, using visual elements such as icons, charts, and diagrams. This infographics can be used to cover a wide range of topics related to leadership, including leadership styles, communication, decision-making, team building, and problem-solving. Use the text boxes and charts to provide information on the qualities and skills of effective leaders, such as empathy, vision, and strategic thinking.


5 slides
Brief Overview of Key Insights Presentation
Present essential information at a glance with this Brief Overview of Key Insights slide. Designed around a bold key graphic, this layout highlights up to four major takeaways with icons and concise descriptions. Ideal for summaries, analysis highlights, or recommendations. Fully editable in Canva, PowerPoint, or Google Slides.


6 slides
Medical Technologies Infographics
Explore the forefront of medical technology with this informative and sleek infographic template, tailored for professionals and students in the medical field. This template effectively presents key advancements and projects in medical technology, using a modern and clear design that is easy to follow. The slides are organized to detail different aspects of technology in healthcare, such as innovation in patient care, technological integration into existing systems, and future trends in the industry. Each section uses vibrant graphics and concise text to highlight important data and statistics, ensuring the information is both accessible and engaging. The color scheme is professionally chosen to represent trust and clarity, utilizing shades of blue and red to differentiate topics effectively. This not only enhances readability but also aligns with the themes of healthcare and technology. This template is a perfect tool for presenting at conferences, in educational settings, or during professional meetings where understanding the impact of technology on healthcare is crucial. It helps to convey complex information in a structured and visually appealing manner, making it an invaluable resource for anyone involved in the health technology sector.


7 slides
Risk Prevention and Safety Management Presentation
Elevate your organization's approach to hazard awareness with our 'Risk Prevention and Safety Management' presentation template. Designed to aid in illustrating essential safety measures and risk management tactics, this template is a must-have for training sessions and workshops. Fully compatible with PowerPoint, Keynote, and Google Slides, it's ideal for ensuring workplace safety and compliance.


4 slides
Strategic Risk Assessment and Control Presentation
Highlight layered risk priorities with the Strategic Risk Assessment and Control Presentation. This visual template uses a 3D concentric model (D to A) to illustrate escalating risk levels or control measures. Ideal for risk managers and compliance teams. Fully editable in PowerPoint, Google Slides, and Canva for seamless customization.


10 slides
Hierarchy Tree Structure Slide Presentation
Bring your ideas to life with a dynamic visual flow that connects every stage of your business strategy. Perfect for mapping growth, processes, or team structures, this clean and modern layout keeps your data clear and engaging. Fully compatible with PowerPoint, Keynote, and Google Slides for effortless customization.


5 slides
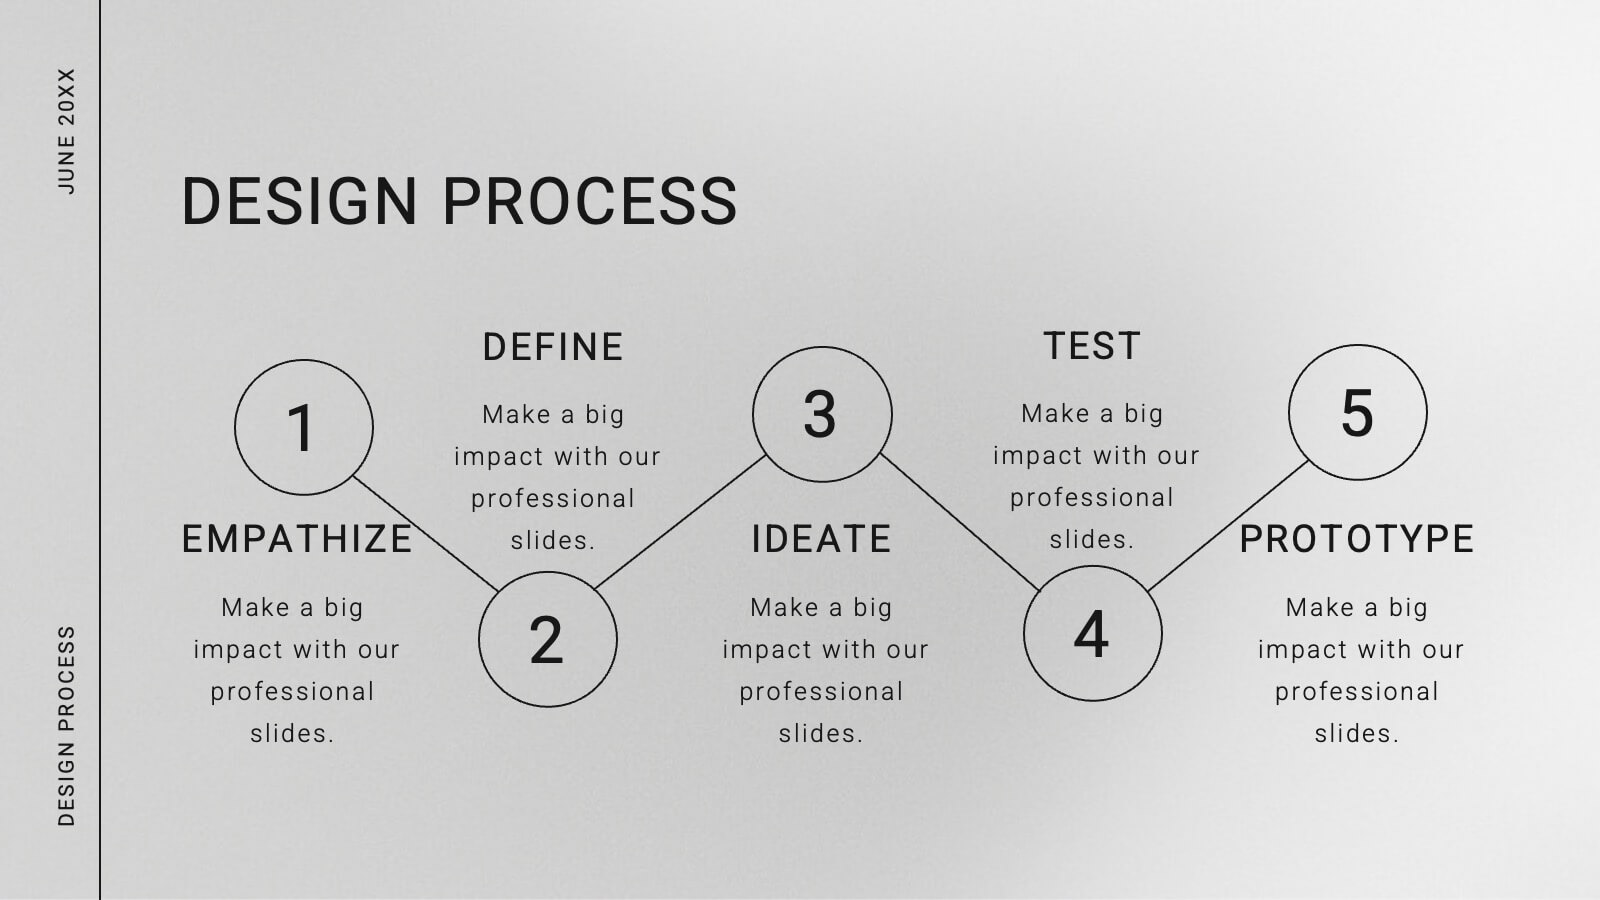
Empathy to Ideation Process Framework Presentation
Visualize the journey from understanding user needs to generating innovative ideas with the Empathy to Ideation Process Framework Presentation. This slide features a side-profile silhouette and five clear, horizontal stages, each representing a key step in design thinking. Ideal for innovation workshops, UX strategy sessions, or educational use. Fully editable in Canva, PowerPoint, Google Slides, and Keynote.