


Features
- 8 Unique Slides
- Fully editable and easy to edit in Microsoft Powerpoint, Keynote and Google Slides
- 16:9 widescreen layout
- Clean and professional designs
- Export to JPG, PDF or send by email


Do you have any questions?
Recommend


6 slides
Career Goals Infographic
Career goals refer to the professional objectives and aspirations that individuals set for themselves to achieve in their chosen careers. This infographic template serves as a powerful tool for individuals to map out their career aspirations, create a clear roadmap, and communicate their goals effectively. This template is designed to articulate and communicate your career aspirations and goals. This infographic provides a clear and organized overview of career objectives, steps for achieving those goals, and key milestones along the way. Compatible with Powerpoint, Keynote, and Google Slides.


6 slides
Defined Company Objectives Breakdown
Break down your company’s key priorities using this Defined Company Objectives slide. Featuring upward-pointing arrows from a central base, it visually maps out strategic goals in a clear, directional format. Fully customizable in PowerPoint, Keynote, and Google Slides.


21 slides
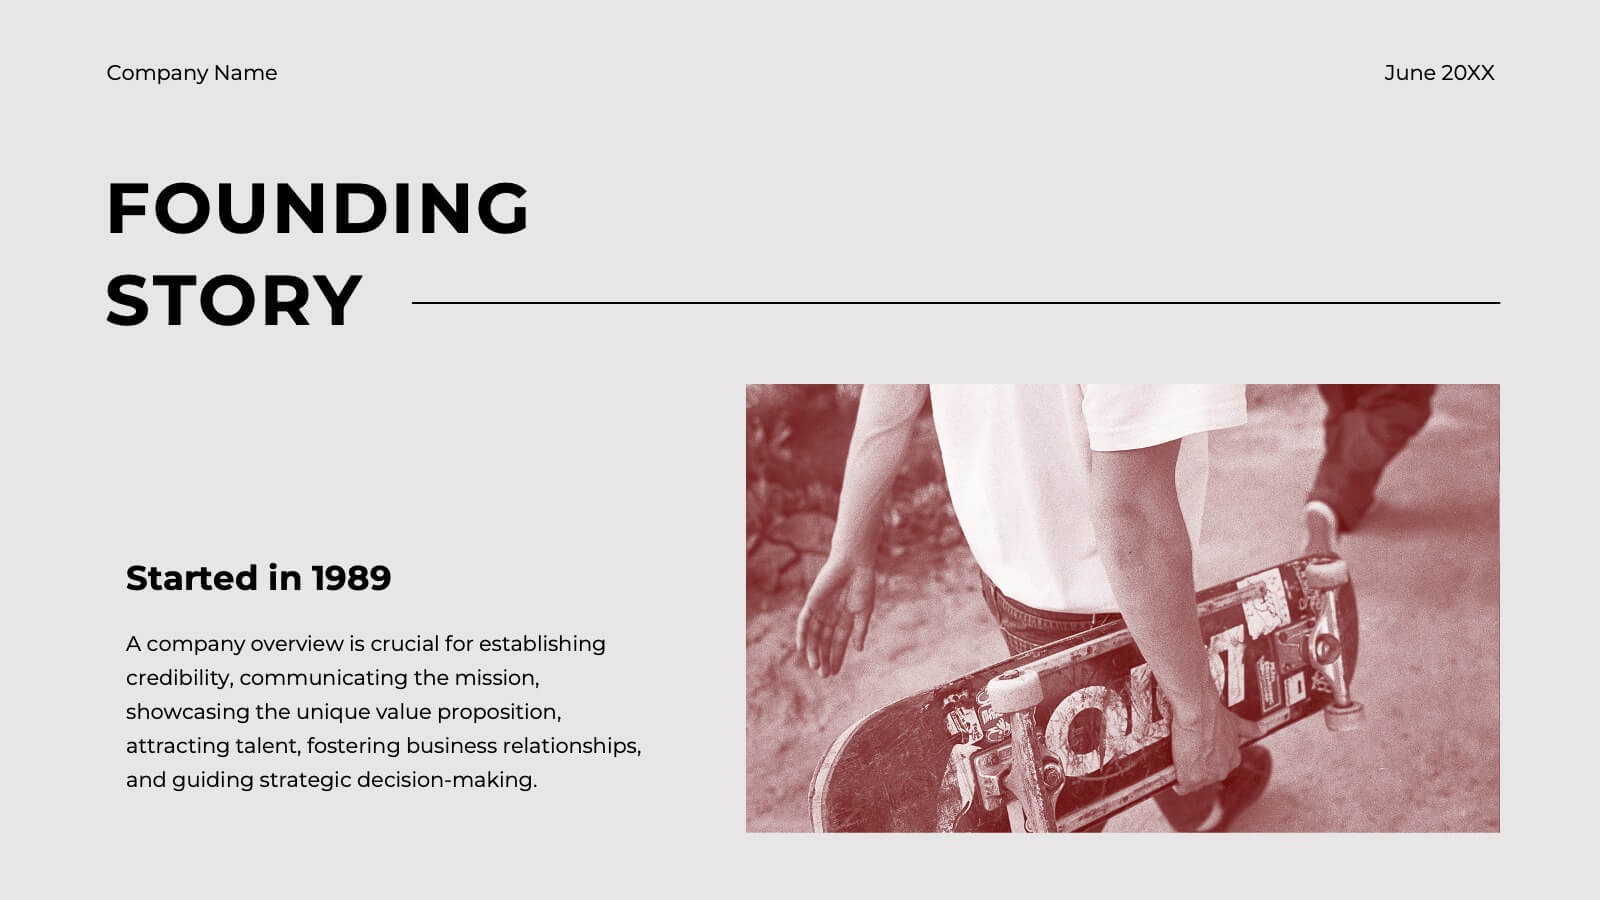
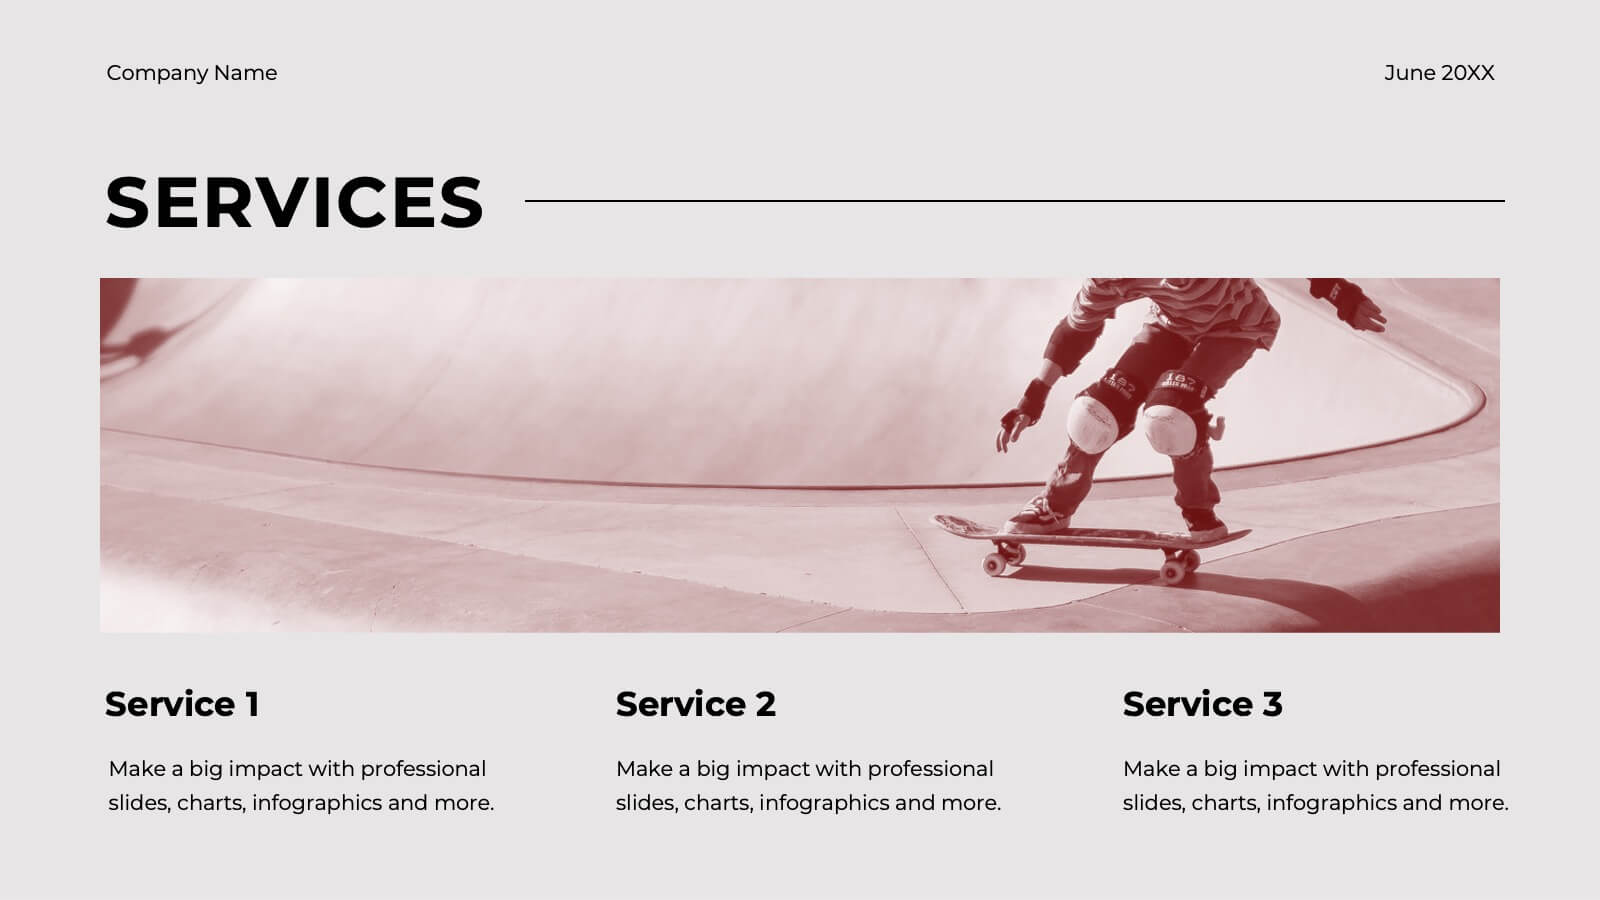
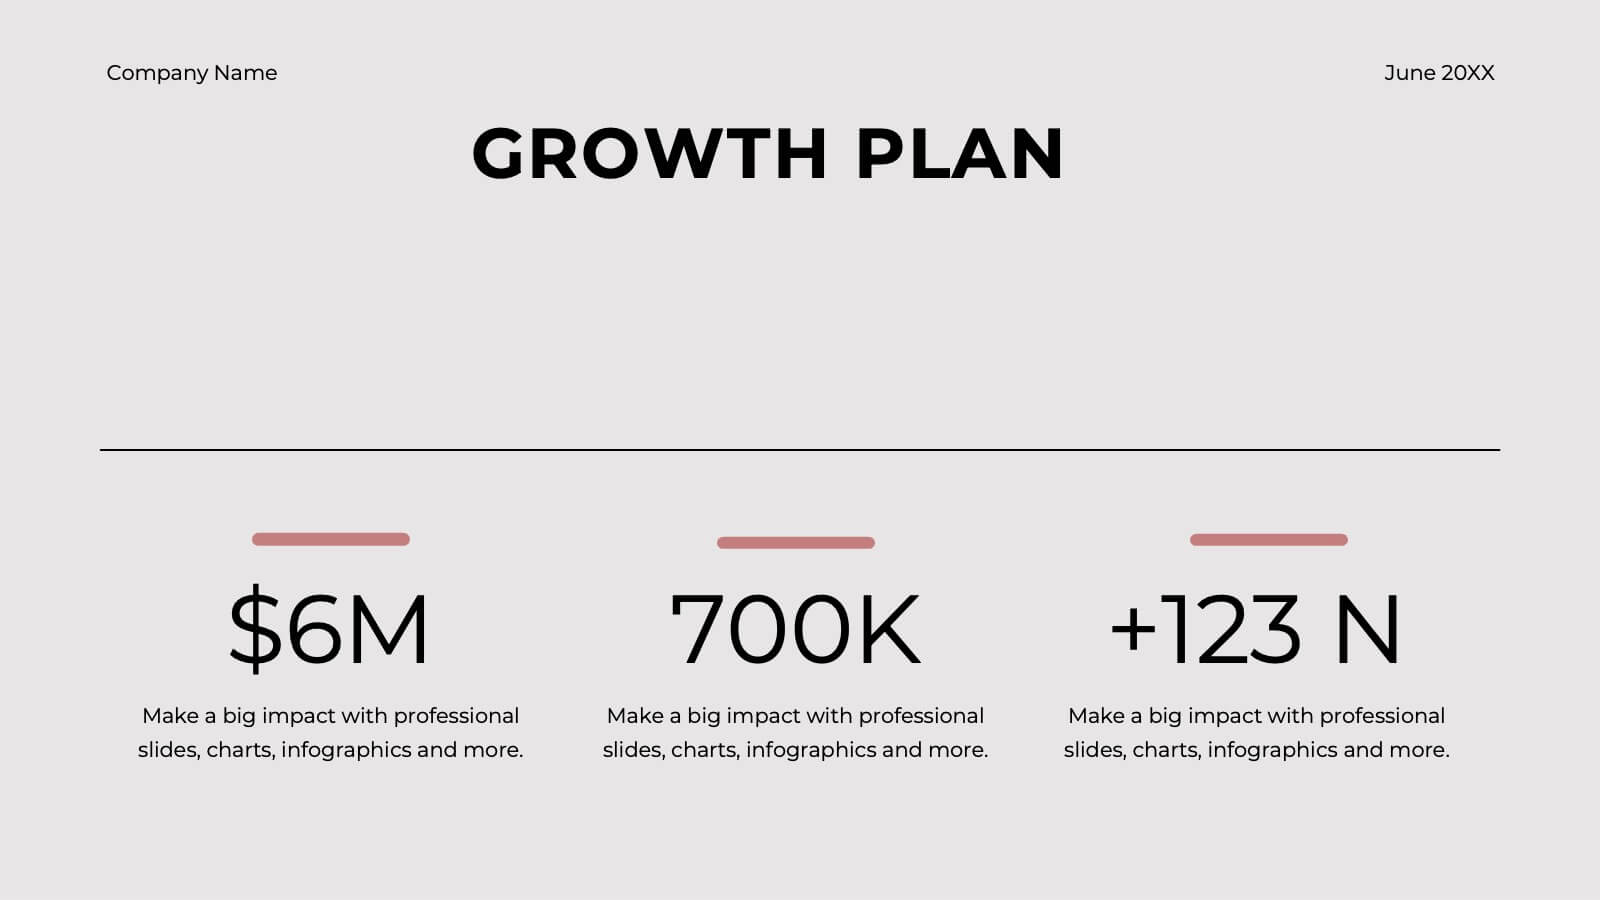
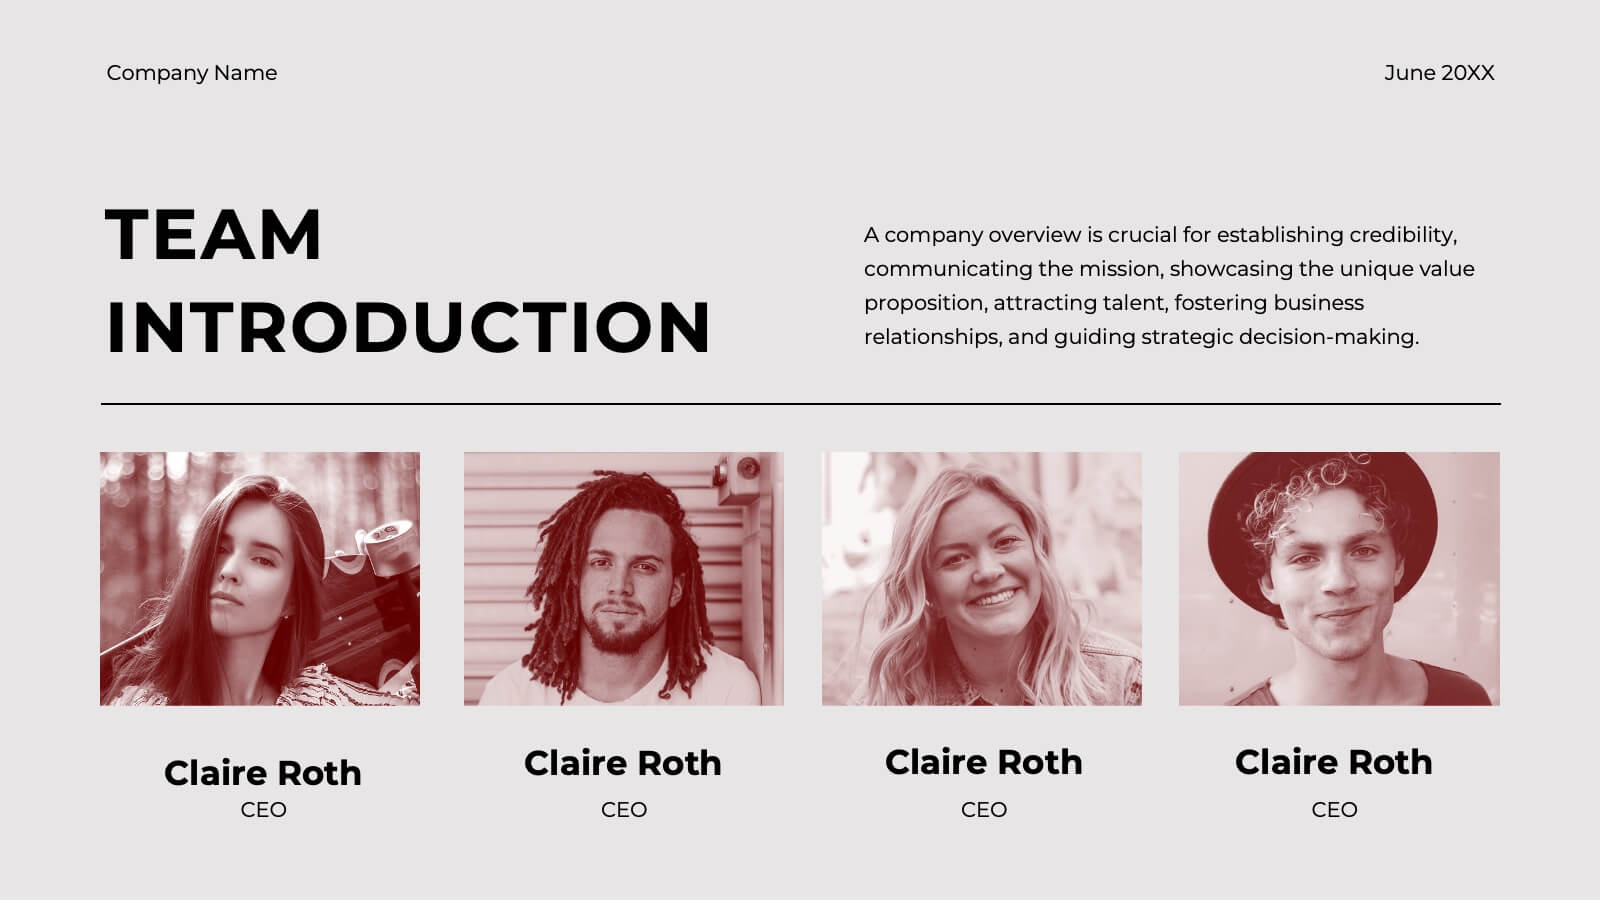
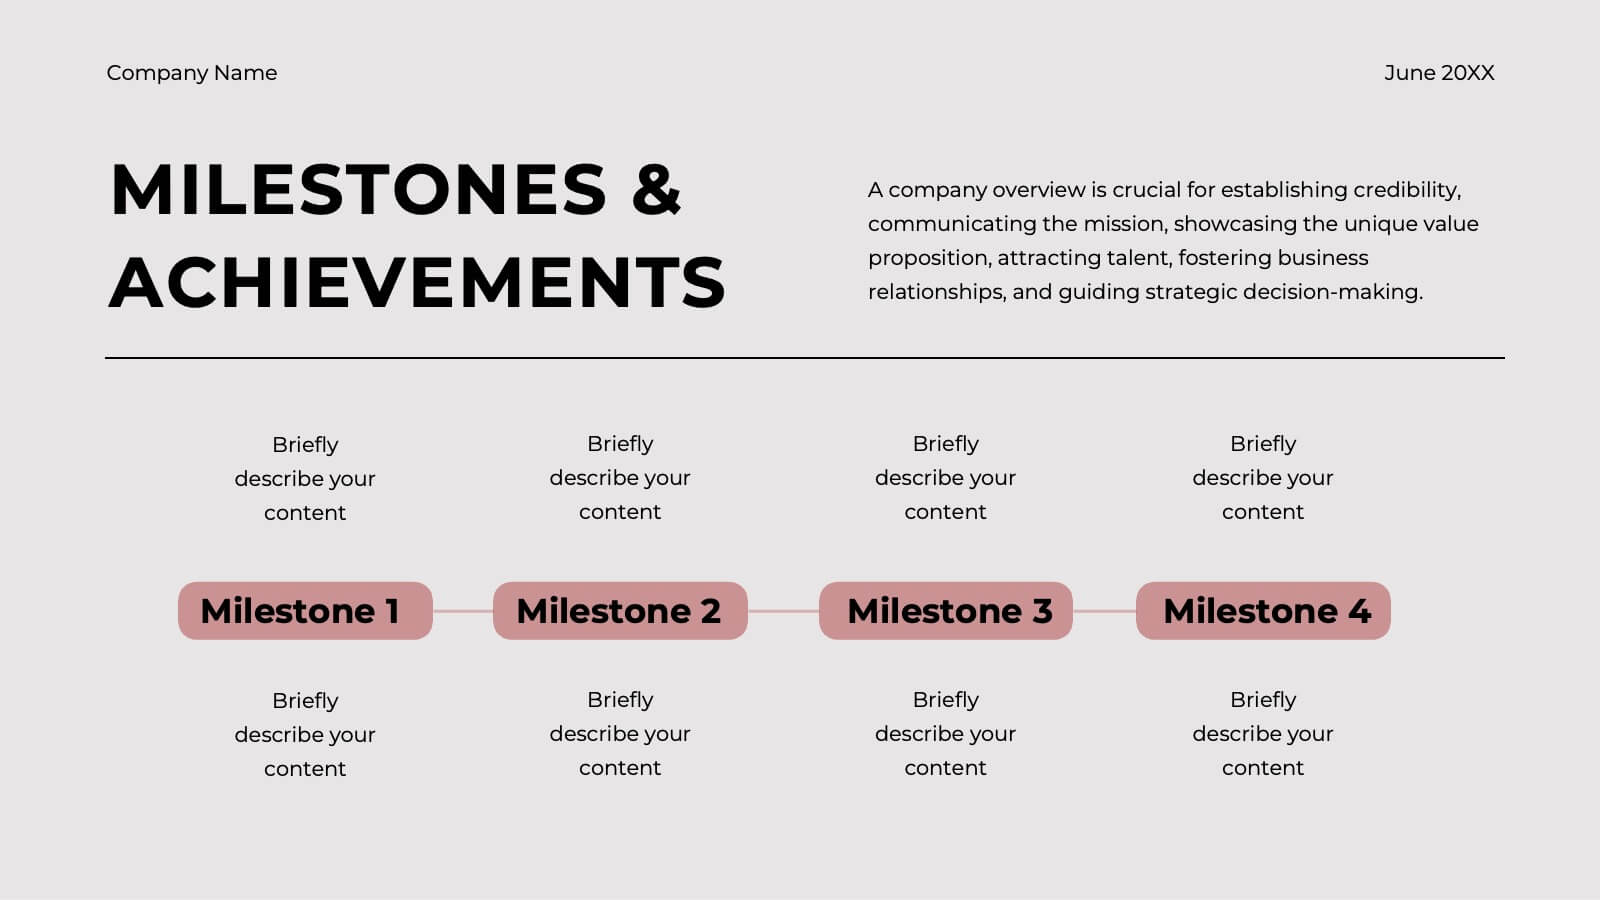
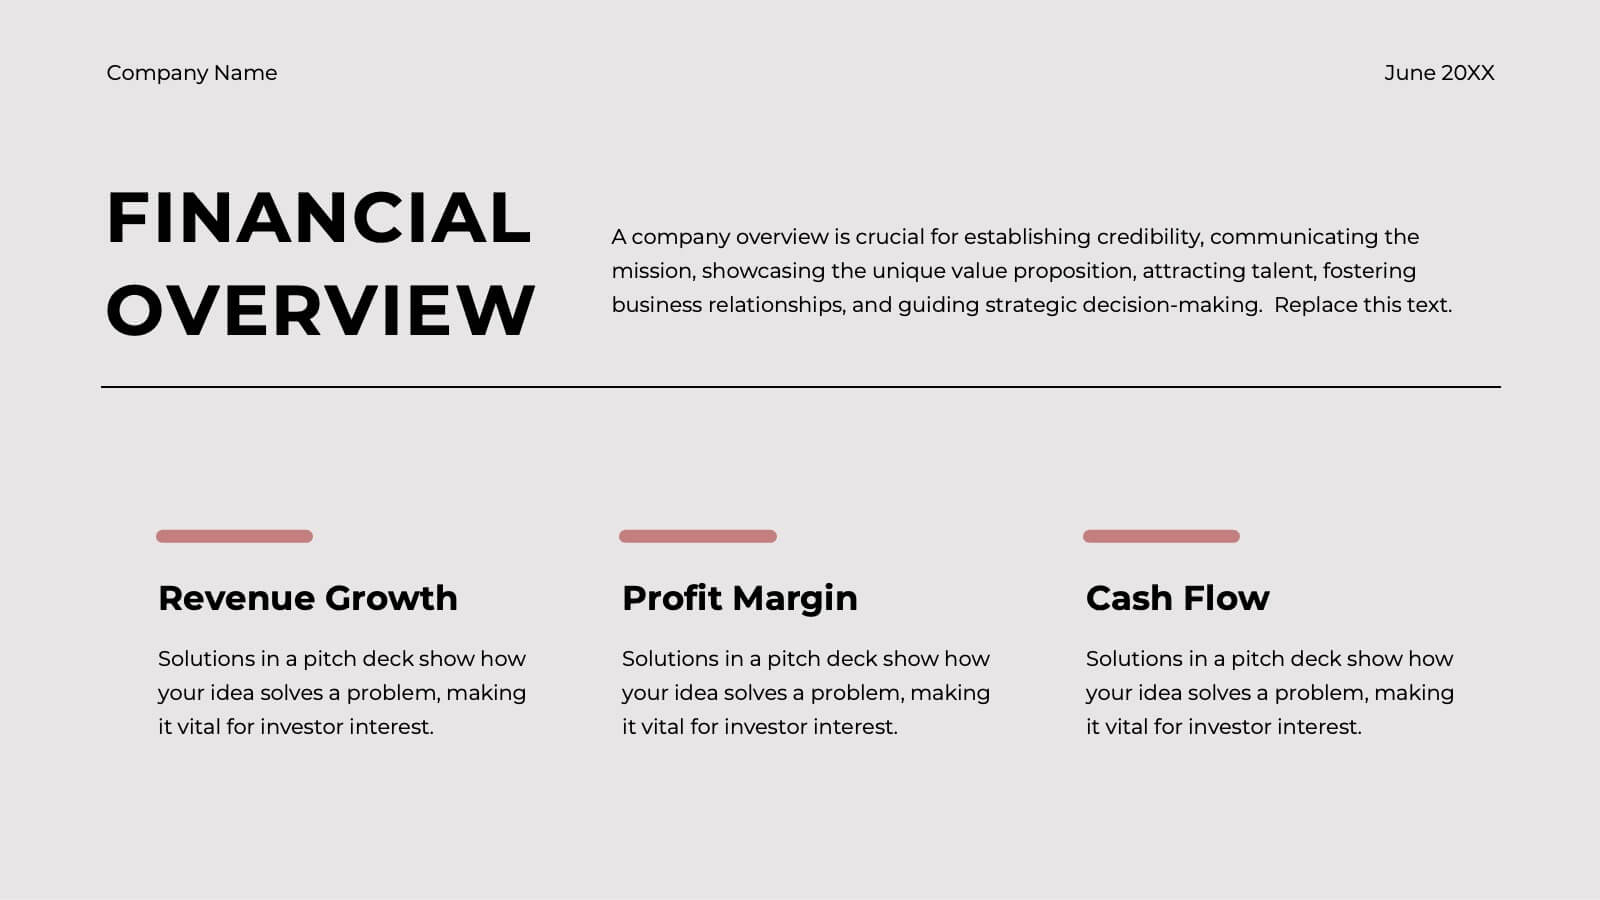
Ember Startup Growth Plan Presentation
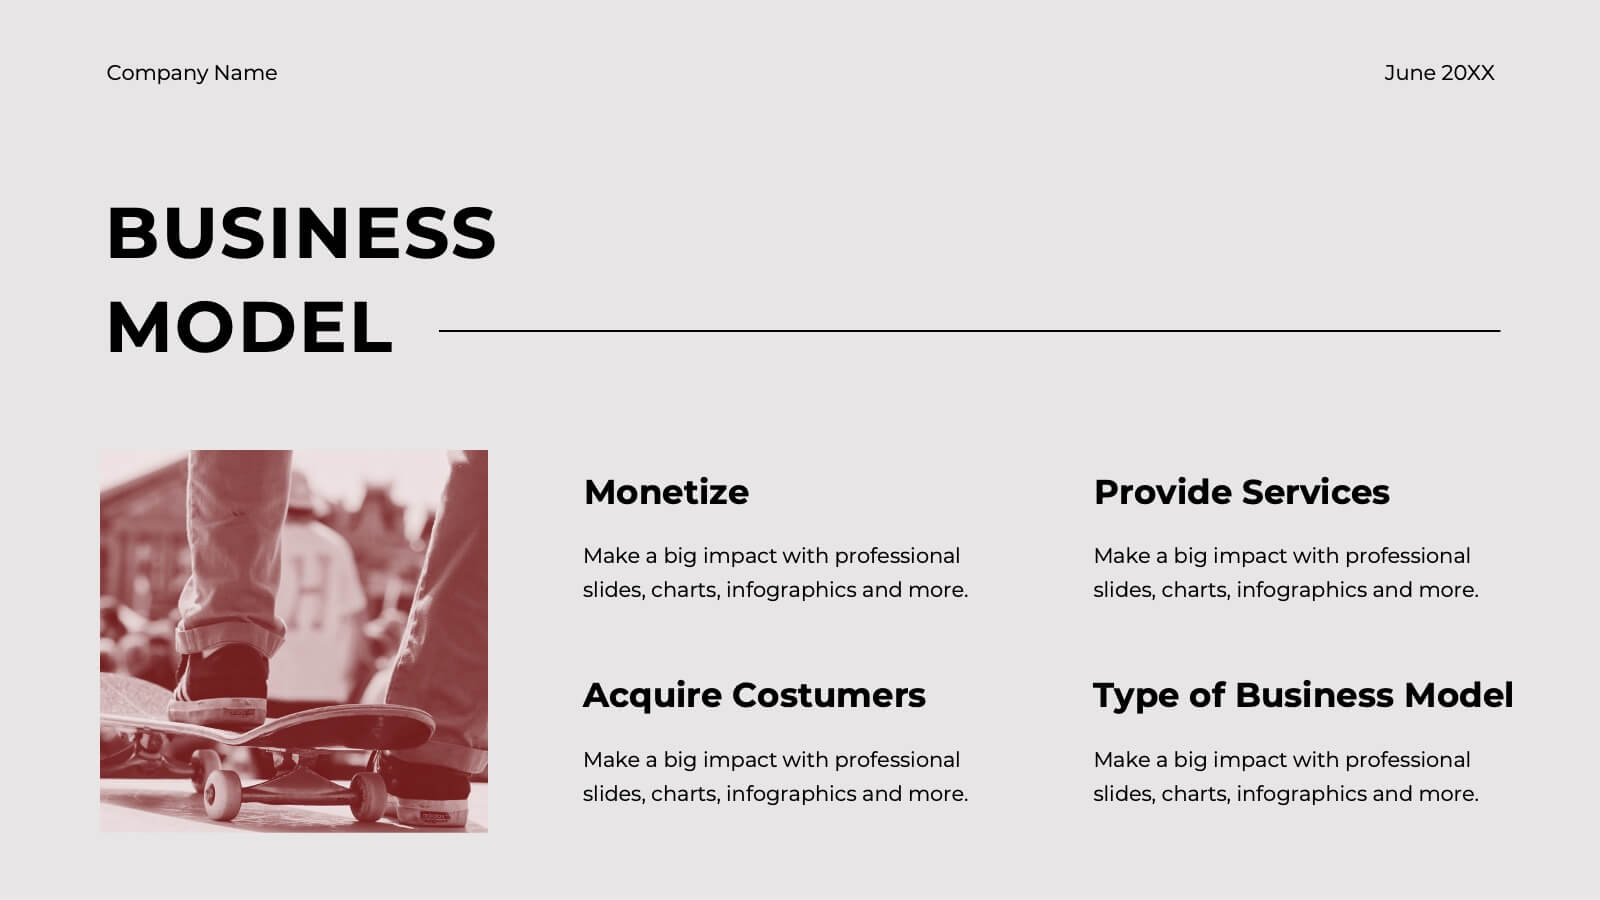
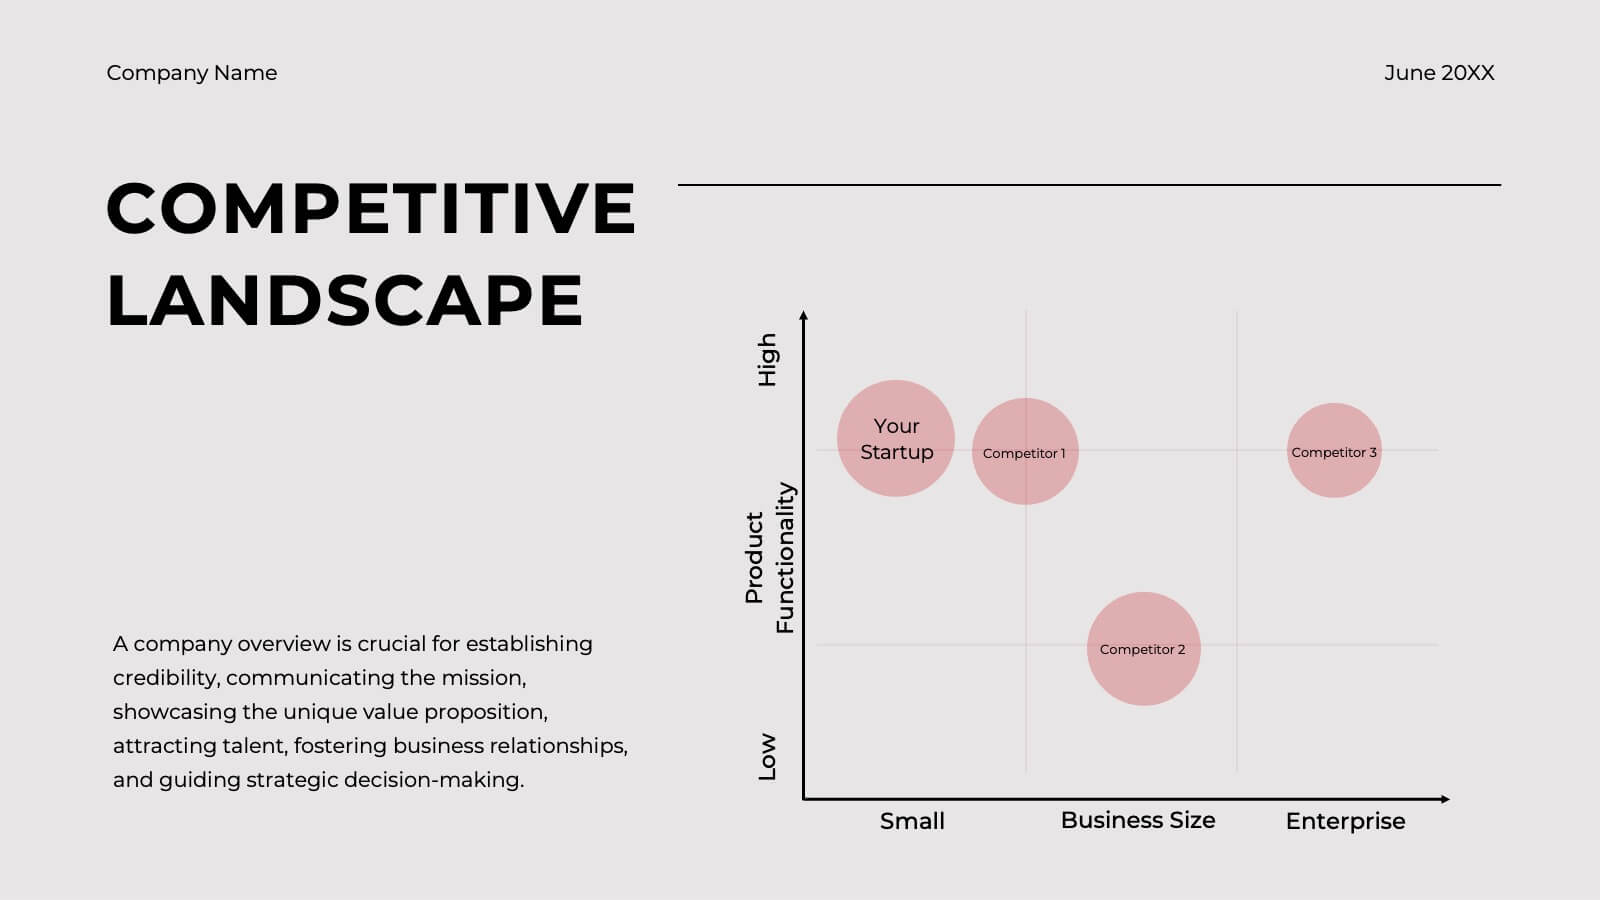
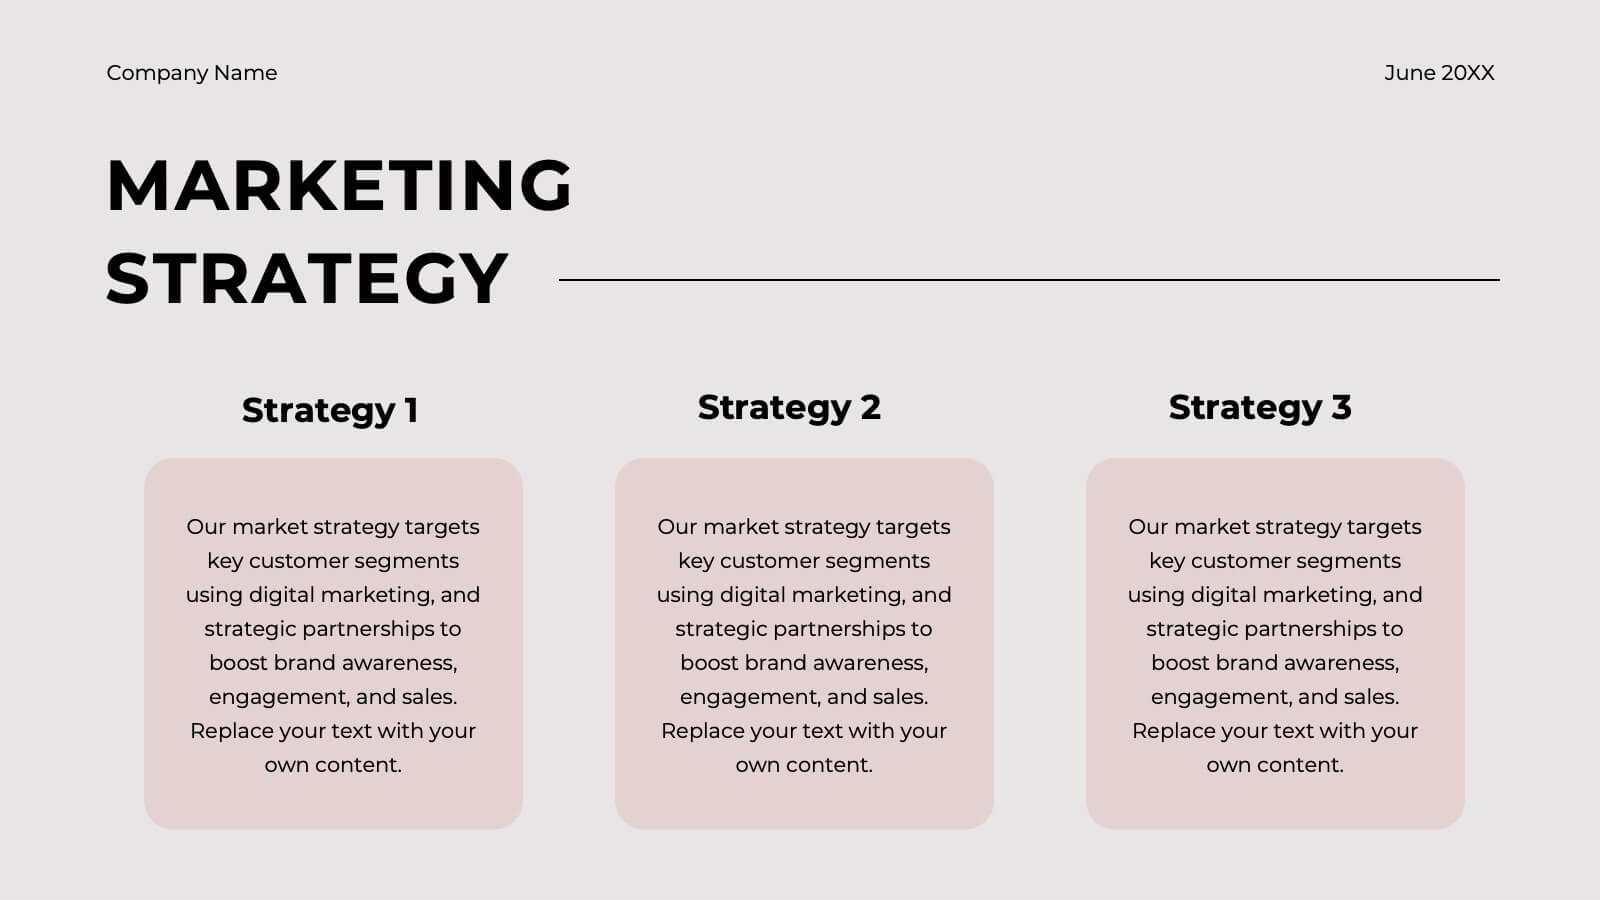
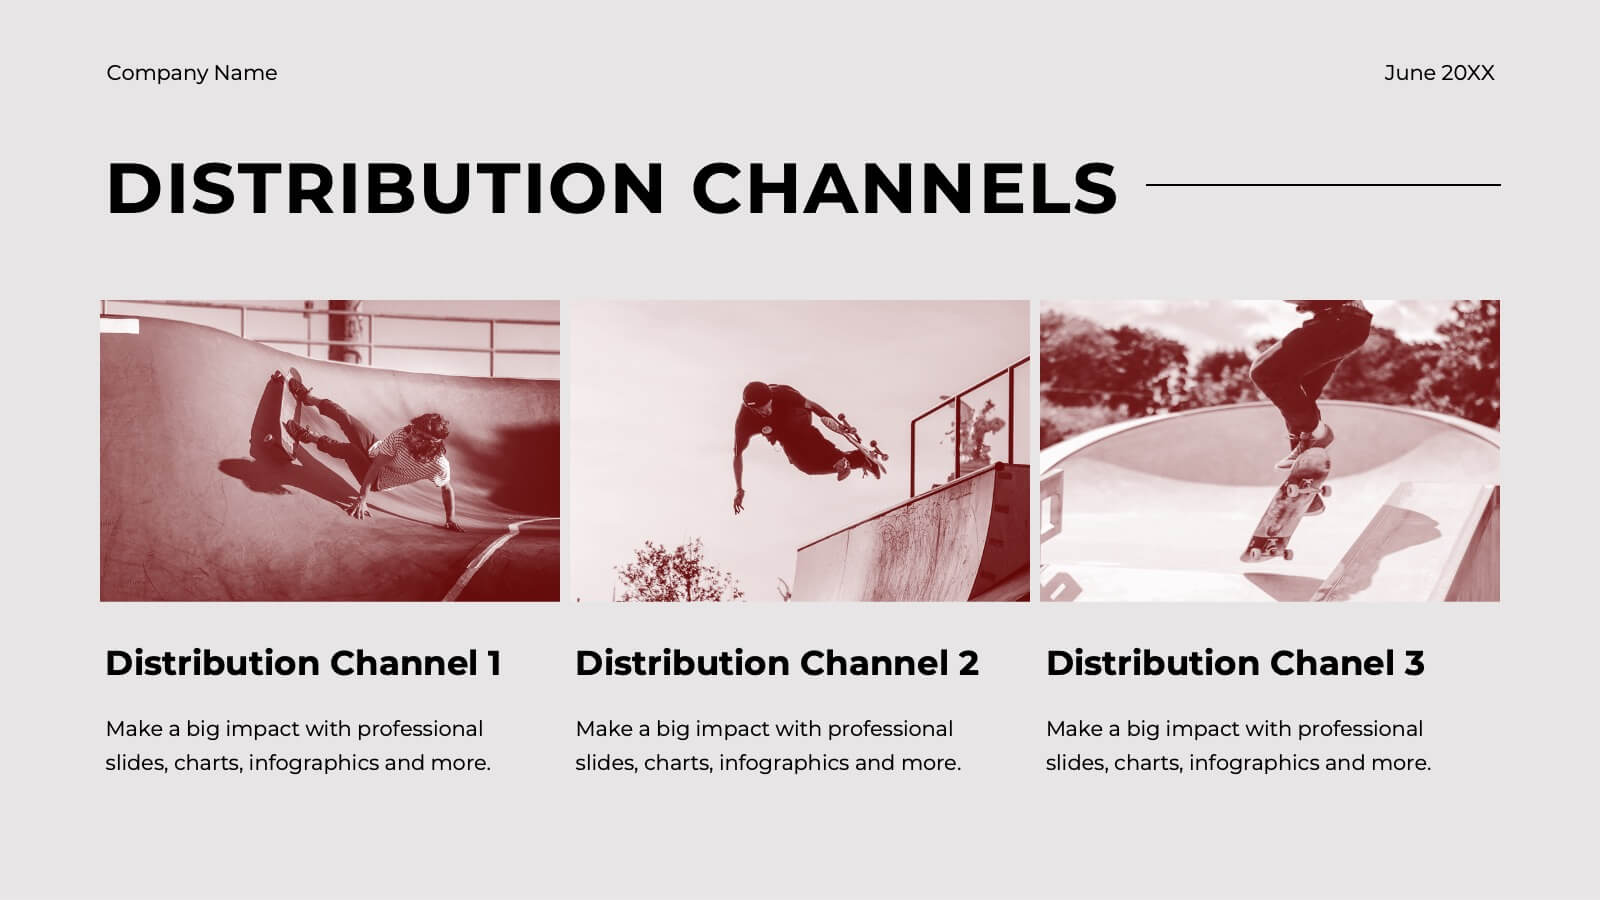
Launch your entrepreneurial journey with this dynamic startup plan template! Perfect for detailing your mission, market strategy, and unique value proposition, it features professional slides for customer analysis, business models, and financial projections. Present your innovative ideas clearly and convincingly. Compatible with PowerPoint, Keynote, and Google Slides for seamless presentations on any platform.


6 slides
Financial Trading and Stock Performance Presentation
Explore market dynamics with the "Financial Trading and Stock Performance" presentation template. Perfect for finance professionals, these slides offer a visual analysis of stock trends over the years. Featuring bar graphs and gauge charts for annual comparison, it's designed for impactful presentations. These templates are compatible with PowerPoint, Keynote, and Google Slides, enhancing their accessibility across different platforms.


7 slides
Competitive Analysis Using Strategy Wheel
Highlight your competitive edge with this dynamic strategy wheel diagram. Designed to visually compare up to six business components, this slide is ideal for showcasing strengths, weaknesses, or market positioning. Perfect for strategic planning sessions, it’s fully editable in PowerPoint, Keynote, and Google Slides.


6 slides
Project Rollout Milestone Timeline Presentation
Visually map out your project phases with the Project Rollout Milestone Timeline Presentation. Featuring a modern cylinder path layout, this slide is perfect for showcasing five key milestones in sequential or strategic order. Ideal for project managers and teams, and fully editable in Canva, PowerPoint, Keynote, and Google Slides.


22 slides
Blaze Business Operations Plan Presentation
Elevate your business presentations with this elegant, modern template designed for comprehensive business operations. Perfect for covering themes, objectives, workshops, and panel discussions, it ensures a professional and engaging delivery. The clean design and structured layout enhance clarity and impact. Compatible with PowerPoint, Keynote, and Google Slides, it’s versatile for any platform.


5 slides
Real-Life Case Study Analysis Presentation
Turn data and insights into compelling stories that capture real business impact. This clean, professional layout is perfect for analyzing real-world examples, comparing strategies, and presenting key takeaways. Easy to customize and visually balanced, it’s fully compatible with PowerPoint, Keynote, and Google Slides for seamless use across platforms.


4 slides
Task and Role Allocation Matrix
Clarify team responsibilities with this modern Task and Role Allocation Matrix. Easily visualize who is Responsible, Accountable, Contributing, and Informed for each task. Ideal for team leaders, HR planners, and project coordinators. Fully customizable in PowerPoint, Keynote, and Google Slides.


20 slides
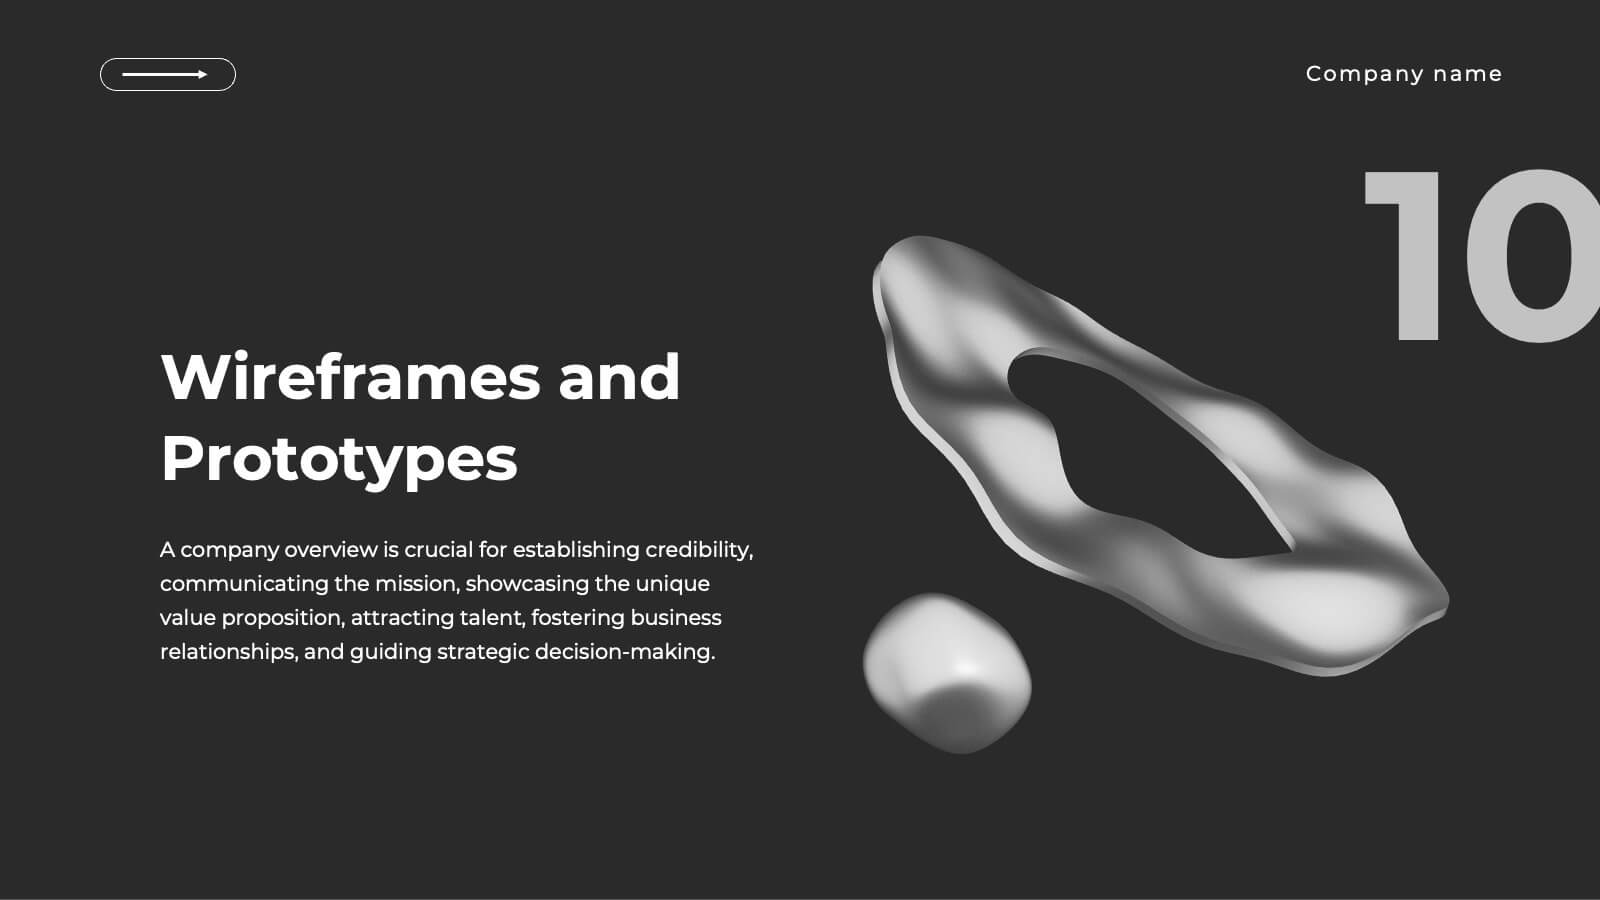
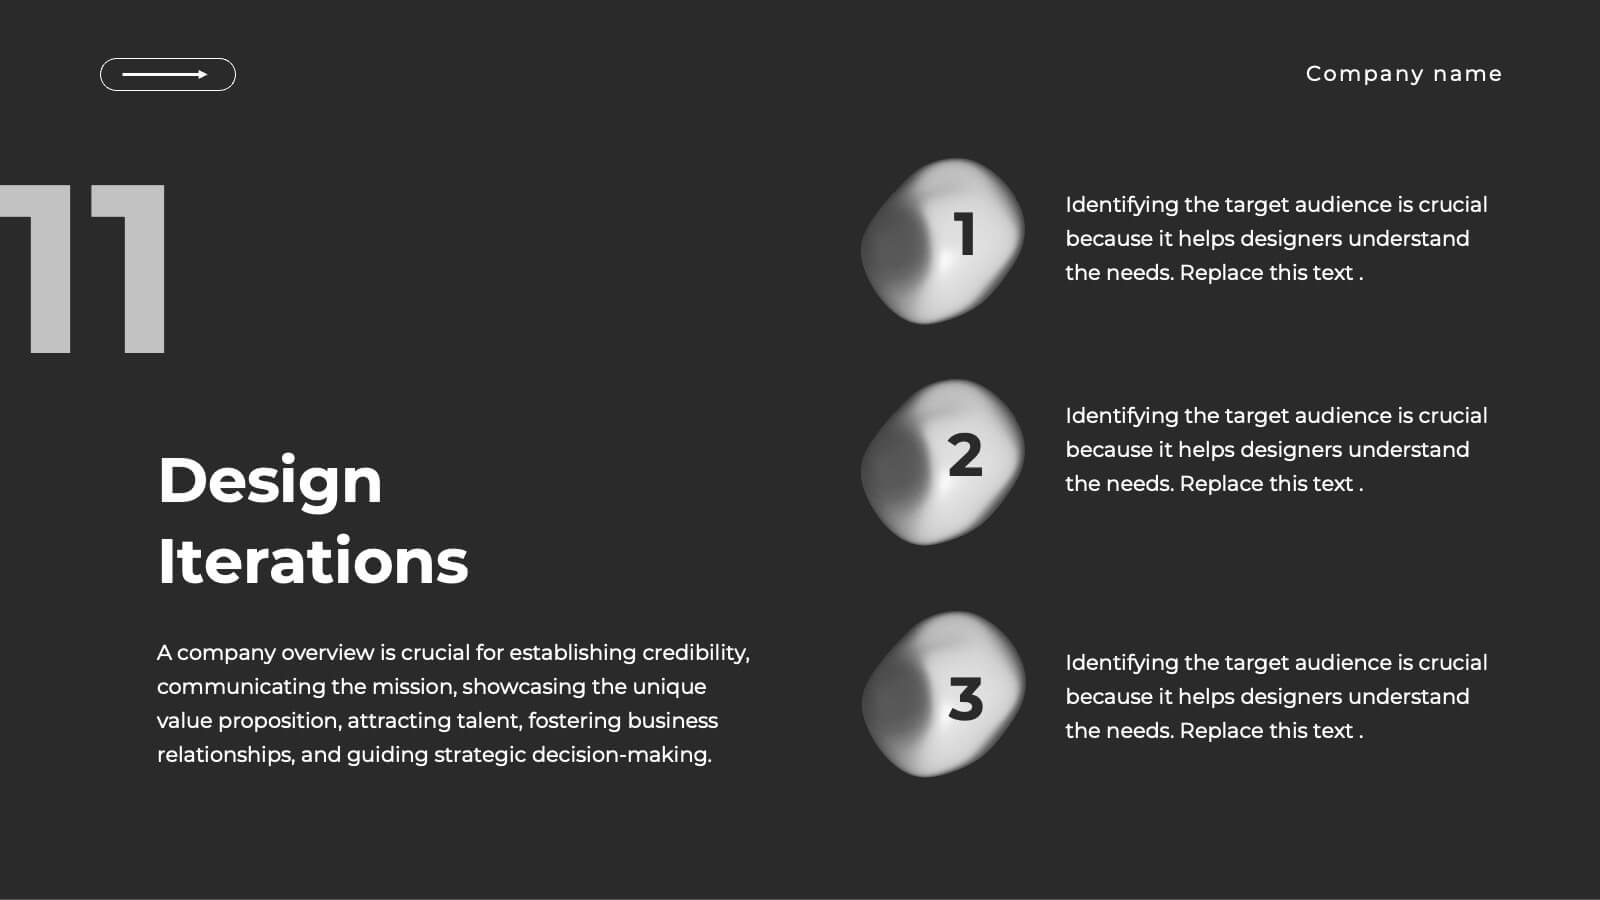
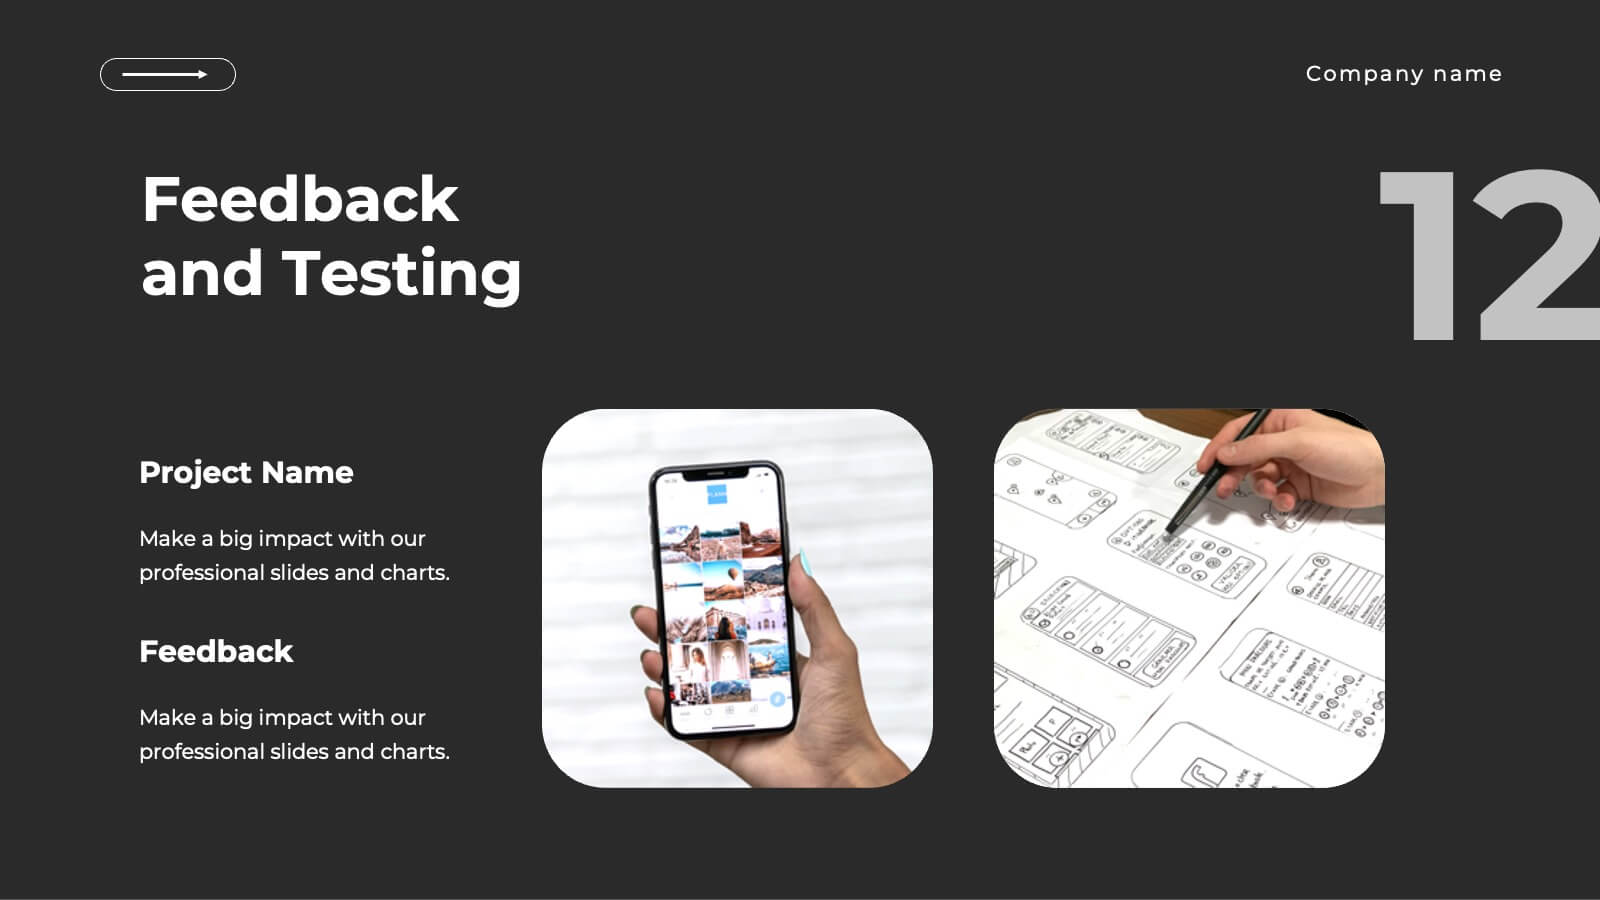
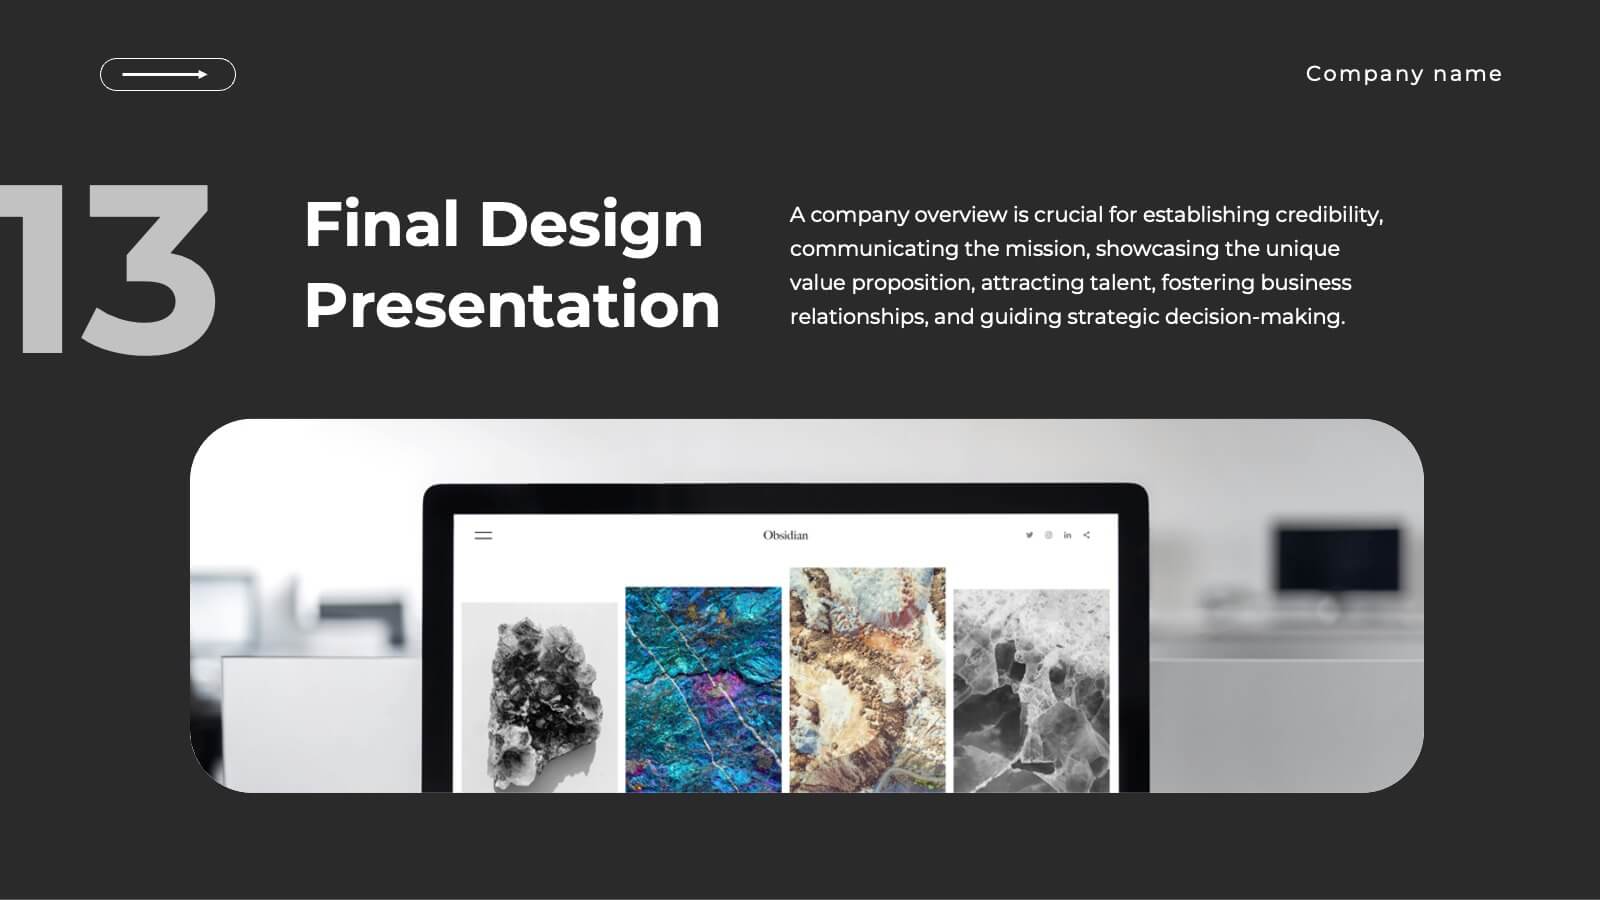
Realm UX UI Design Pitch Deck Presentation
Present your UX/UI design process with this sleek and modern design template! It covers everything from concept development to wireframes, prototypes, design iterations, and final design presentation. Fully customizable and compatible with PowerPoint, Keynote, and Google Slides, it’s perfect for design teams and professionals looking to showcase their creative process effectively.


5 slides
Country Data Mapping in South America Presentation
Present data with impact using the Country Data Mapping in South America Presentation. This clean, professional slide highlights key statistics across up to five countries using labeled connectors, icons, and a gradient-based map. Ideal for showcasing regional growth, KPIs, or operational breakdowns across South America. Fully editable and compatible with PowerPoint, Keynote, Google Slides, and Canva.


5 slides
Tiered Strategy Framework Pyramid Presentation
Break down your plan into clear, actionable steps with this Tiered Strategy Framework Pyramid presentation. Each arrow-shaped tier helps visualize hierarchical strategies, workflows, or growth levels. Use this layout to communicate priorities, initiatives, or milestones in a sleek and modern format. Fully editable in Canva, PowerPoint, or Google Slides.


5 slides
Business Pillars for Success Presentation
Present your organization's core values or strategic foundations with this column-style infographic. Each pillar represents a distinct success factor, ideal for visualizing business frameworks, goals, or leadership principles. Fully editable in PowerPoint, Keynote, or Google Slides to match your brand and message.


3 slides
Sustainabilitiy Management Plan Framework Presentation
Turn your sustainability goals into a clear, actionable plan with this dynamic presentation design. Ideal for showcasing environmental strategies, performance metrics, and corporate responsibility initiatives, it combines clarity with visual balance to engage audiences. Fully editable and compatible with PowerPoint, Keynote, and Google Slides for seamless customization and delivery.


6 slides
Editable Puzzle Infographic
Piece together complex data with our Editable Puzzle Infographic, compatible with Powerpoint, Google Slides, and Keynote. This engaging infographic is designed to help presenters visually connect different pieces of information in a cohesive and understandable way. The puzzle pieces are a metaphor for how individual components fit into a larger strategy or concept, making it perfect for collaborative projects or educational models. The infographic is fully customizable, allowing you to adapt the colors, text, and arrangement to fit your specific needs. With this puzzle infographic, you can make your presentations more interactive ensuring your audience can see the big picture every time.


5 slides
Sex Education in Schools Infographics
Navigating the sensitive topic of sex education becomes approachable and comprehensible with our sex education in schools infographics template. Cast in shades of understanding purple and a spectrum of relatable colors, this creative yet educational tool is a boon for educators and advocacy groups. It simplifies complex concepts into visuals, fostering an environment of learning and open dialogue. Compatible with Powerpoint, Keynote, and Google Slides. The template features instructive graphics and discrete icons, curated specifically to aid in the delicate task of imparting sex education with respect, care, and factual accuracy.


7 slides
AIDA Interest Model Infographic
The AIDA Interest Model is a cornerstone in marketing and sales, guiding professionals through the stages of Attention, Interest, Desire, and Action. Our infographic, bathed in hues of purple, green, blue, and yellow, brings this classical model to life in a refreshing and engaging manner. With a fun, yet informative style, it elucidates each phase, making it a go-to resource for marketers, salespersons, and educators alike. Whether you're training a team, educating students, or crafting a persuasive pitch, this infographic will elevate your presentation. It's fully compatible with PowerPoint, Keynote, and Google Slides.