


Features
- 4 Unique slides
- Fully editable and easy to edit in Microsoft Powerpoint, Keynote and Google Slides
- 16:9 widescreen layout
- Clean and professional designs
- Export to JPG, PDF or send by email


Do you have any questions?
Recommend


5 slides
Operational Process Mapping Presentation
Visualize complex workflows with this operational process mapping template, designed with four vertical sections for step-by-step clarity. Ideal for business operations, SOPs, and project management, it features clean flowchart elements for structured planning. Fully editable in Canva, PowerPoint, or Google Slides, ensuring easy customization for any industry or organizational process.


6 slides
Future Trends in Tech Presentation
Forecast innovation with clarity using this Future Trends in Tech Presentation. Designed with a modern silhouette head and brain visualization, this slide emphasizes key trend comparisons using icon-labeled callouts and bold percentage highlights. Ideal for tech forecasting, AI adoption, or market prediction topics. Fully editable in PowerPoint, Keynote, and Google Slides—available in both light and dark modes.


4 slides
Social Media Analytics Dashboard Presentation
Easily monitor and report on your content performance with the Social Media Analytics Dashboard Presentation. This sleek, modular layout combines key metrics like items, uploads, comments, and feeds with a vertical bar chart to visualize insights across platforms. Ideal for campaign reviews, stakeholder updates, or team reporting. Fully customizable in PowerPoint, Keynote, and Google Slides.


6 slides
Process Flow in Wheel Format Presentation
Showcase cyclical processes and step-by-step workflows with this Process Flow in Wheel Format. This dynamic, circular diagram is perfect for illustrating ongoing operations, development cycles, or organizational stages. Each section is clearly labeled and color-coded for easy customization. Fully editable in PowerPoint, Keynote, and Google Slides — ideal for operations managers, project leads, and consultants.


6 slides
Business Strategy Pyramid Presentation
Outline your strategic priorities with clarity using the Business Strategy Pyramid Presentation. This template features a five-step 3D pyramid that highlights key business goals, initiatives, or stages. Each layer includes icons and numbered sections for easy interpretation. Ideal for strategy meetings, executive briefings, and growth plans. Fully editable in PowerPoint, Keynote, and Google Slides.


4 slides
Social Media and Online Marketing Trends
Showcase emerging strategies with this mobile-inspired layout perfect for social media and online marketing updates. The clean design highlights trends like SEO, influencer marketing, and content innovation with clarity. Fully customizable and compatible with PowerPoint, Keynote, and Google Slides.


22 slides
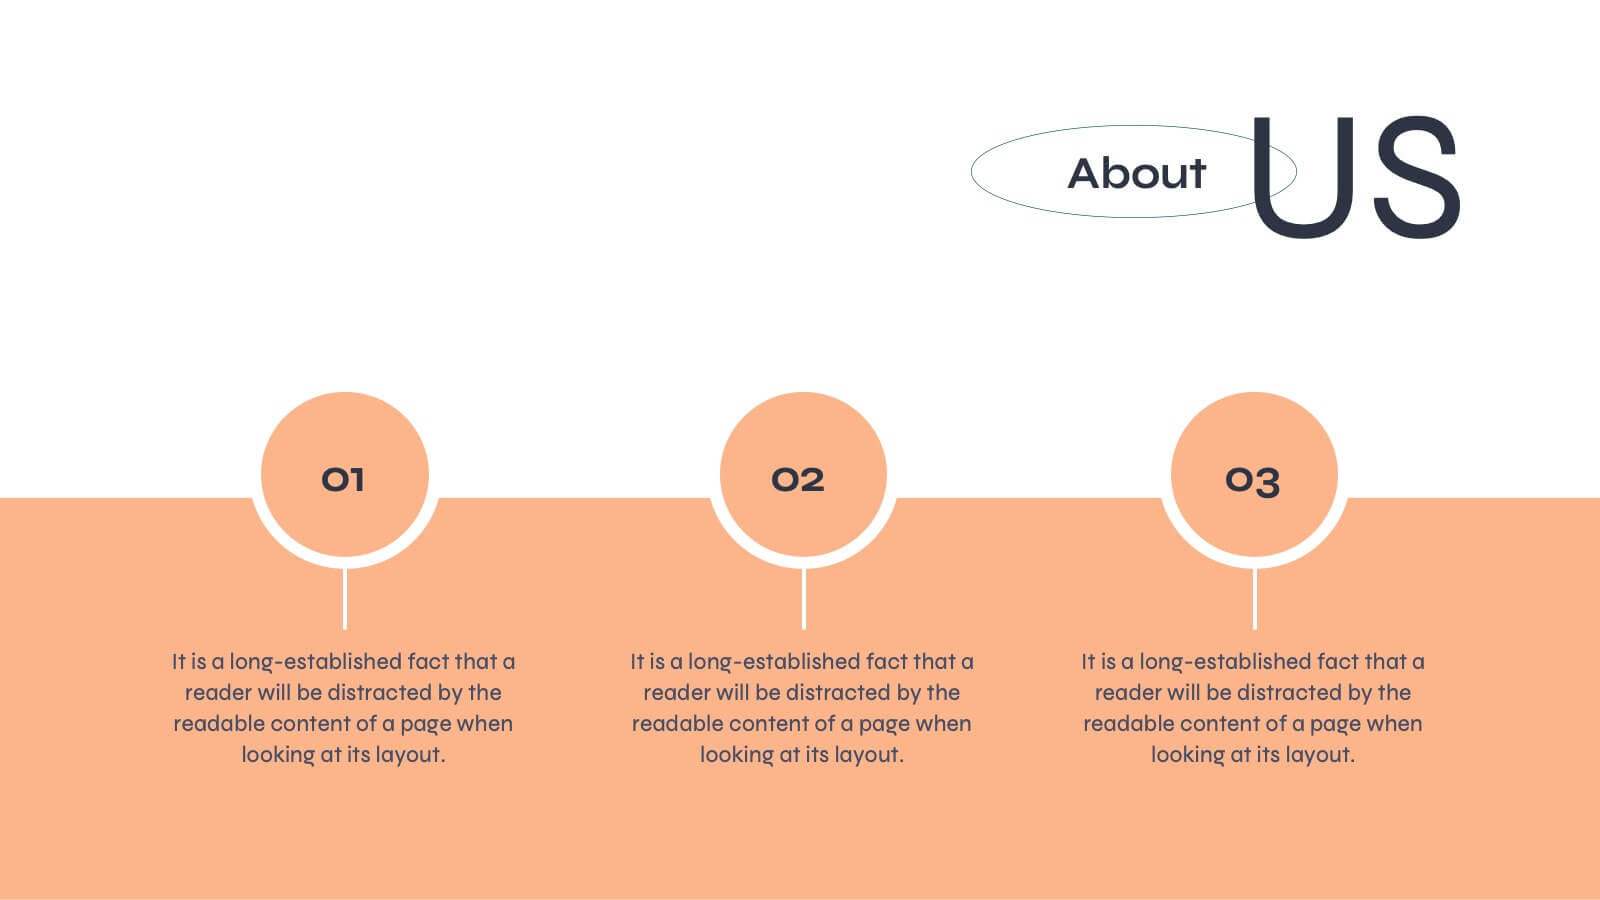
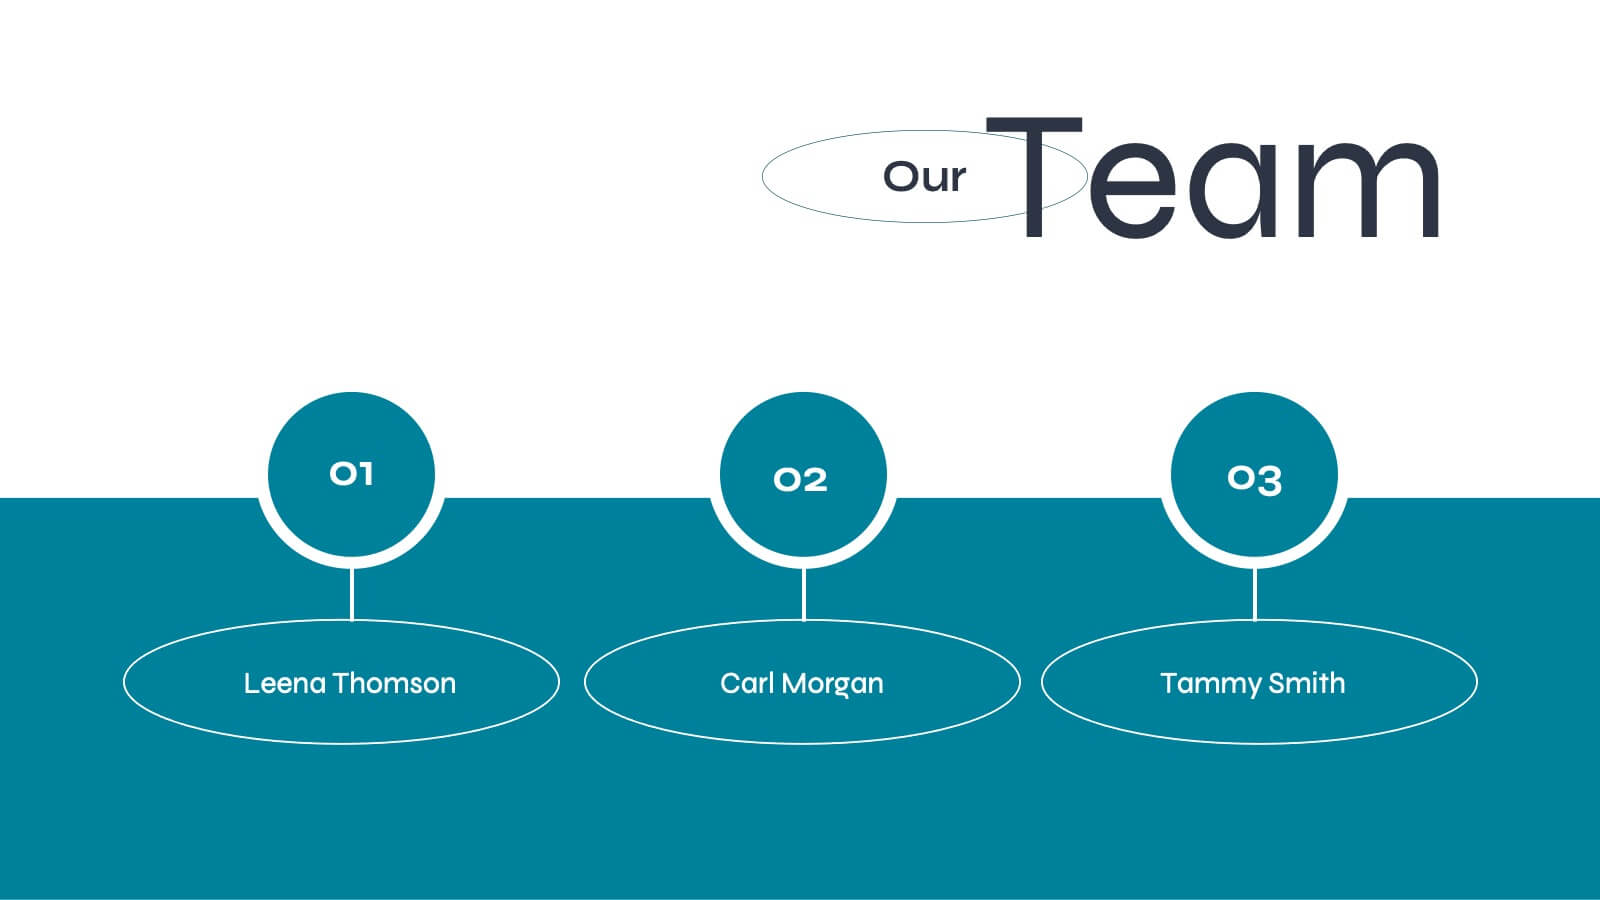
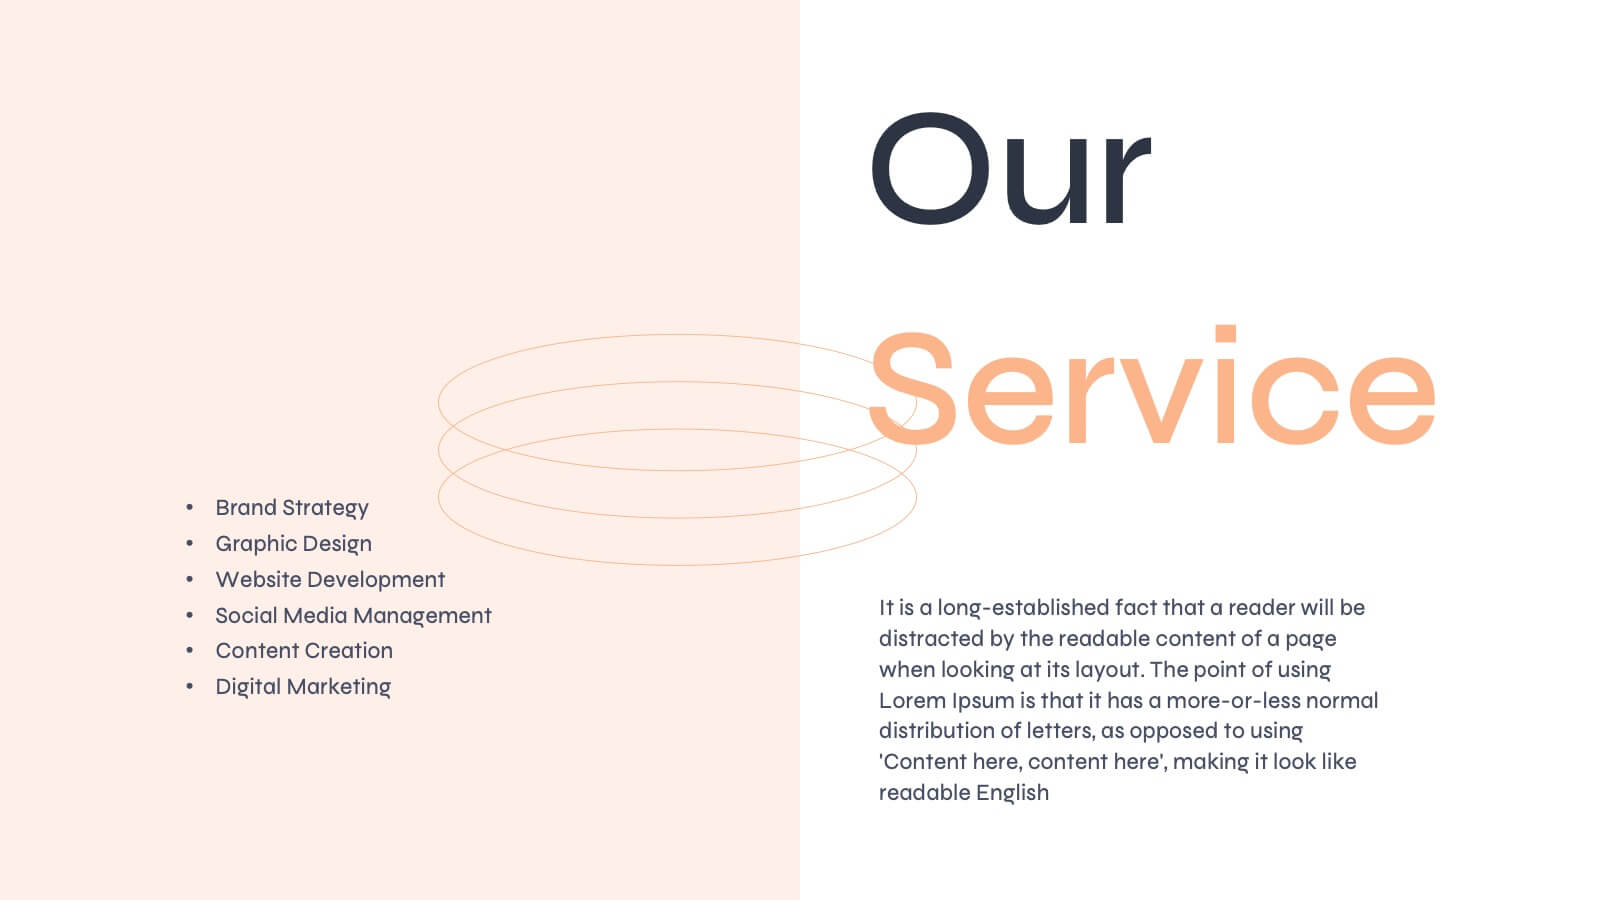
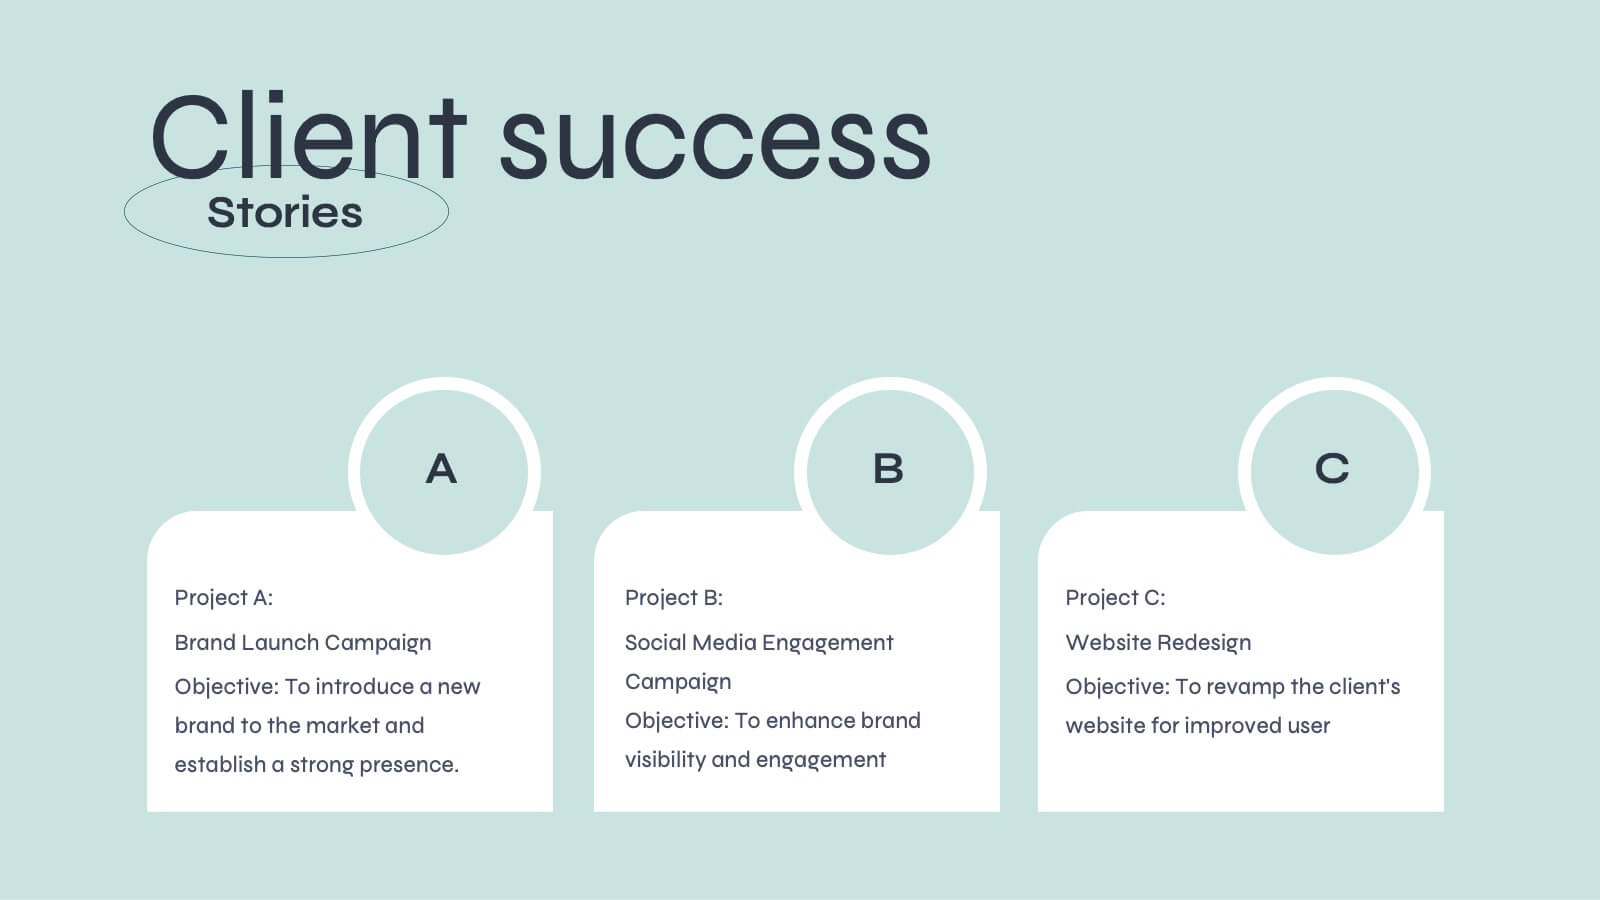
Aurora Agency Portfolio Presentation
Showcase your agency's strengths with this polished, modern presentation template. Perfect for presenting market analysis, client success stories, and creative processes, it features a clean and professional design. Highlight your team's expertise and strategic approach to impress potential clients. Compatible with PowerPoint, Keynote, and Google Slides, it ensures seamless presentations on any platform.


5 slides
Environment News Infographics
Dive into the pressing issues of our times with environment news infographics. Crafted in shades of a serene blue palette, this collection is designed for environmental activists and journalists. It stands out with its creative, vertical style, making it perfect for detailed storytelling and comprehensive data representation related to environmental news and studies. Compatible with Powerpoint, Keynote, and Google Slides. The template features innovative graphics, icons, and image placeholders, all customizable to highlight ecological statistics, climate change advancements, or conservation efforts, making complex information accessible and engaging.


4 slides
End-to-End Supply Chain Optimization Presentation
Streamline your logistics strategy with this modern End-to-End Supply Chain Optimization slide. Featuring bold vector icons representing production, automation, and distribution, this layout clearly visualizes key supply chain stages. Ideal for presenting operations flow, logistics planning, or manufacturing improvements. Fully customizable in PowerPoint, Keynote, and Google Slides for seamless integration into your business deck.


4 slides
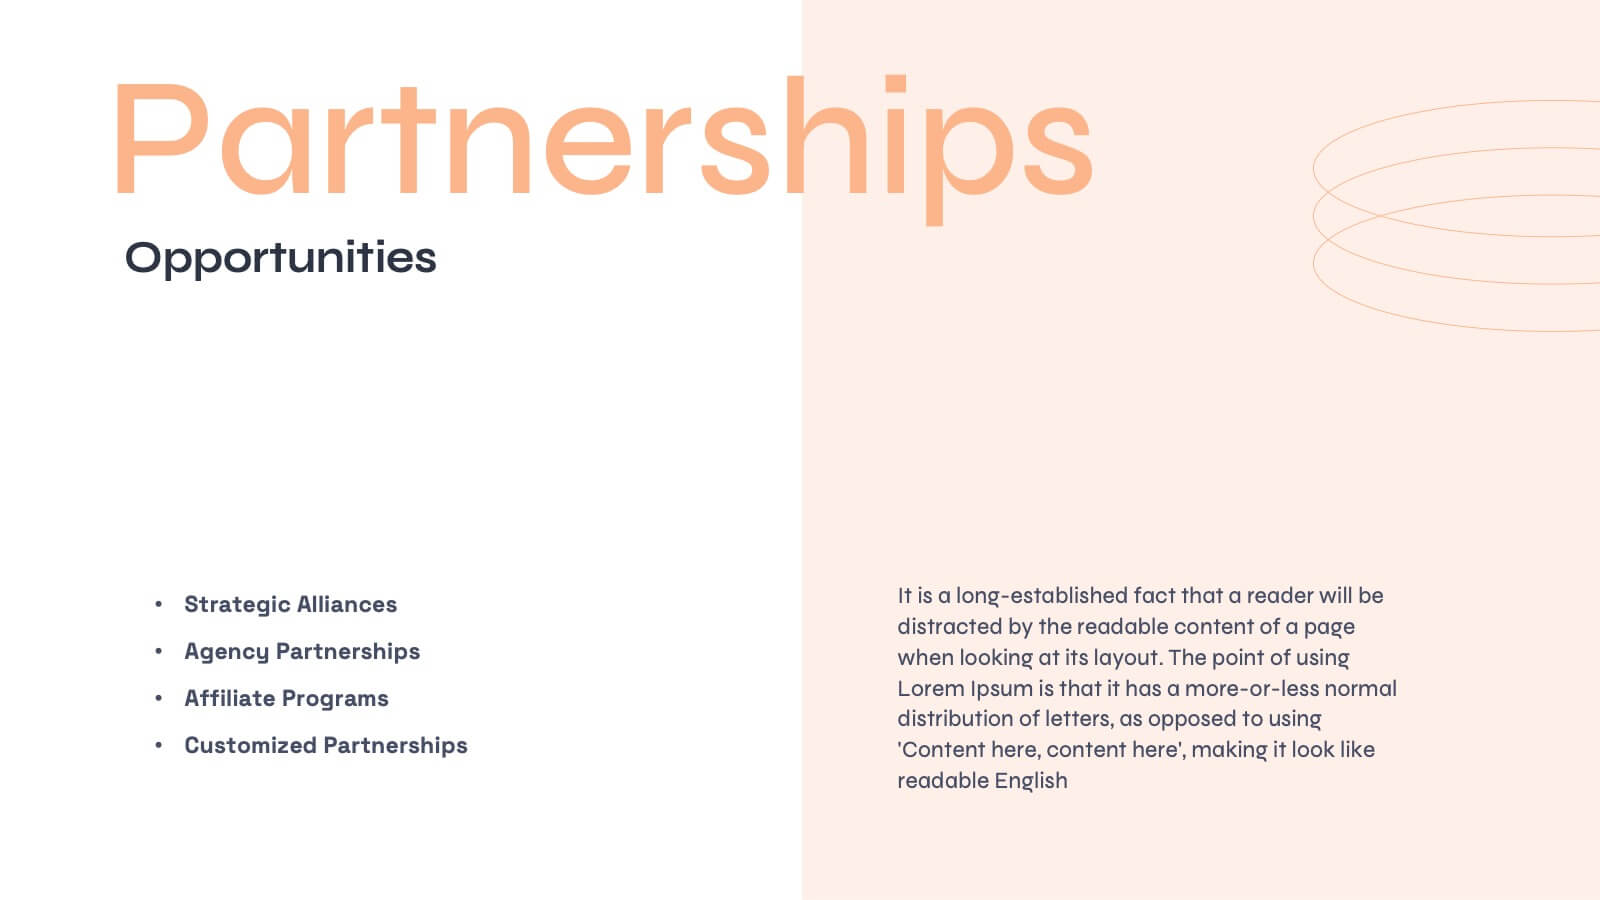
Partnership and Collaboration Strategy
Showcase how your partnerships and alliances fuel business success with this clean, puzzle-themed diagram. Ideal for mapping collaboration stages, joint ventures, and strategic partner roles. Fully editable in PowerPoint, Keynote, and Google Slides to fit your brand and strategic message seamlessly.


3 slides
Stock Market Performance Overview Presentation
Showcase financial growth like a pro with this clean, data-driven layout designed to visualize performance, market activity, and business progress over time. Ideal for professionals presenting key financial trends, metrics, or strategies. Fully compatible with PowerPoint, Keynote, and Google Slides for easy customization and professional presentation results.


8 slides
End-to-End Project Lifecycle Management Presentation
Visualize each phase of your project lifecycle with this clean, circular flow layout. Ideal for showcasing planning, execution, and delivery stages in a structured loop. Each segment is fully editable to match your content. Compatible with PowerPoint, Google Slides, and Keynote for effortless customization and professional results.


5 slides
Safety Compliance Overview Presentation
Keep your organization protected and compliant with this modern and visual presentation design. Ideal for outlining safety protocols, training programs, and regulatory standards, it helps simplify complex processes into clear, engaging visuals. Fully customizable and compatible with PowerPoint, Keynote, and Google Slides for professional and polished presentations.


7 slides
Business People Networking Infographic
Networking is the lifeblood of any thriving business. Our business people networking infographic, designed in a pristine white backdrop with striking orange highlights and sophisticated black nuances, encapsulates the essence of professional connections and collaborations. It provides a visual representation of how relationships can foster growth, open opportunities, and catalyze success. Tailored for business leaders, conference organizers, and networking event planners, this template offers a compelling narrative of networking's power. Fully optimized, it's compatible with leading presentation platforms: PowerPoint, Keynote, and Google Slides.


3 slides
Stock Market Investment Analysis Presentation
Unlock the secrets of the stock market with our "Stock Market Investment Analysis" presentation templates. Ideal for financial analysts and investors, these templates provide a clear framework for analyzing trends and making informed decisions. With easy-to-edit elements and professional design, they are perfect for delivering compelling investment insights. Compatible with PowerPoint, Keynote, and Google Slides, they ensure your analysis looks sharp and persuasive across all platforms.


6 slides
Circular Wheel Diagram Presentation
Bring motion and balance to your ideas with this clean, circular design that connects every element in a seamless flow. Ideal for showcasing continuous processes, team dynamics, or strategic cycles, it keeps your message clear and engaging. Fully compatible with PowerPoint, Keynote, and Google Slides for easy editing.


5 slides
Real Estate Market Infographics
The Real Estate Market refers to the buying, selling, and renting of properties, including residential, commercial, and industrial properties. These infographic templates are a valuable tool for real estate professionals, investors, or anyone interested in understanding and presenting key information about the real estate market. With its visually appealing design and informative content it provides an overview of the real estate market and serves as a powerful visual aid for presentations or reports. Showcase key data and trends in the real estate market. It is compatible with PowerPoint, Keynote, and Google Slides.