


Features
- 6 Unique slides
- Fully editable and easy to edit in Microsoft Powerpoint, Keynote and Google Slides
- 16:9 widescreen layout
- Clean and professional designs
- Export to JPG, PDF or send by email


Do you have any questions?
Recommend


6 slides
Leadership Development Infographics
Foster leadership growth with our Leadership Development infographic template. This template is fully compatible with popular presentation software like PowerPoint, Keynote, and Google Slides, allowing you to easily customize it to illustrate and communicate various aspects of leadership development. The Leadership Development infographic template offers a visually engaging platform to explore and explain the principles, strategies, and practices related to nurturing leadership skills within individuals and organizations. Whether you're an HR professional, business leader, educator, or aspiring leader, this template provides a user-friendly canvas to create informative presentations and educational materials. Enhance your knowledge of Leadership Development with this SEO-optimized infographic template, thoughtfully designed for clarity and ease of use. Customize it to highlight key leadership competencies, training methods, coaching approaches, and the impact of effective leadership on organizational success. Ensure that your audience gains valuable insights into the world of leadership development. Start crafting your personalized infographic today to empower leadership growth.


4 slides
Step-by-Step 30-60-90 Milestones Presentation
Present clear onboarding or strategic progressions with the Step-by-Step 30-60-90 Milestones Presentation. This layout is ideal for showcasing phased plans, goal tracking, and employee integration milestones over time. Each segment highlights a distinct 30-, 60-, and 90-day focus, helping visualize stepwise achievement clearly. Fully editable in PowerPoint, Keynote, and Google Slides.
20 slides
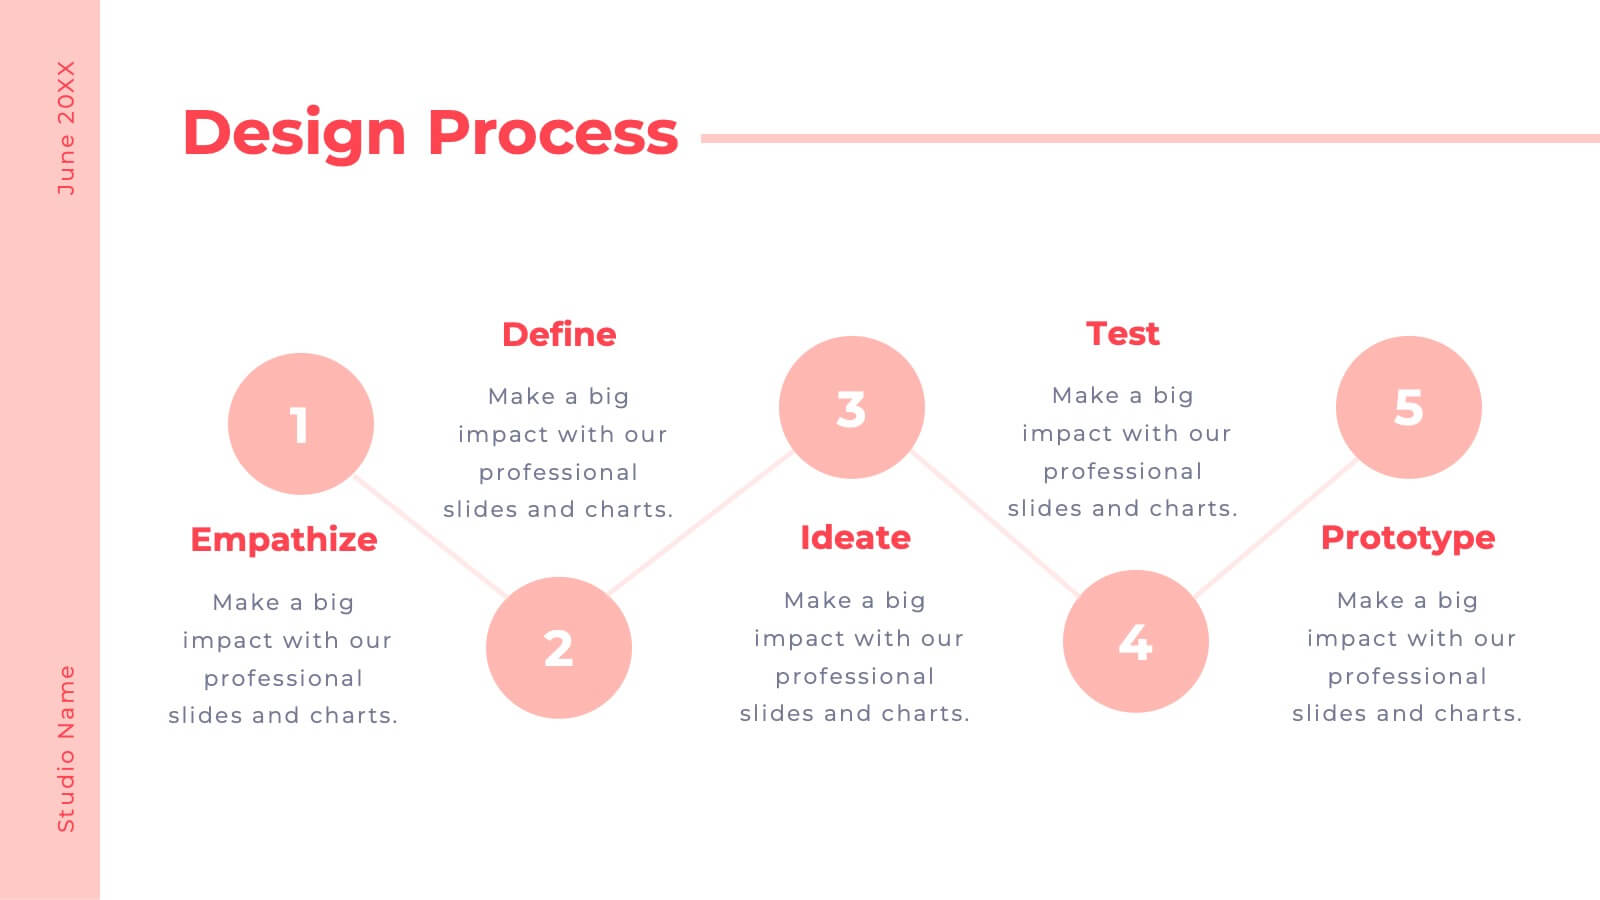
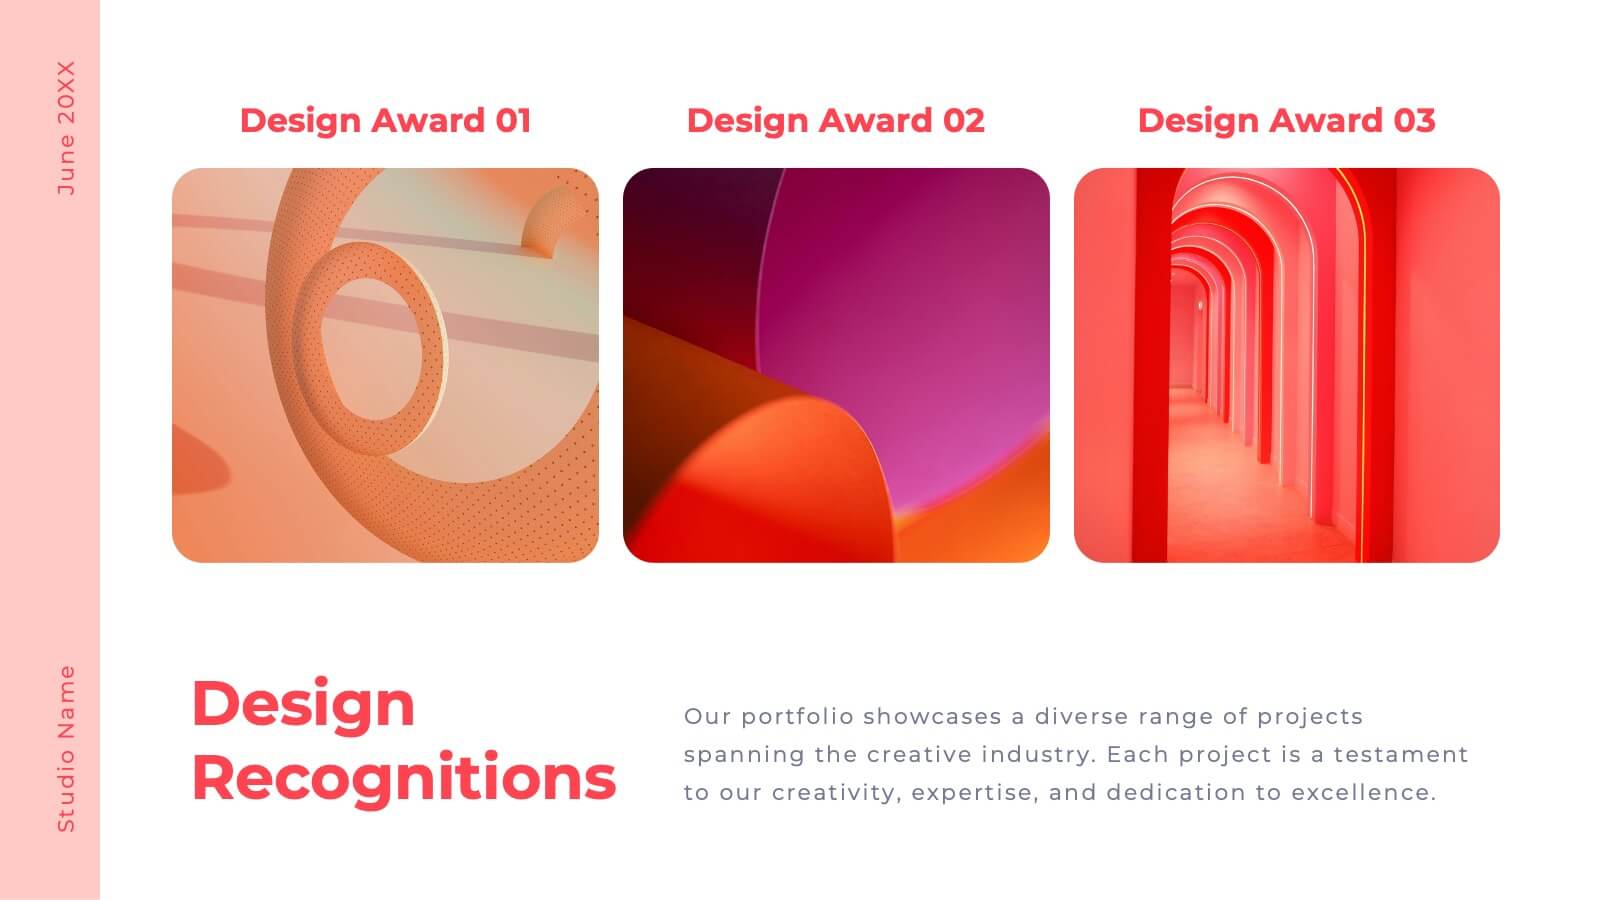
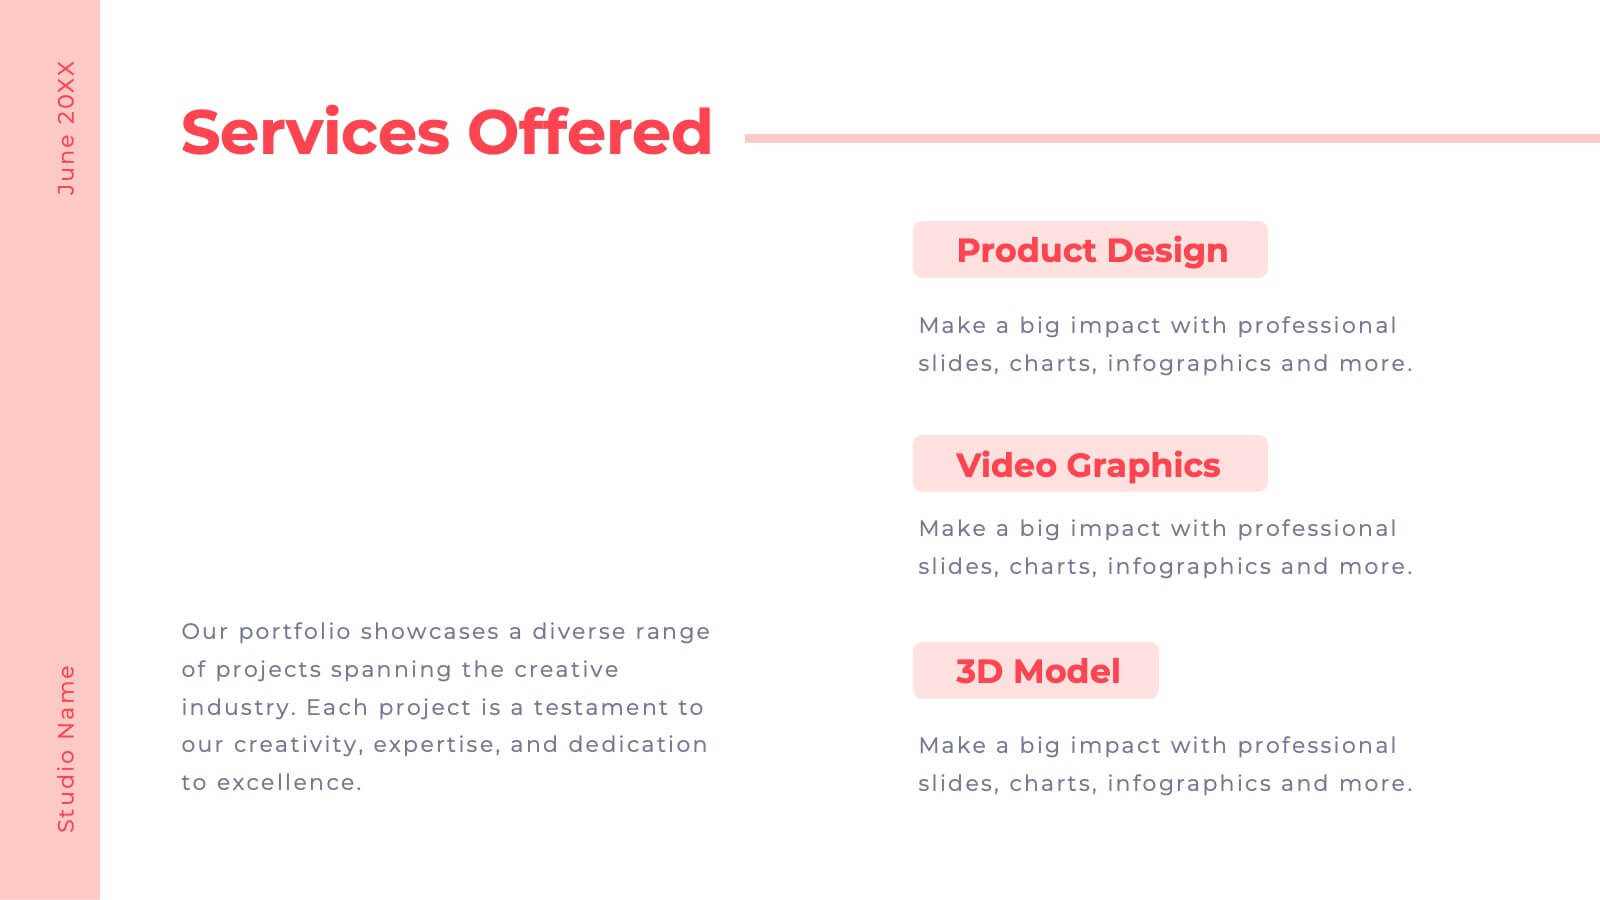
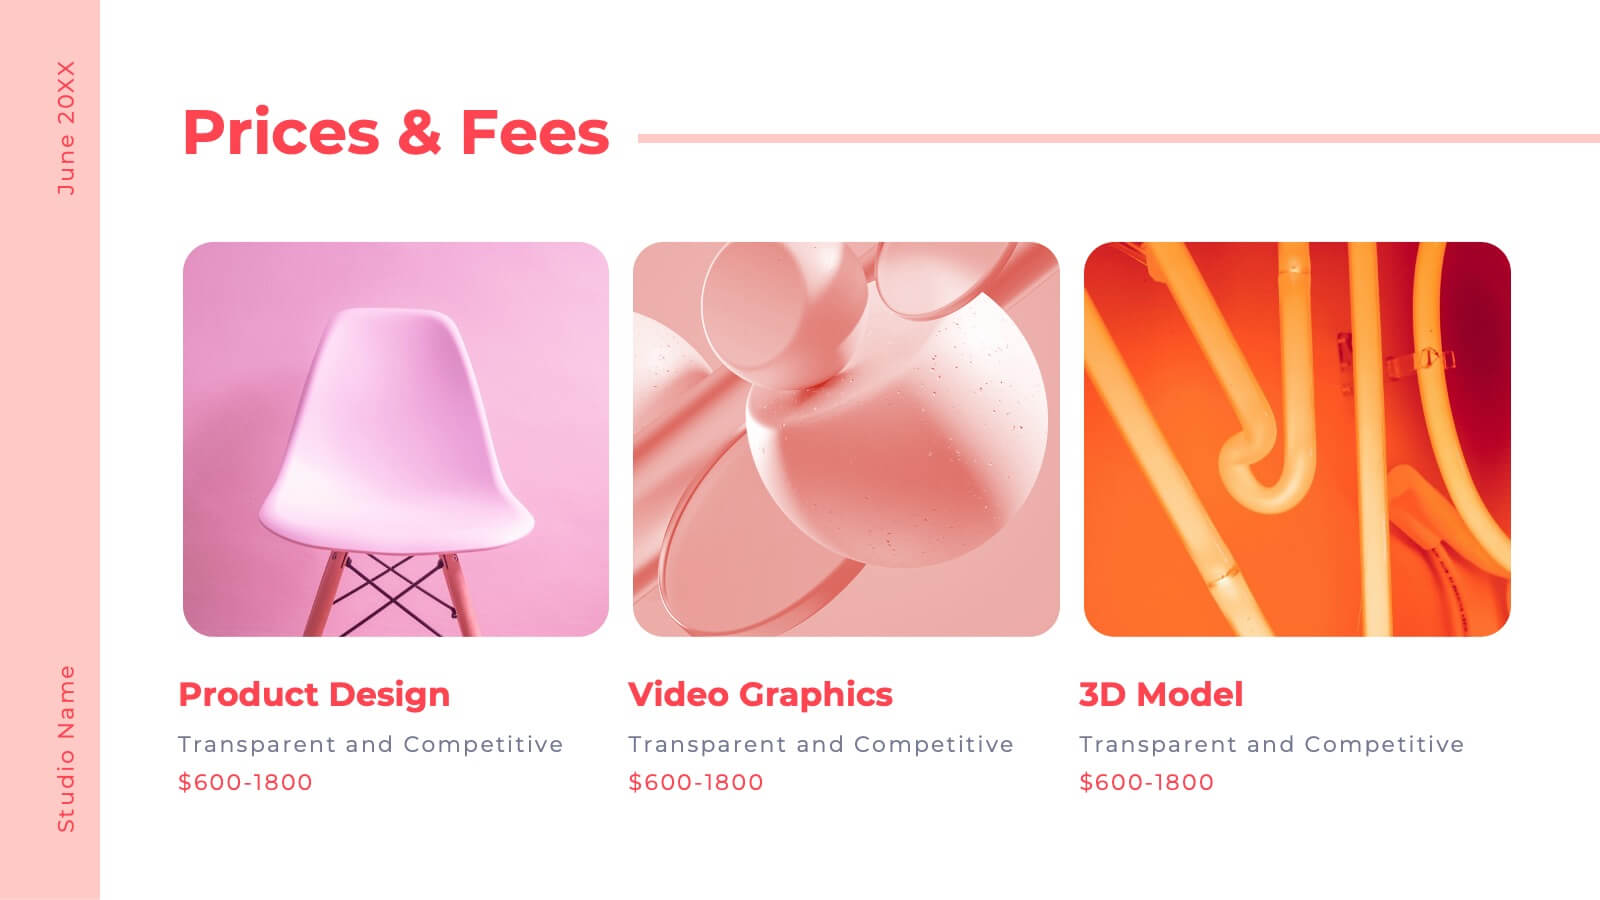
Valor Creative Portfolio Presentation
Step into creativity with this stunning portfolio template! Showcase your projects, design philosophy, and client testimonials with style and flair. Ideal for designers, artists, and creatives wanting to impress. Compatible with PowerPoint, Keynote, and Google Slides, this template elevates every portfolio to new heights. Perfect for making a lasting impact.


4 slides
Business Planning Framework Presentation
Turn big ideas into actionable strategies with this modern and structured presentation layout. Perfect for mapping goals, aligning priorities, and showcasing step-by-step planning processes, it helps you communicate strategy with clarity and confidence. Fully editable and compatible with PowerPoint, Keynote, and Google Slides for easy customization and professional results.


7 slides
Six Sigma Project Infographic
Six Sigma is a data-driven methodology and quality improvement approach that aims to eliminate defects and reduce variation in processes. This infographic template is a visual representation of the Six Sigma methodology, which is a data-driven approach used by organizations to improve their processes and reduce defects. The infographic aims to explain the key concepts and steps involved in the Six Sigma process in a clear and concise manner. It is designed to help individuals understand the methodology and its benefits, and can be used as a reference tool for Six Sigma practitioners and those interested in process improvement.


6 slides
System Maintenance and Support Presentation
Streamline your technical processes with the System Maintenance and Support Presentation. This slide features a clean alphabetical list layout (A–E) paired with icons and concise text areas—ideal for illustrating maintenance protocols, support categories, or troubleshooting stages. The right-side wrench graphic adds a visual metaphor for IT upkeep. Fully editable in PowerPoint, Keynote, and Google Slides.
5 slides
Team Achievements and Output Tracking Presentation
Celebrate success and monitor progress with the Team Achievements and Output Tracking presentation template. Designed with visual medal icons and color-coded team figures, this layout is perfect for highlighting milestones, recognizing contributors, and tracking output performance. Fully editable and compatible with PowerPoint, Keynote, and Google Slides.


4 slides
Rewards and Membership Benefits Presentation
Maximize engagement and incentivize loyalty with the "Rewards and Membership Benefits" presentation template. This layout is designed to help businesses effectively communicate the value of their membership programs, highlighting perks and rewards in a visually engaging way. Perfect for marketers aiming to enhance customer retention strategies, it's compatible with PowerPoint, Keynote, and Google Slides.


8 slides
Educational Learning and School Management Presentation
Enhance academic planning with the Educational Learning and School Management Diagram. This structured template visualizes key processes in education, ensuring a streamlined approach to school administration and curriculum development. Ideal for educators, administrators, and policymakers, it offers a clear, customizable layout to communicate strategies effectively. Fully compatible with PowerPoint, Keynote, and Google Slides.
20 slides
Inspire Business Proposal Presentation
Excite your audience with a compelling business proposal! This template includes sections for objectives, scope of work, timeline, budget, and more. Present your business plan clearly and effectively. Compatible with PowerPoint, Keynote, and Google Slides, it’s designed to impress stakeholders and secure approval for your project. Transform ideas into reality today!


22 slides
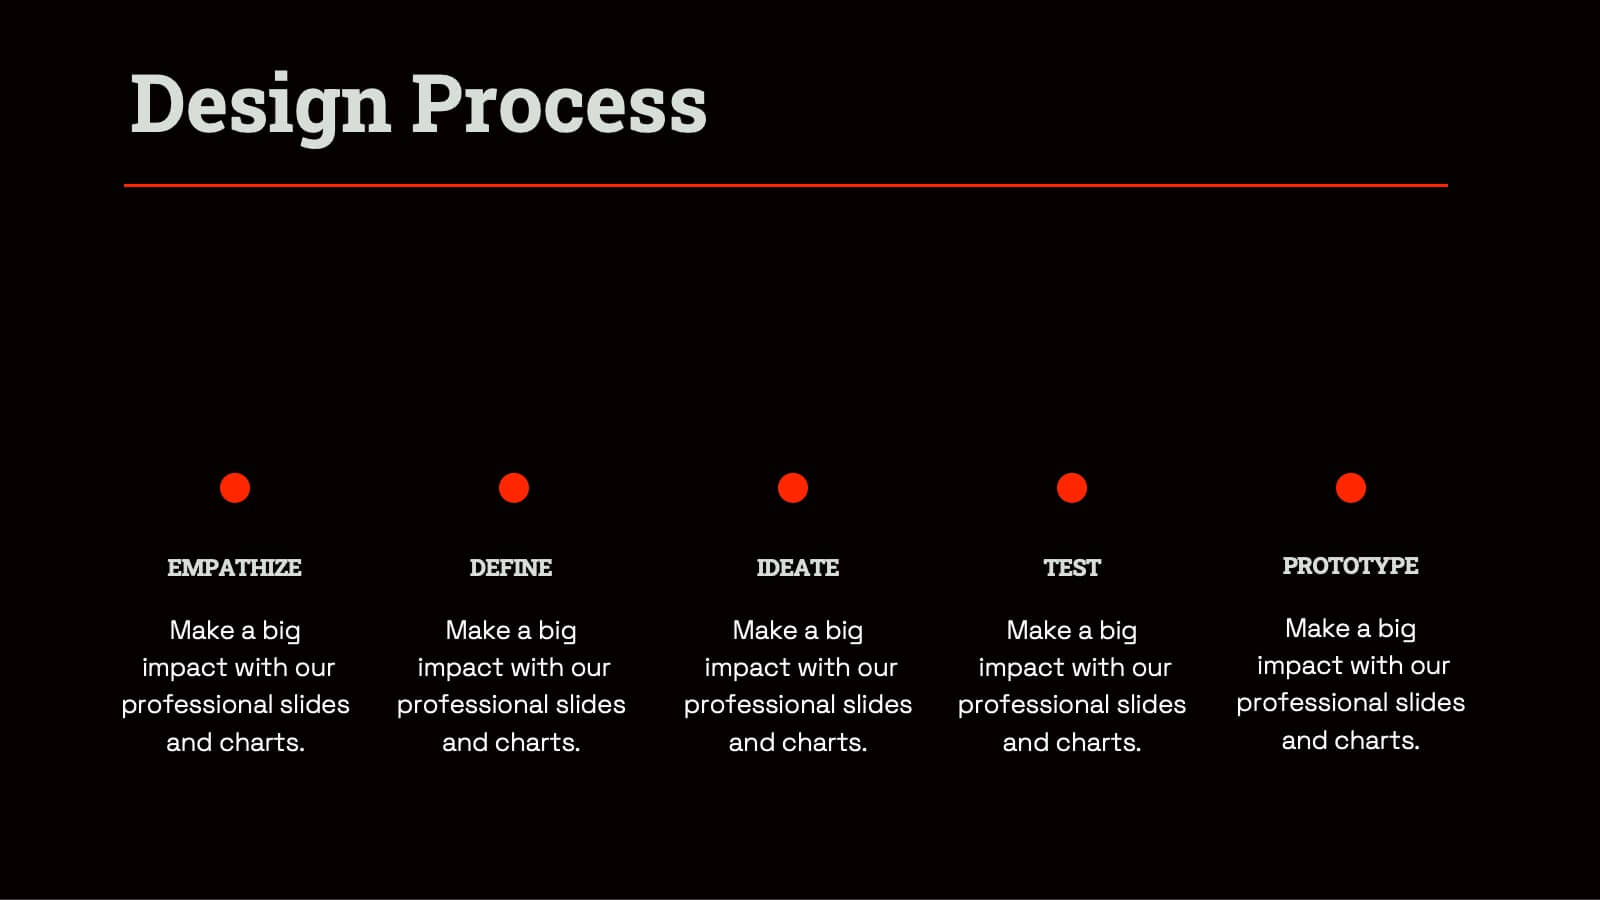
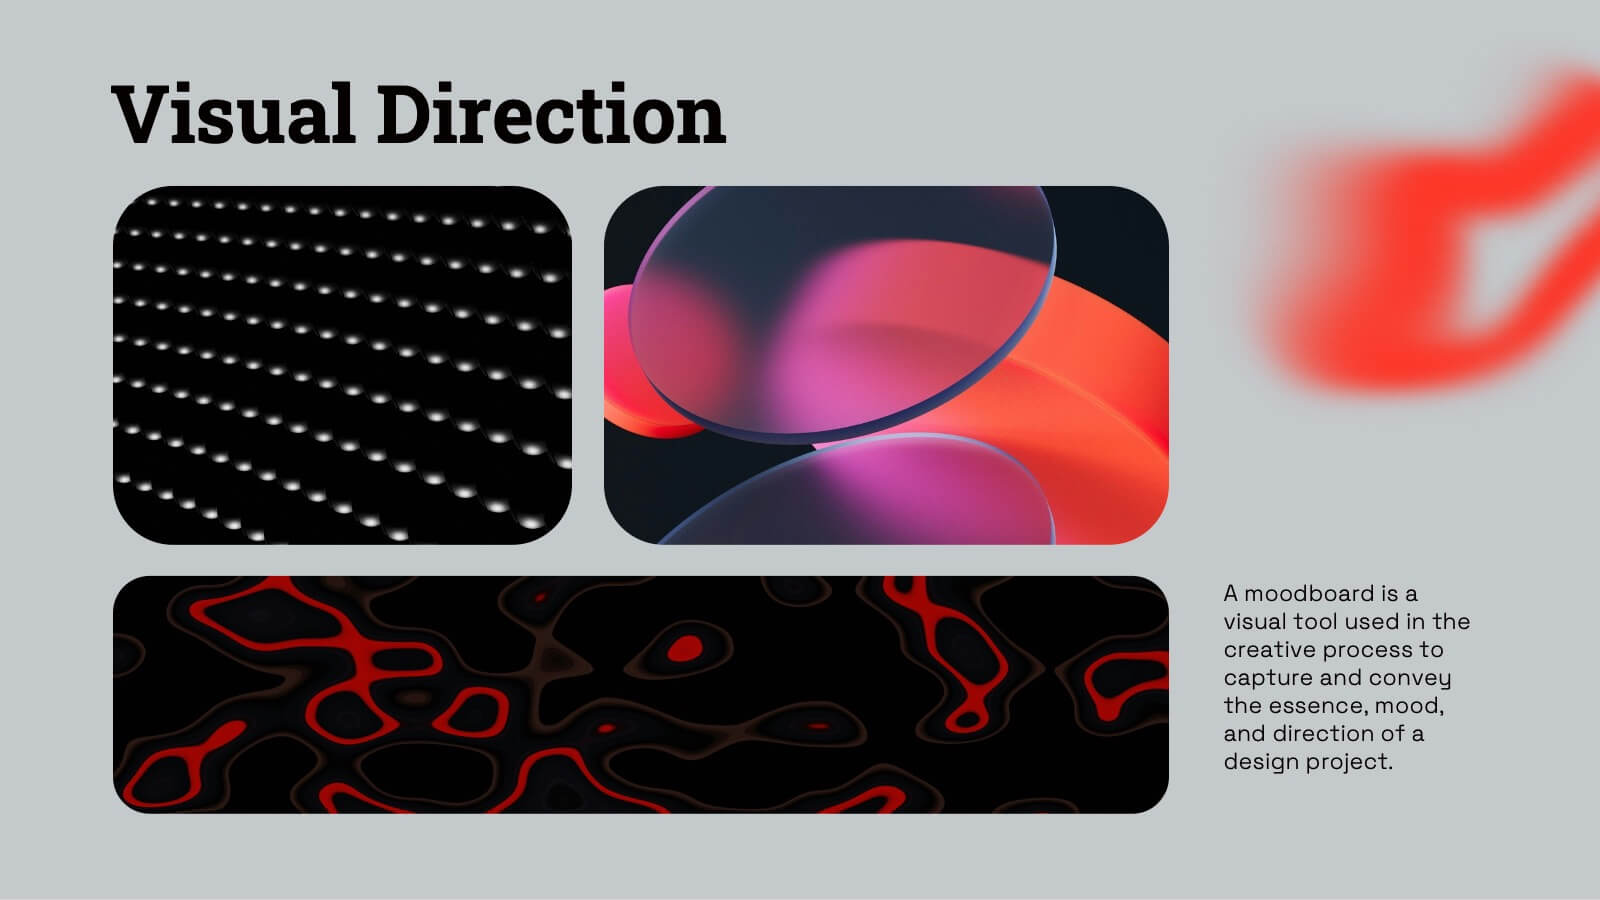
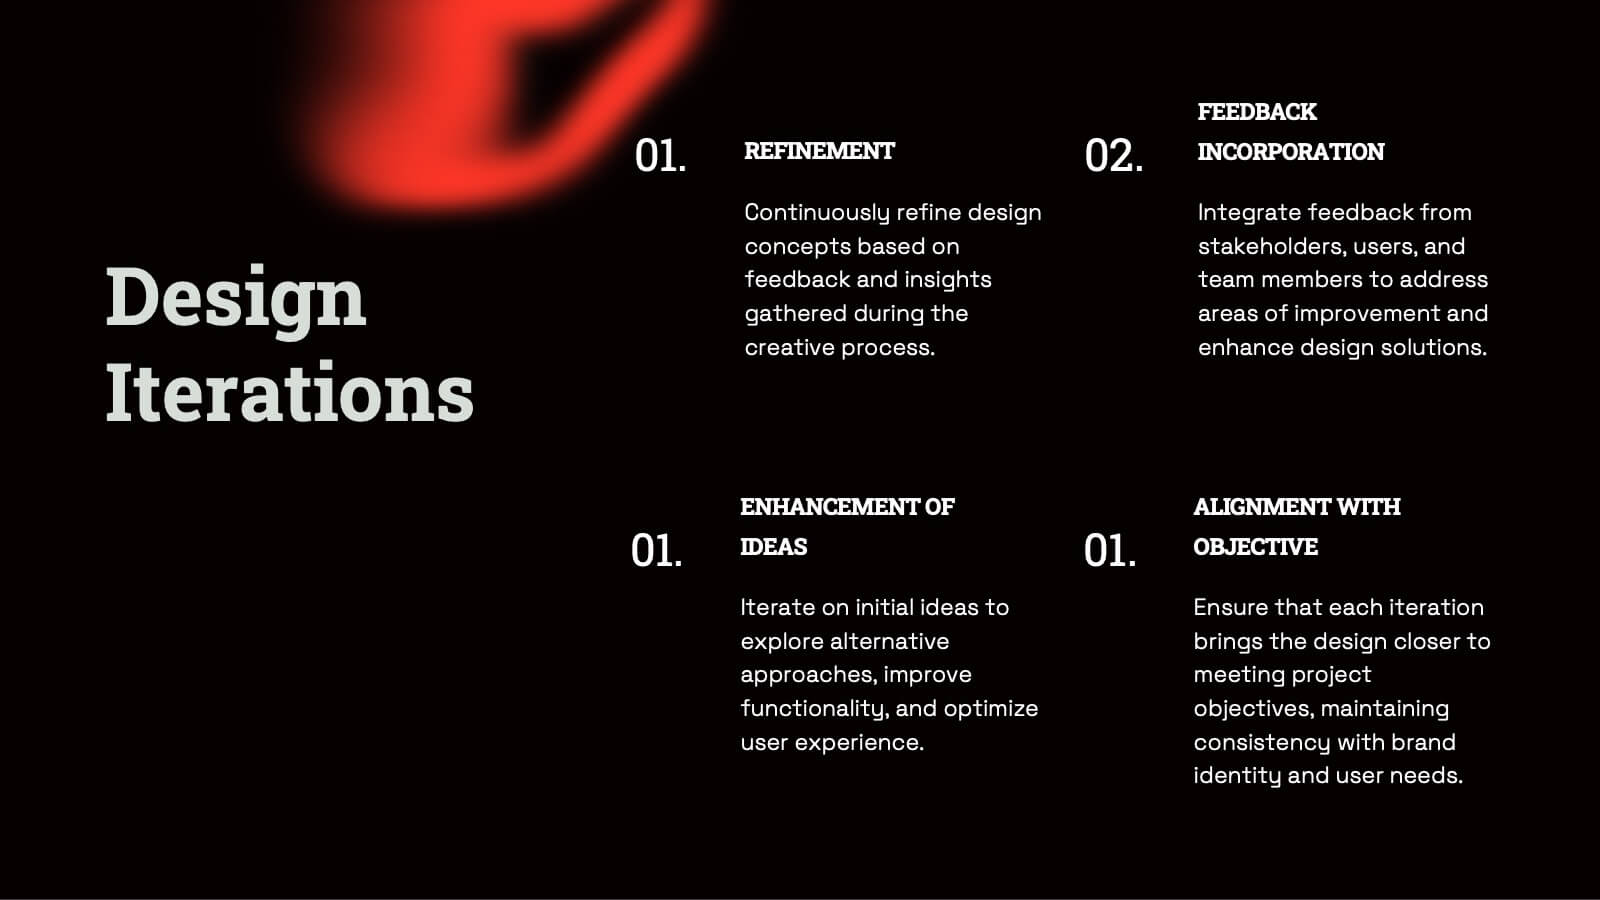
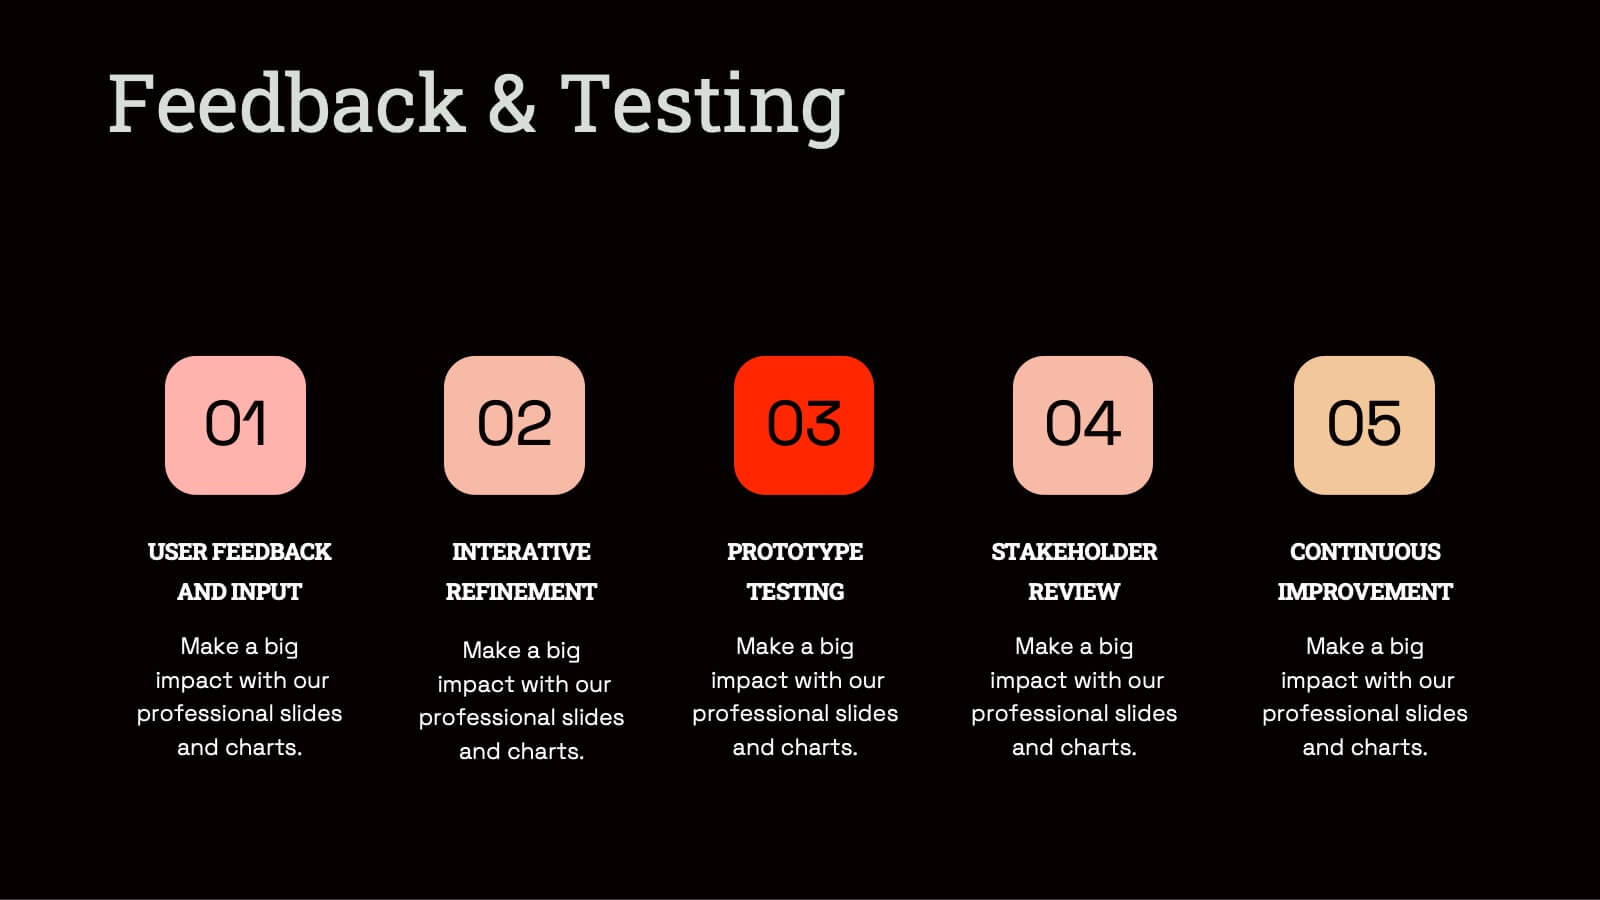
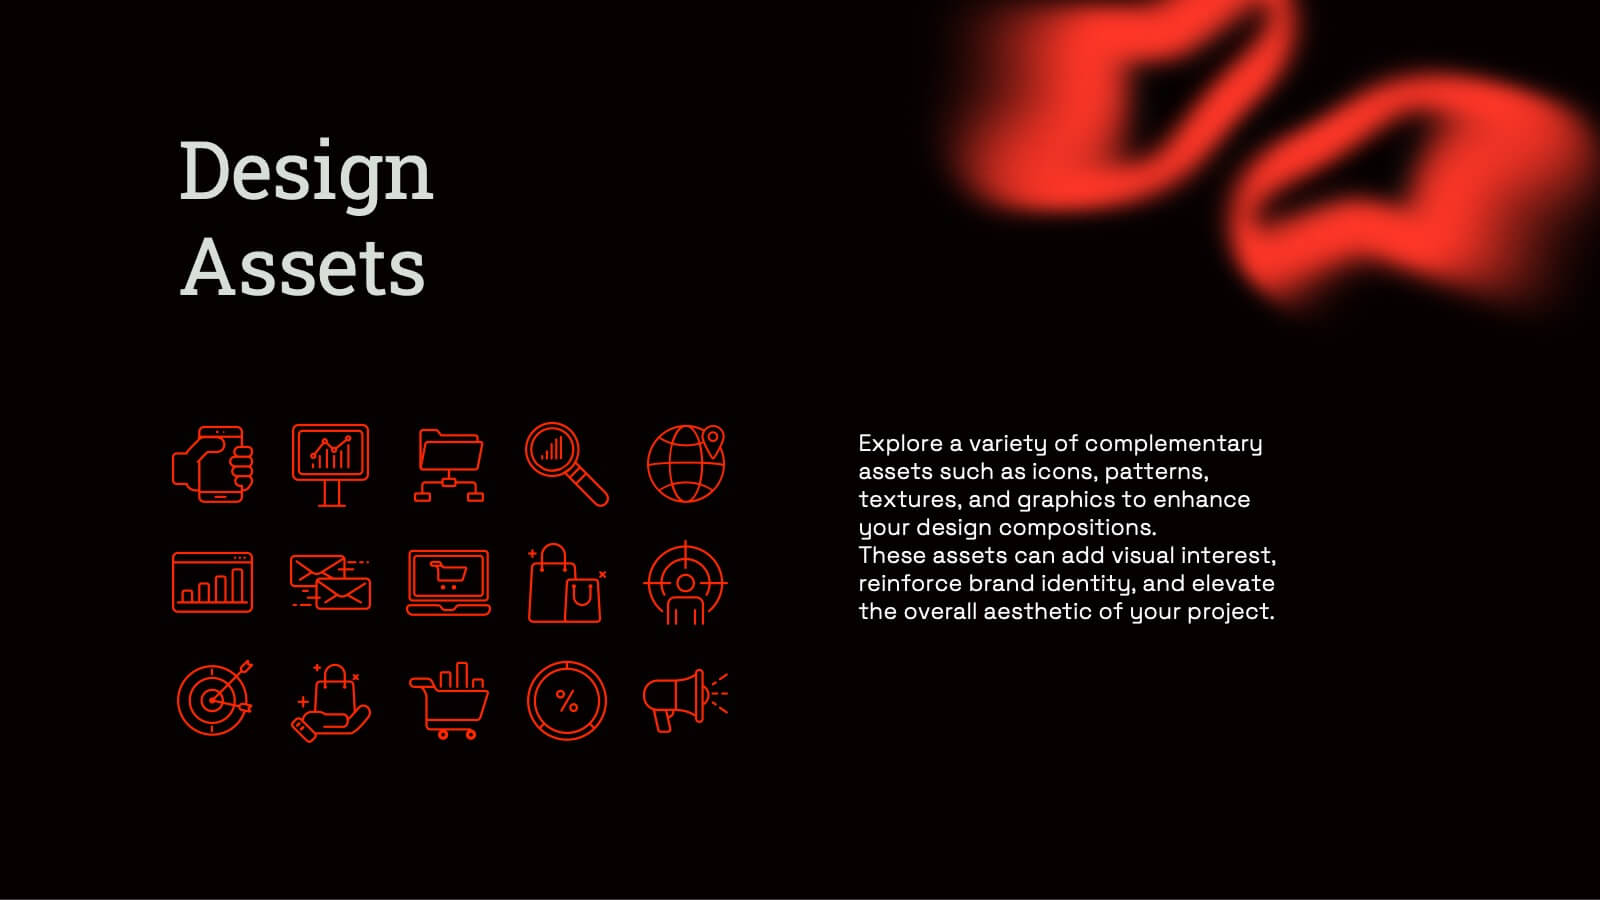
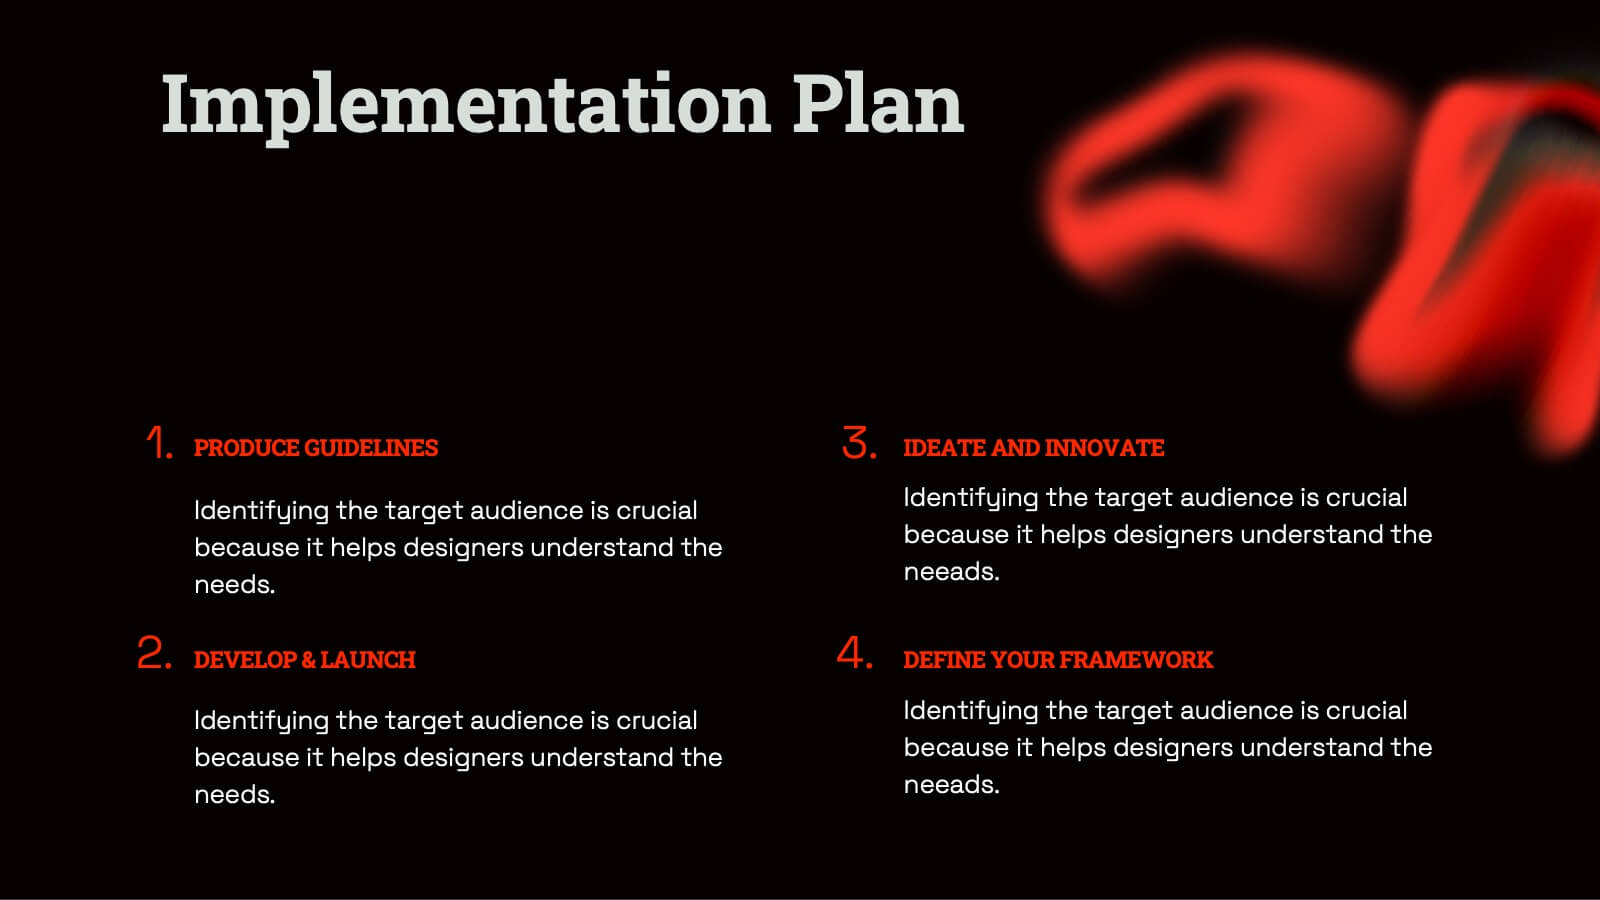
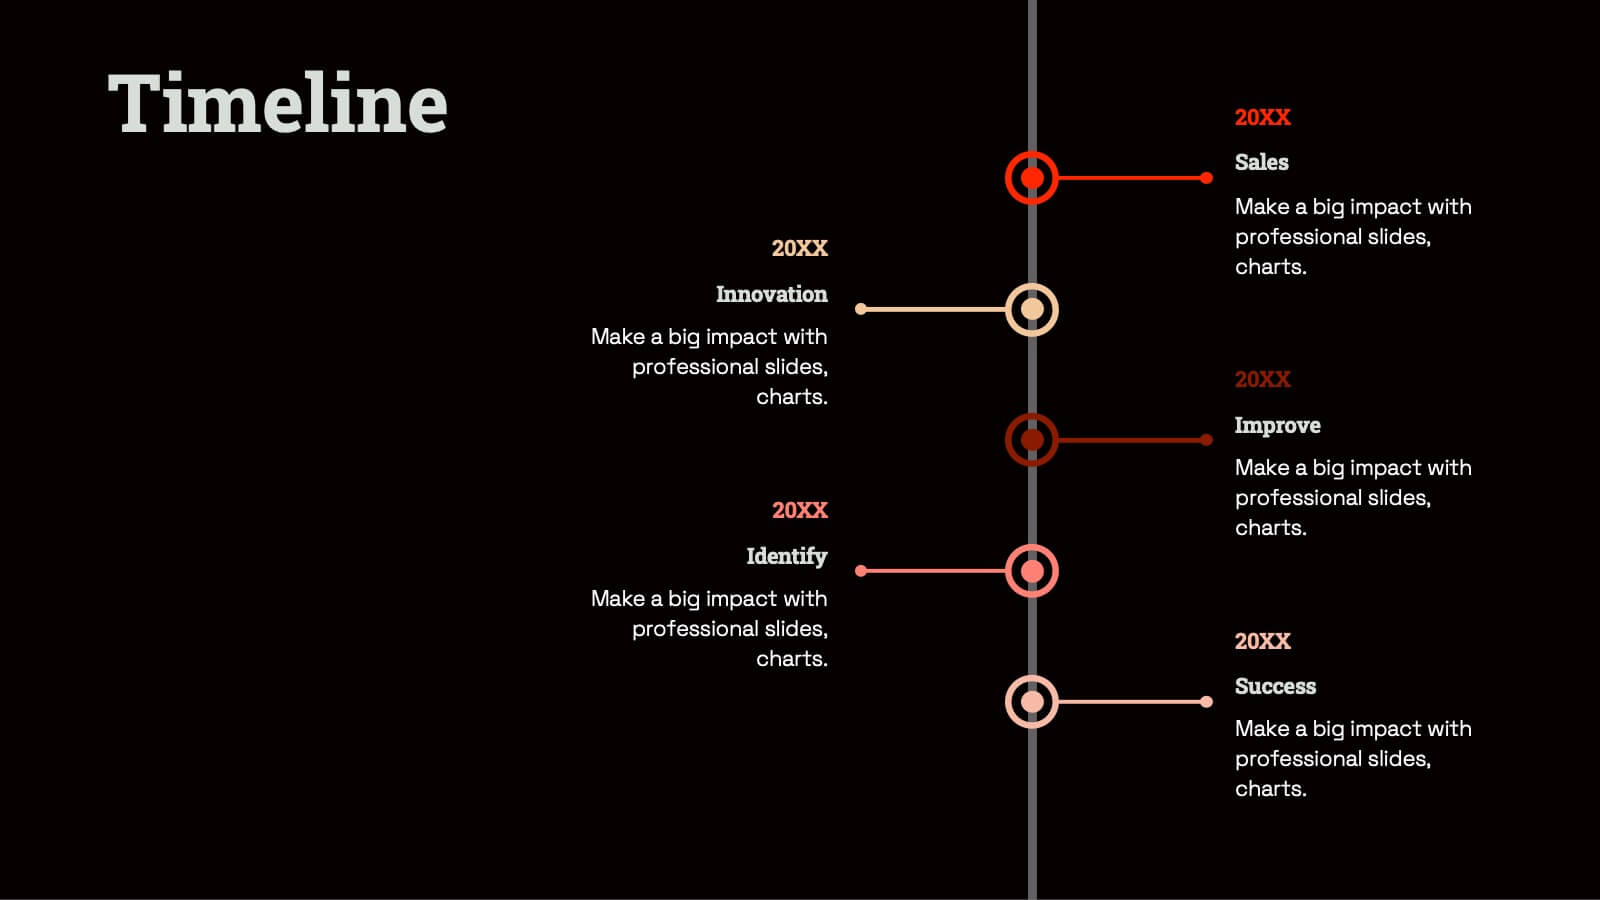
Radiant Graphic Design Project Plan Presentation
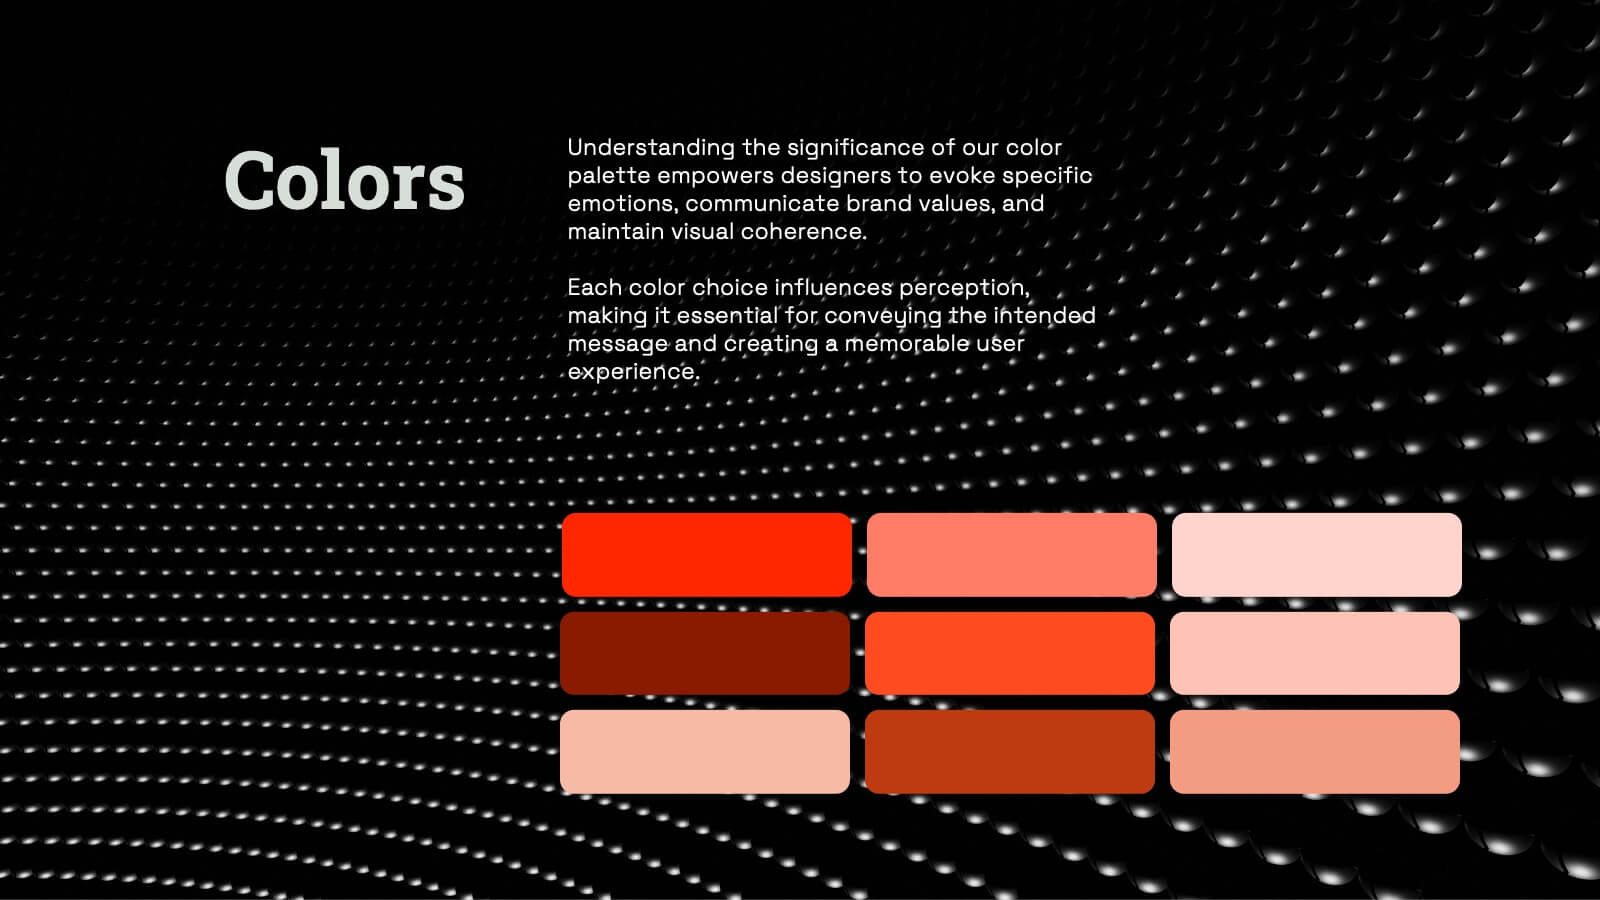
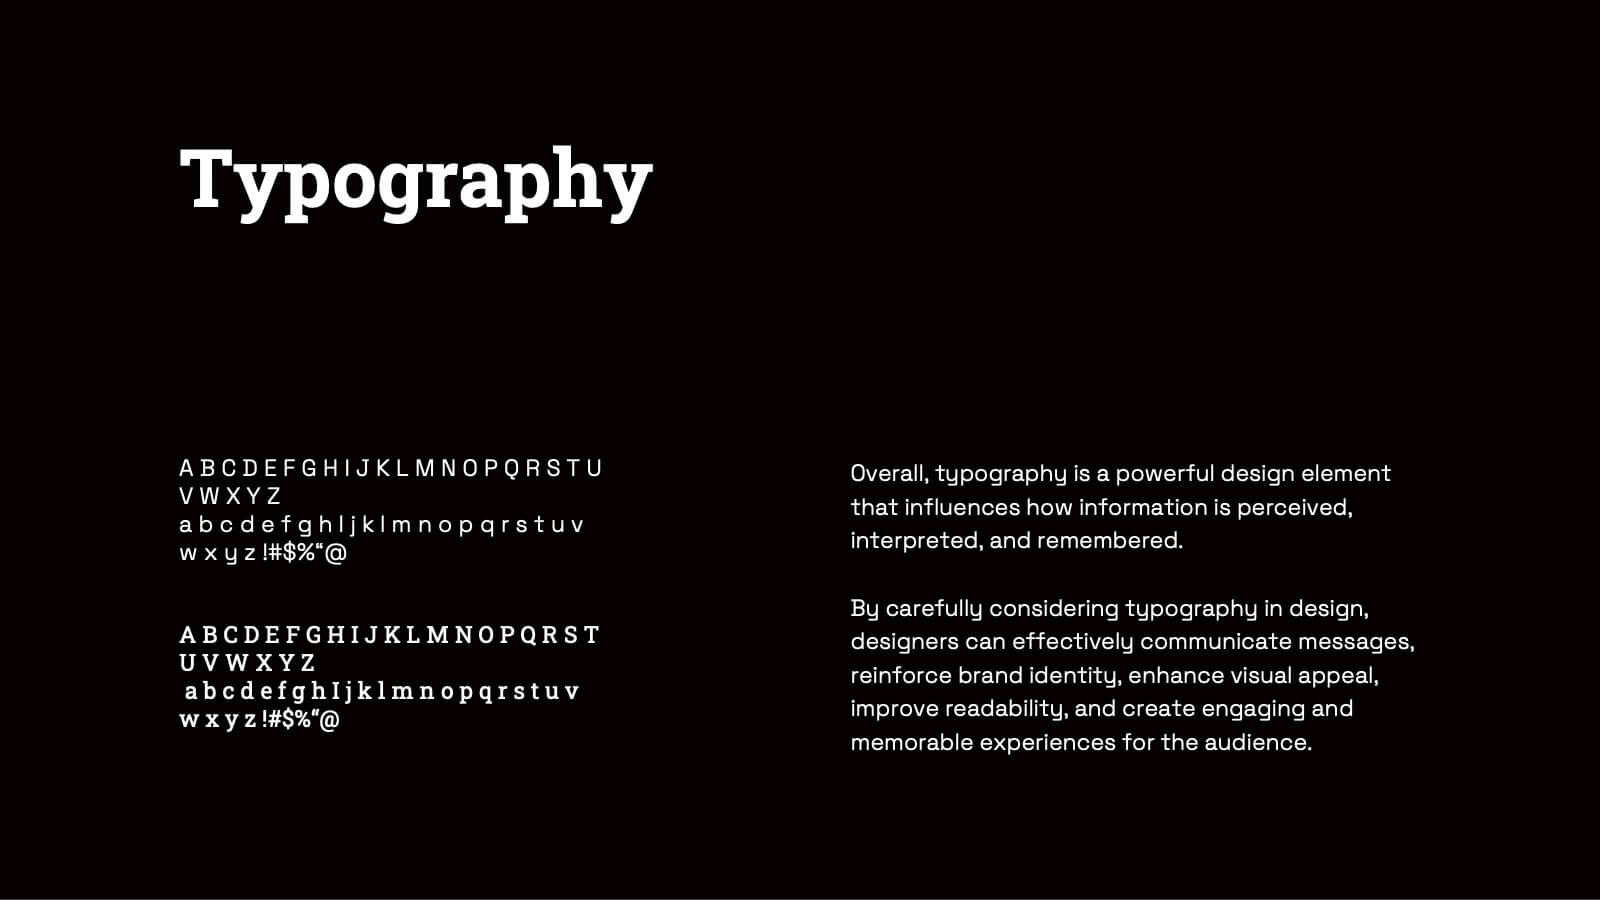
Unleash your creativity with this bold and dynamic graphic design project plan template! Perfect for showcasing design elements, textures, and typography, this template guides you through every phase, from concept development and prototyping to feedback and final presentations. Ideal for visual direction and design asset management, it’s fully compatible with PowerPoint, Keynote, and Google Slides for seamless use.


6 slides
KPI Overview in Dashboard Format Presentation
Track performance at a glance with this KPI Overview in Dashboard Format presentation. Featuring visual gauge meters and progress indicators, it's perfect for reporting on targets, performance metrics, and business KPIs. Clean and modern layout, fully customizable in Canva, PowerPoint, and Google Slides to match your data visualization needs.


4 slides
Idea Validation and Business Feasibility Presentation
Clarify your strategy with the Idea Validation and Business Feasibility Presentation. This layout uses a sleek, linear flow anchored by a central lightbulb icon to guide your audience through three key checkpoints—validation, feasibility, and readiness. Each step is color-coded and icon-marked to enhance clarity. Fully editable in PowerPoint, Canva, Google Slides, and Keynote.


8 slides
Core Pillars of Business Success Presentation
Highlight your company’s foundation with the Core Pillars of Business Success presentation. This slide features four bold, column-style visuals labeled A through D—each representing a critical component of your business strategy. Ideal for illustrating structure, vision, and stability, it helps communicate growth factors like leadership, innovation, operations, and finance. Fully editable in PowerPoint, Keynote, and Google Slides, it's perfect for consultants, executives, and strategic planners.


7 slides
RACI Matrix Project Infographic
A RACI Matrix, sometimes referred to as a Responsibility Assignment Matrix, is a project management tool used to clarify and communicate the roles and responsibilities of team members in completing tasks and activities within a project. This is a visually captivating and informative template designed to demystify the complexities of project accountability. Navigate through the world of roles and responsibilities in a project setting with this dynamic and easily digestible visual aid. With this infographic your audience will journey toward effective project management and accountability with the RACI Matrix.


6 slides
Science Project Infographic
Science projects are hands-on activities designed to explore and investigate scientific concepts. This infographic template aims to communicate complex scientific information in a visually appealing and easy-to-understand manner. The infographic provides an overview of the project's key elements, including the question, hypothesis, materials, procedure, results, and conclusion. This serves as a creative and engaging guide to help students choose and plan their science projects for school science fairs or independent research. The infographic uses visuals, illustrations, and icons to enhance understanding and engagement.


5 slides
Employee Change Management Plan Presentation
Guide employees through transitions with clarity using this Employee Change Management Plan template. This step-by-step visual represents progress from initial stages (20%) to full implementation (100%), making it ideal for HR strategies, organizational development, and workforce transformation initiatives. Fully customizable—adjust colors, text, and data points to fit your business needs. Compatible with PowerPoint, Keynote, and Google Slides for seamless integration into your presentations.