


Features
- 22 Unique Slides
- Fully editable and easy to edit in Microsoft Powerpoint, Keynote and Google Slides
- 16:9 widescreen layout
- Clean and professional designs
- Export to JPG, PDF or send by email


Do you have any questions?
Recommend


6 slides
Value Delivery Framework Presentation
Turn your strategy into action with a clear, layered design that highlights how value flows through every stage of your process. Perfect for explaining organizational efficiency, performance models, or delivery systems. Fully editable and compatible with PowerPoint, Keynote, and Google Slides for easy, professional customization.


5 slides
Timeline-Based Year-End Recap Presentation
Summarize milestones with the Timeline-Based Year-End Recap Presentation. This structured, column-based layout allows you to compare achievements across multiple years in a clear, organized format. Each year is color-coded and paired with icons and editable label sections to highlight key points. Ideal for annual reports, strategic reviews, and progress tracking. Fully editable in PowerPoint, Google Slides, and Canva.


5 slides
Building Strong Business Relationships
Create lasting partnerships with this structured business relationship infographic. Ideal for outlining trust-building strategies, collaboration frameworks, and stakeholder engagement plans. Fully editable in PowerPoint, Keynote, and Google Slides, making it simple to align the design with your company’s branding and professional goals.


16 slides
Professional Presentation
Streamline your project presentations with our Professional Template, meticulously designed to bring your content to life. This template is ideal for professionals looking to present a structured and detailed overview of their projects. Starting with a compelling cover slide, it guides you through defining your problem statement, setting clear objectives, and laying out comprehensive strategies and recommendations. The slides are curated to facilitate a logical flow from an introduction of your project to a detailed implementation plan, visual graphics, and outcome analysis. The key objectives slide is engineered to present your goals with impact, while the strategies and implementation plan slides help articulate the steps towards achieving success. The template concludes with a neat summary slide, a cordial 'Thank You' slide with contact information, and a credits section for source attribution. Fully compatible with PowerPoint, Keynote, and Google Slides, this template is a reliable choice for professionals seeking to convey their message with clarity and confidence.


5 slides
Sustainable Development Goals Deck Presentation
Present your sustainability roadmap with clarity using the Sustainable Development Goals Deck. Designed for highlighting eco-initiatives, circular strategies, and responsible development objectives. The circular layout supports goal-based narratives and strategic breakdowns. Fully editable in PowerPoint, Keynote, and Google Slides—ideal for ESG reports, environmental pitches, or CSR presentations.


4 slides
Corporate Role Hierarchy Structure Presentation
Visualize your company’s reporting structure with this modern corporate role hierarchy diagram. Perfect for team overviews, leadership charts, or onboarding sessions. Each role node is clearly connected for easy understanding. Fully editable in Canva, PowerPoint, or Google Slides—ideal for HR teams, managers, or organizational planning presentations.


6 slides
Real Estate Investment Strategy Presentation
Illustrate your property plans with this Real Estate Investment Strategy Presentation. Designed as a stylized house diagram, this slide organizes six key areas of investment into clearly segmented zones with icons and colors for each layer. Ideal for property development, real estate pitches, or investor overviews. Compatible with PowerPoint, Canva, Keynote, and Google Slides.


6 slides
5-Level Risk Assessment Diagram Presentation
Simplify complex risk analysis with a clean, layered design that walks your audience through five key levels of impact and probability. Perfect for corporate reports, project management, or strategic planning, this presentation ensures clarity and engagement. Fully compatible with PowerPoint, Keynote, and Google Slides for easy customization.


20 slides
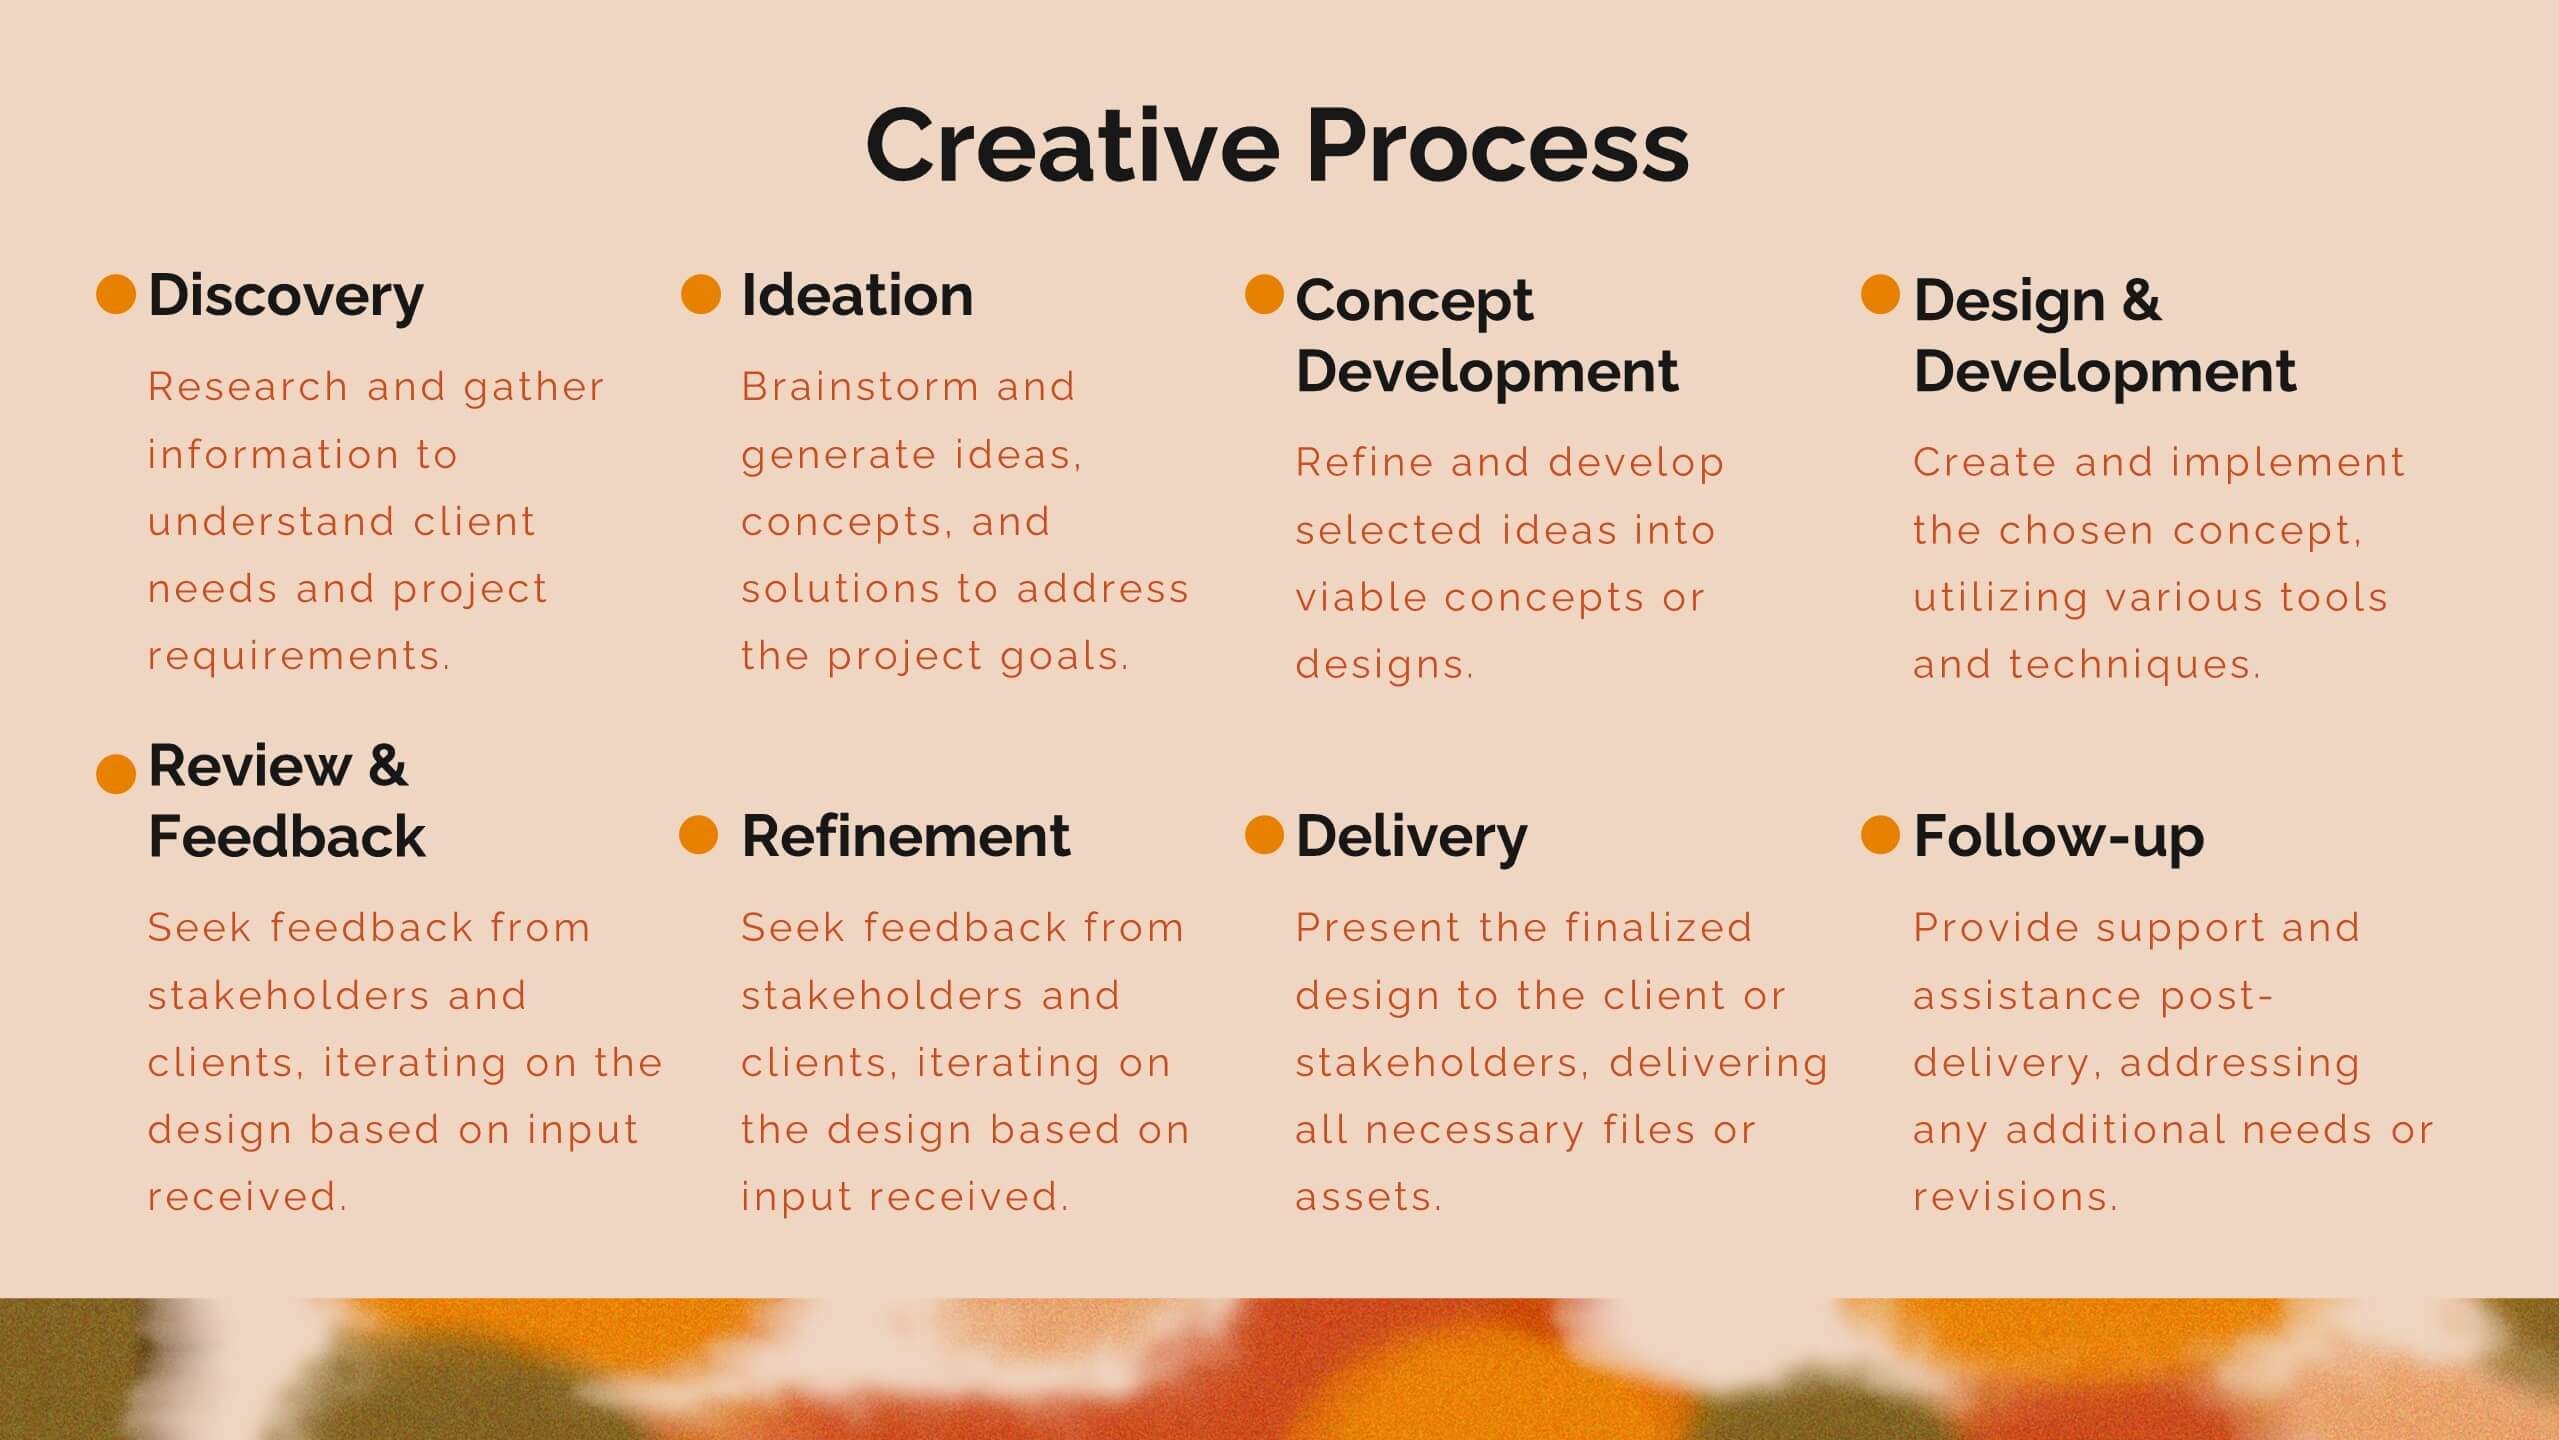
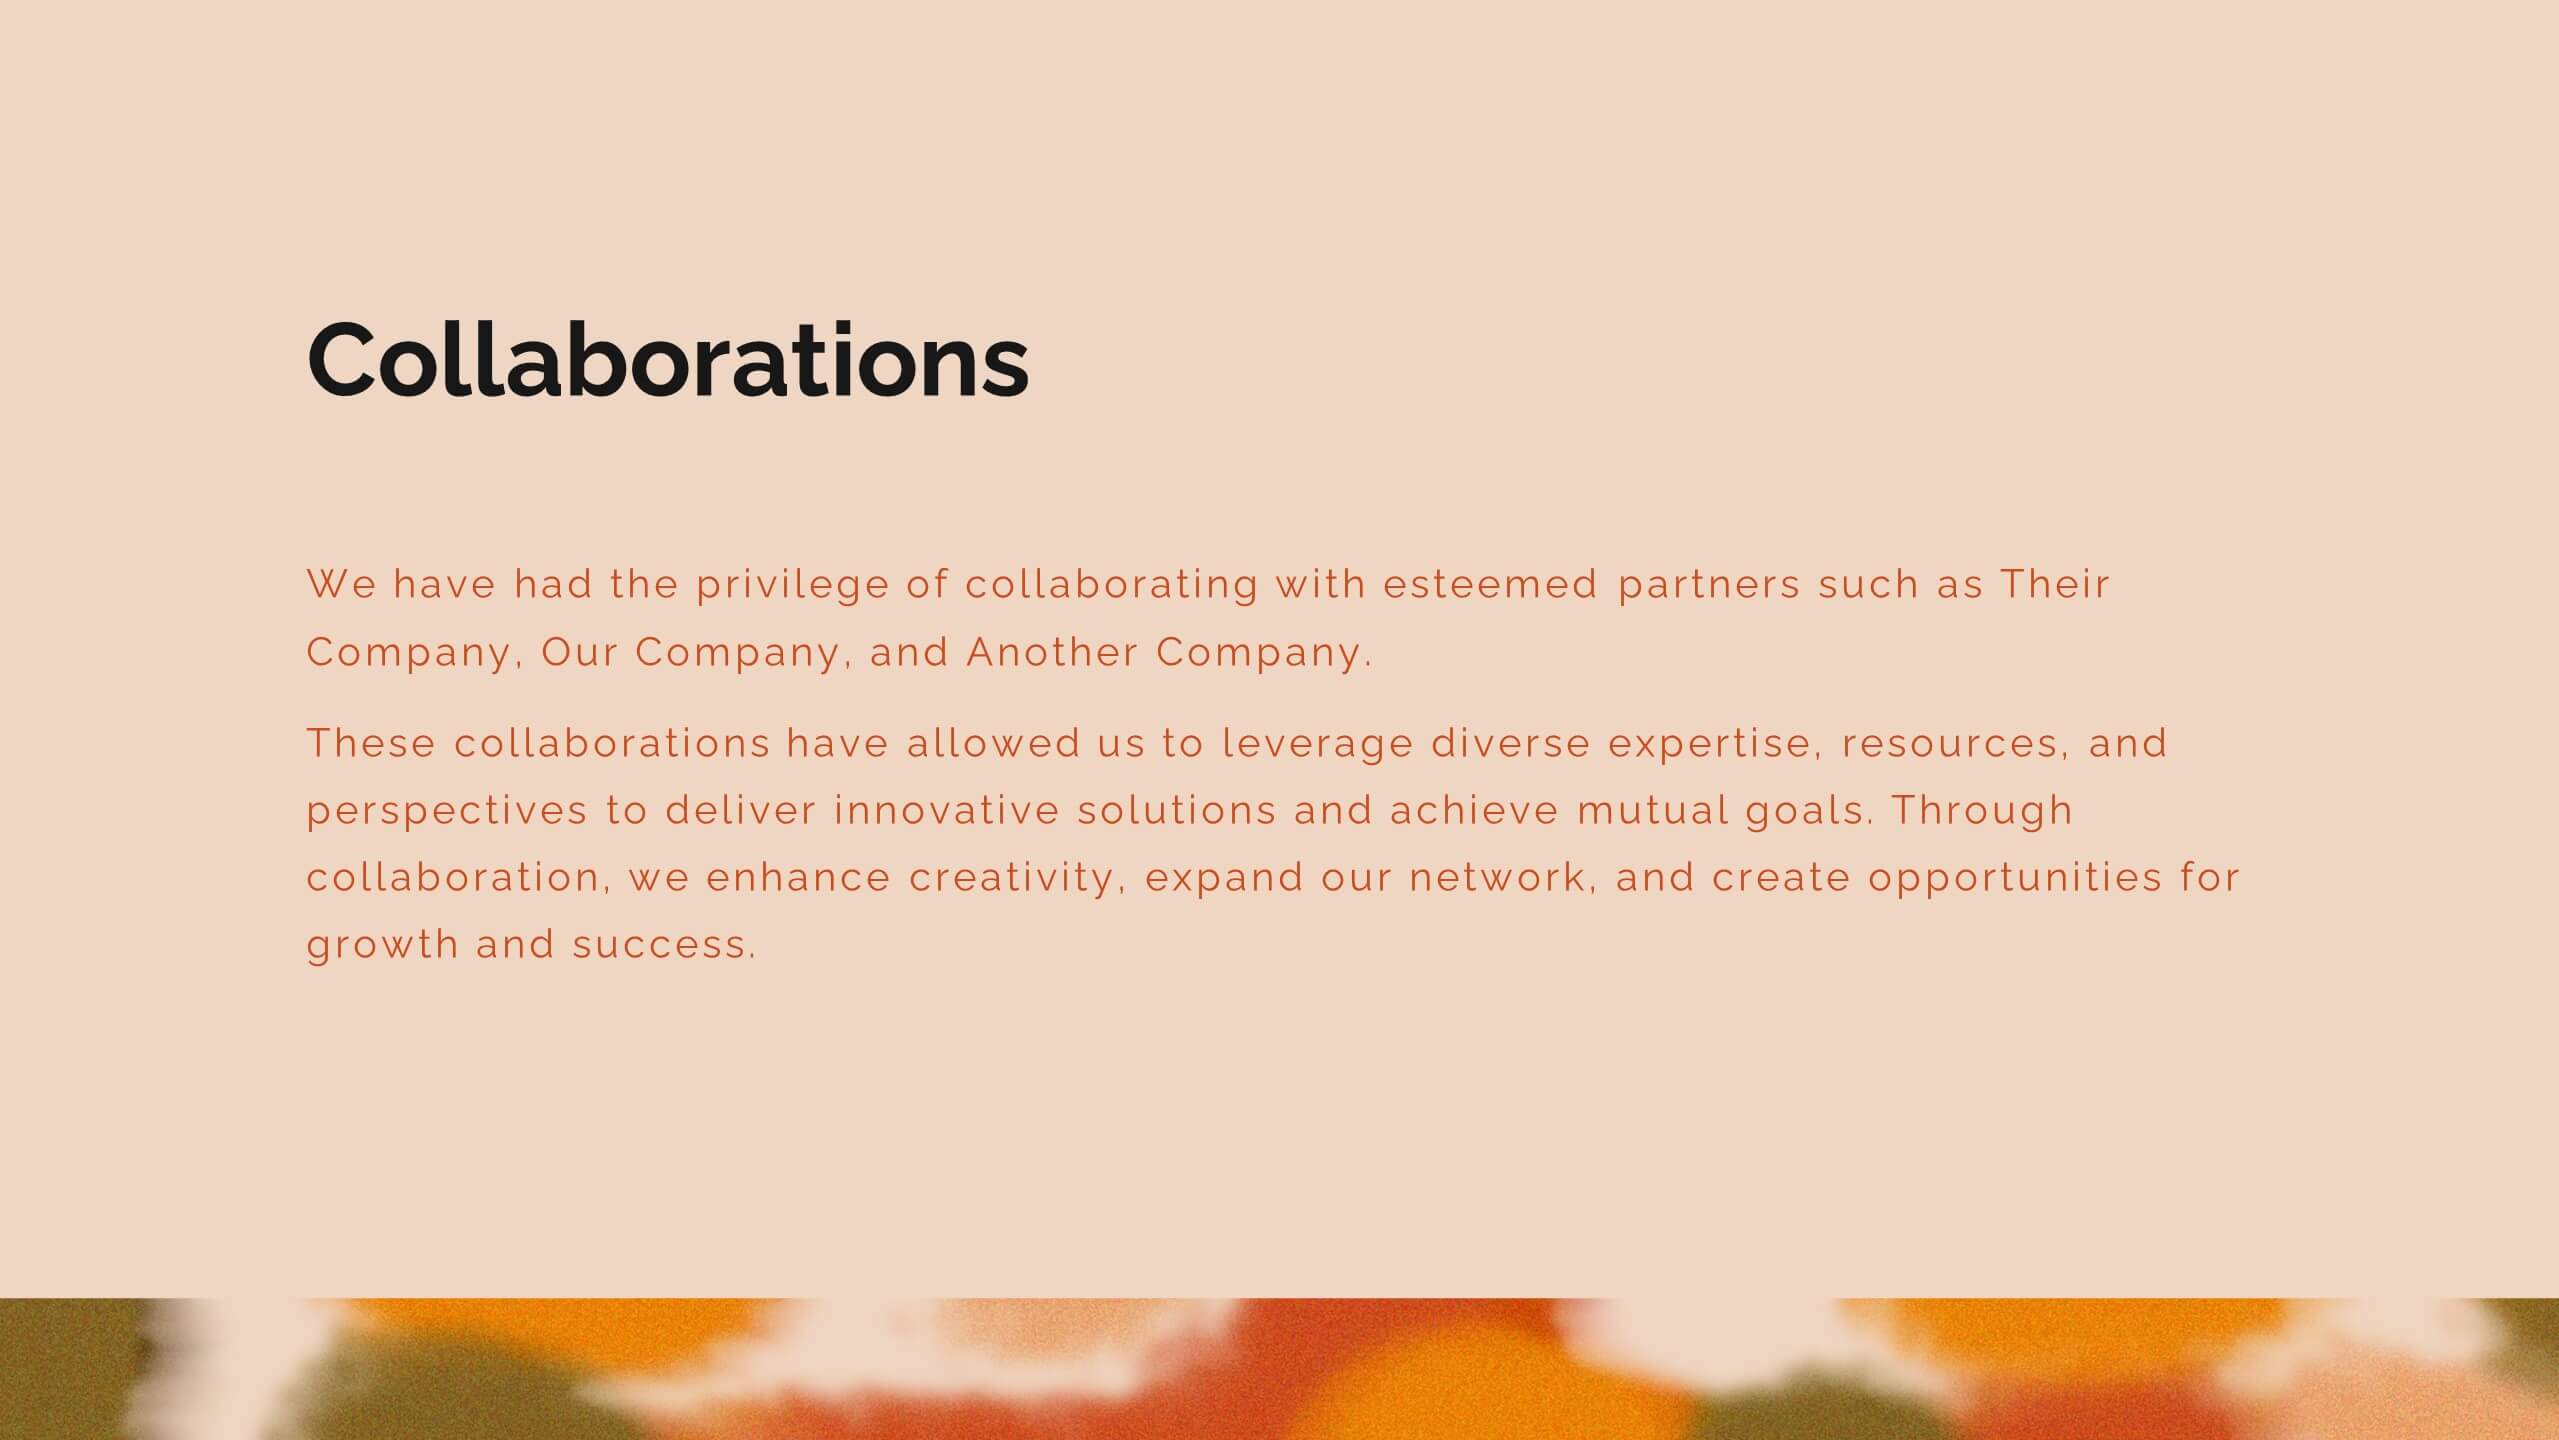
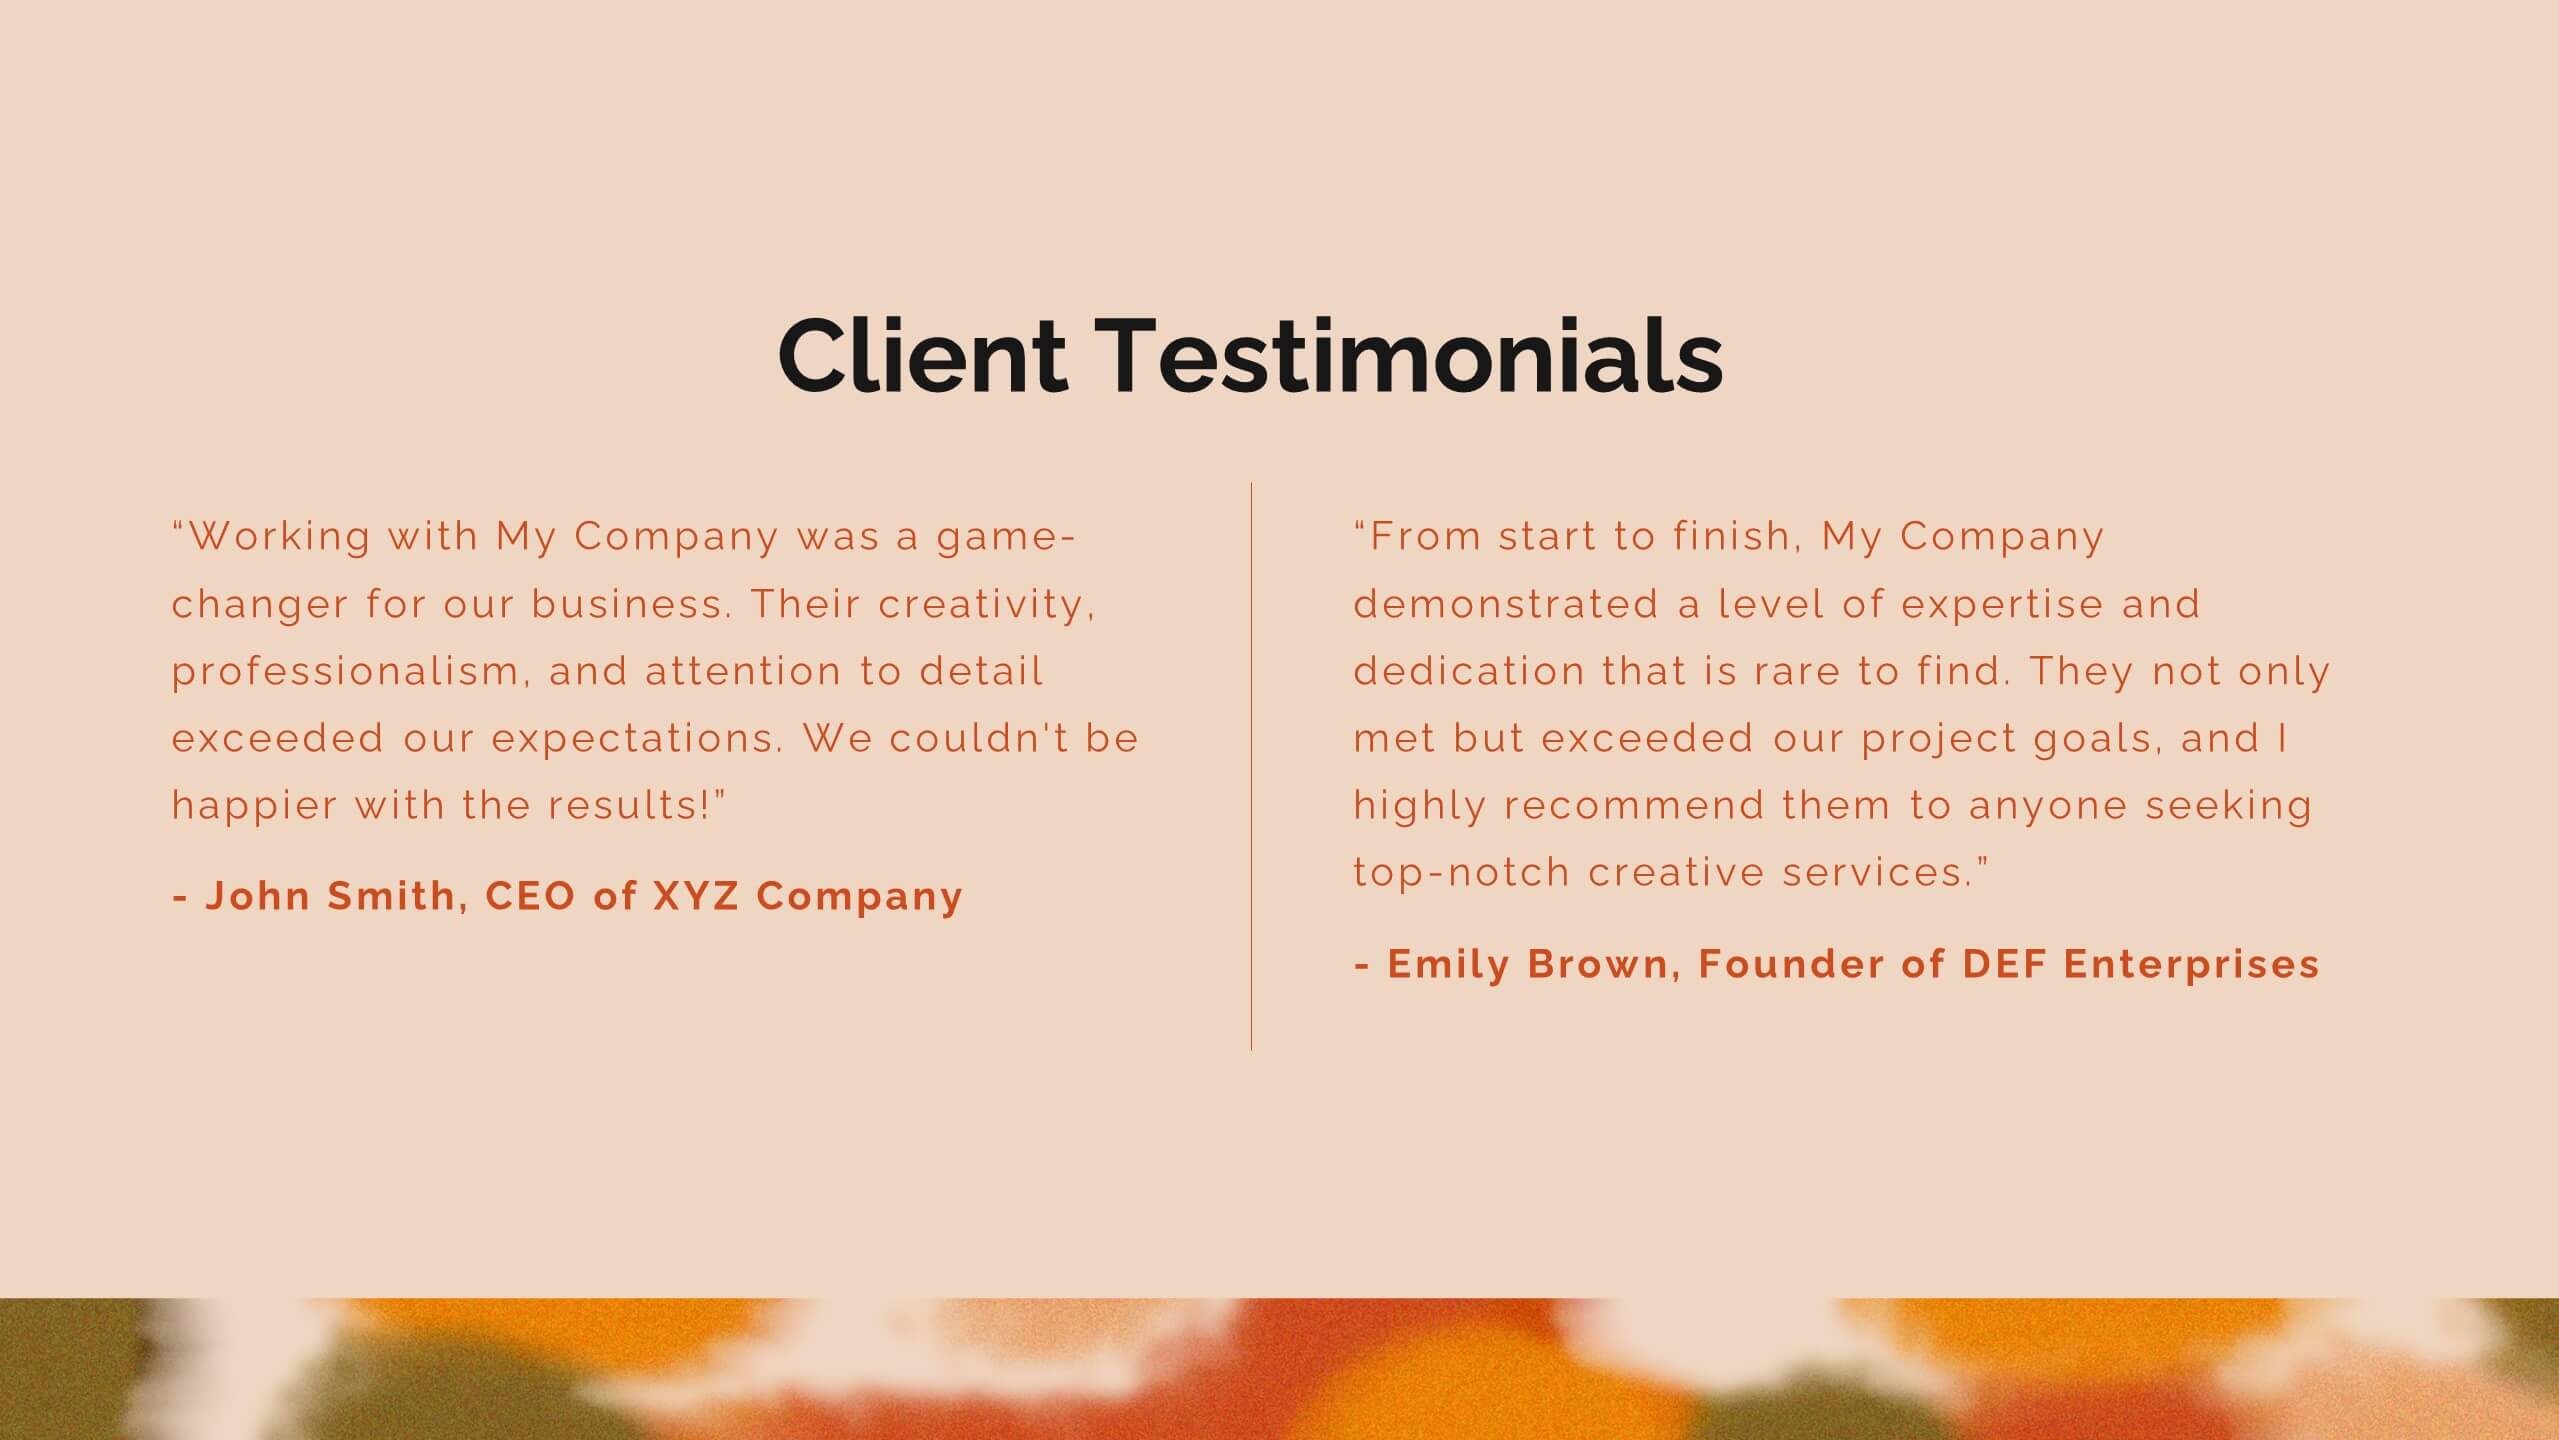
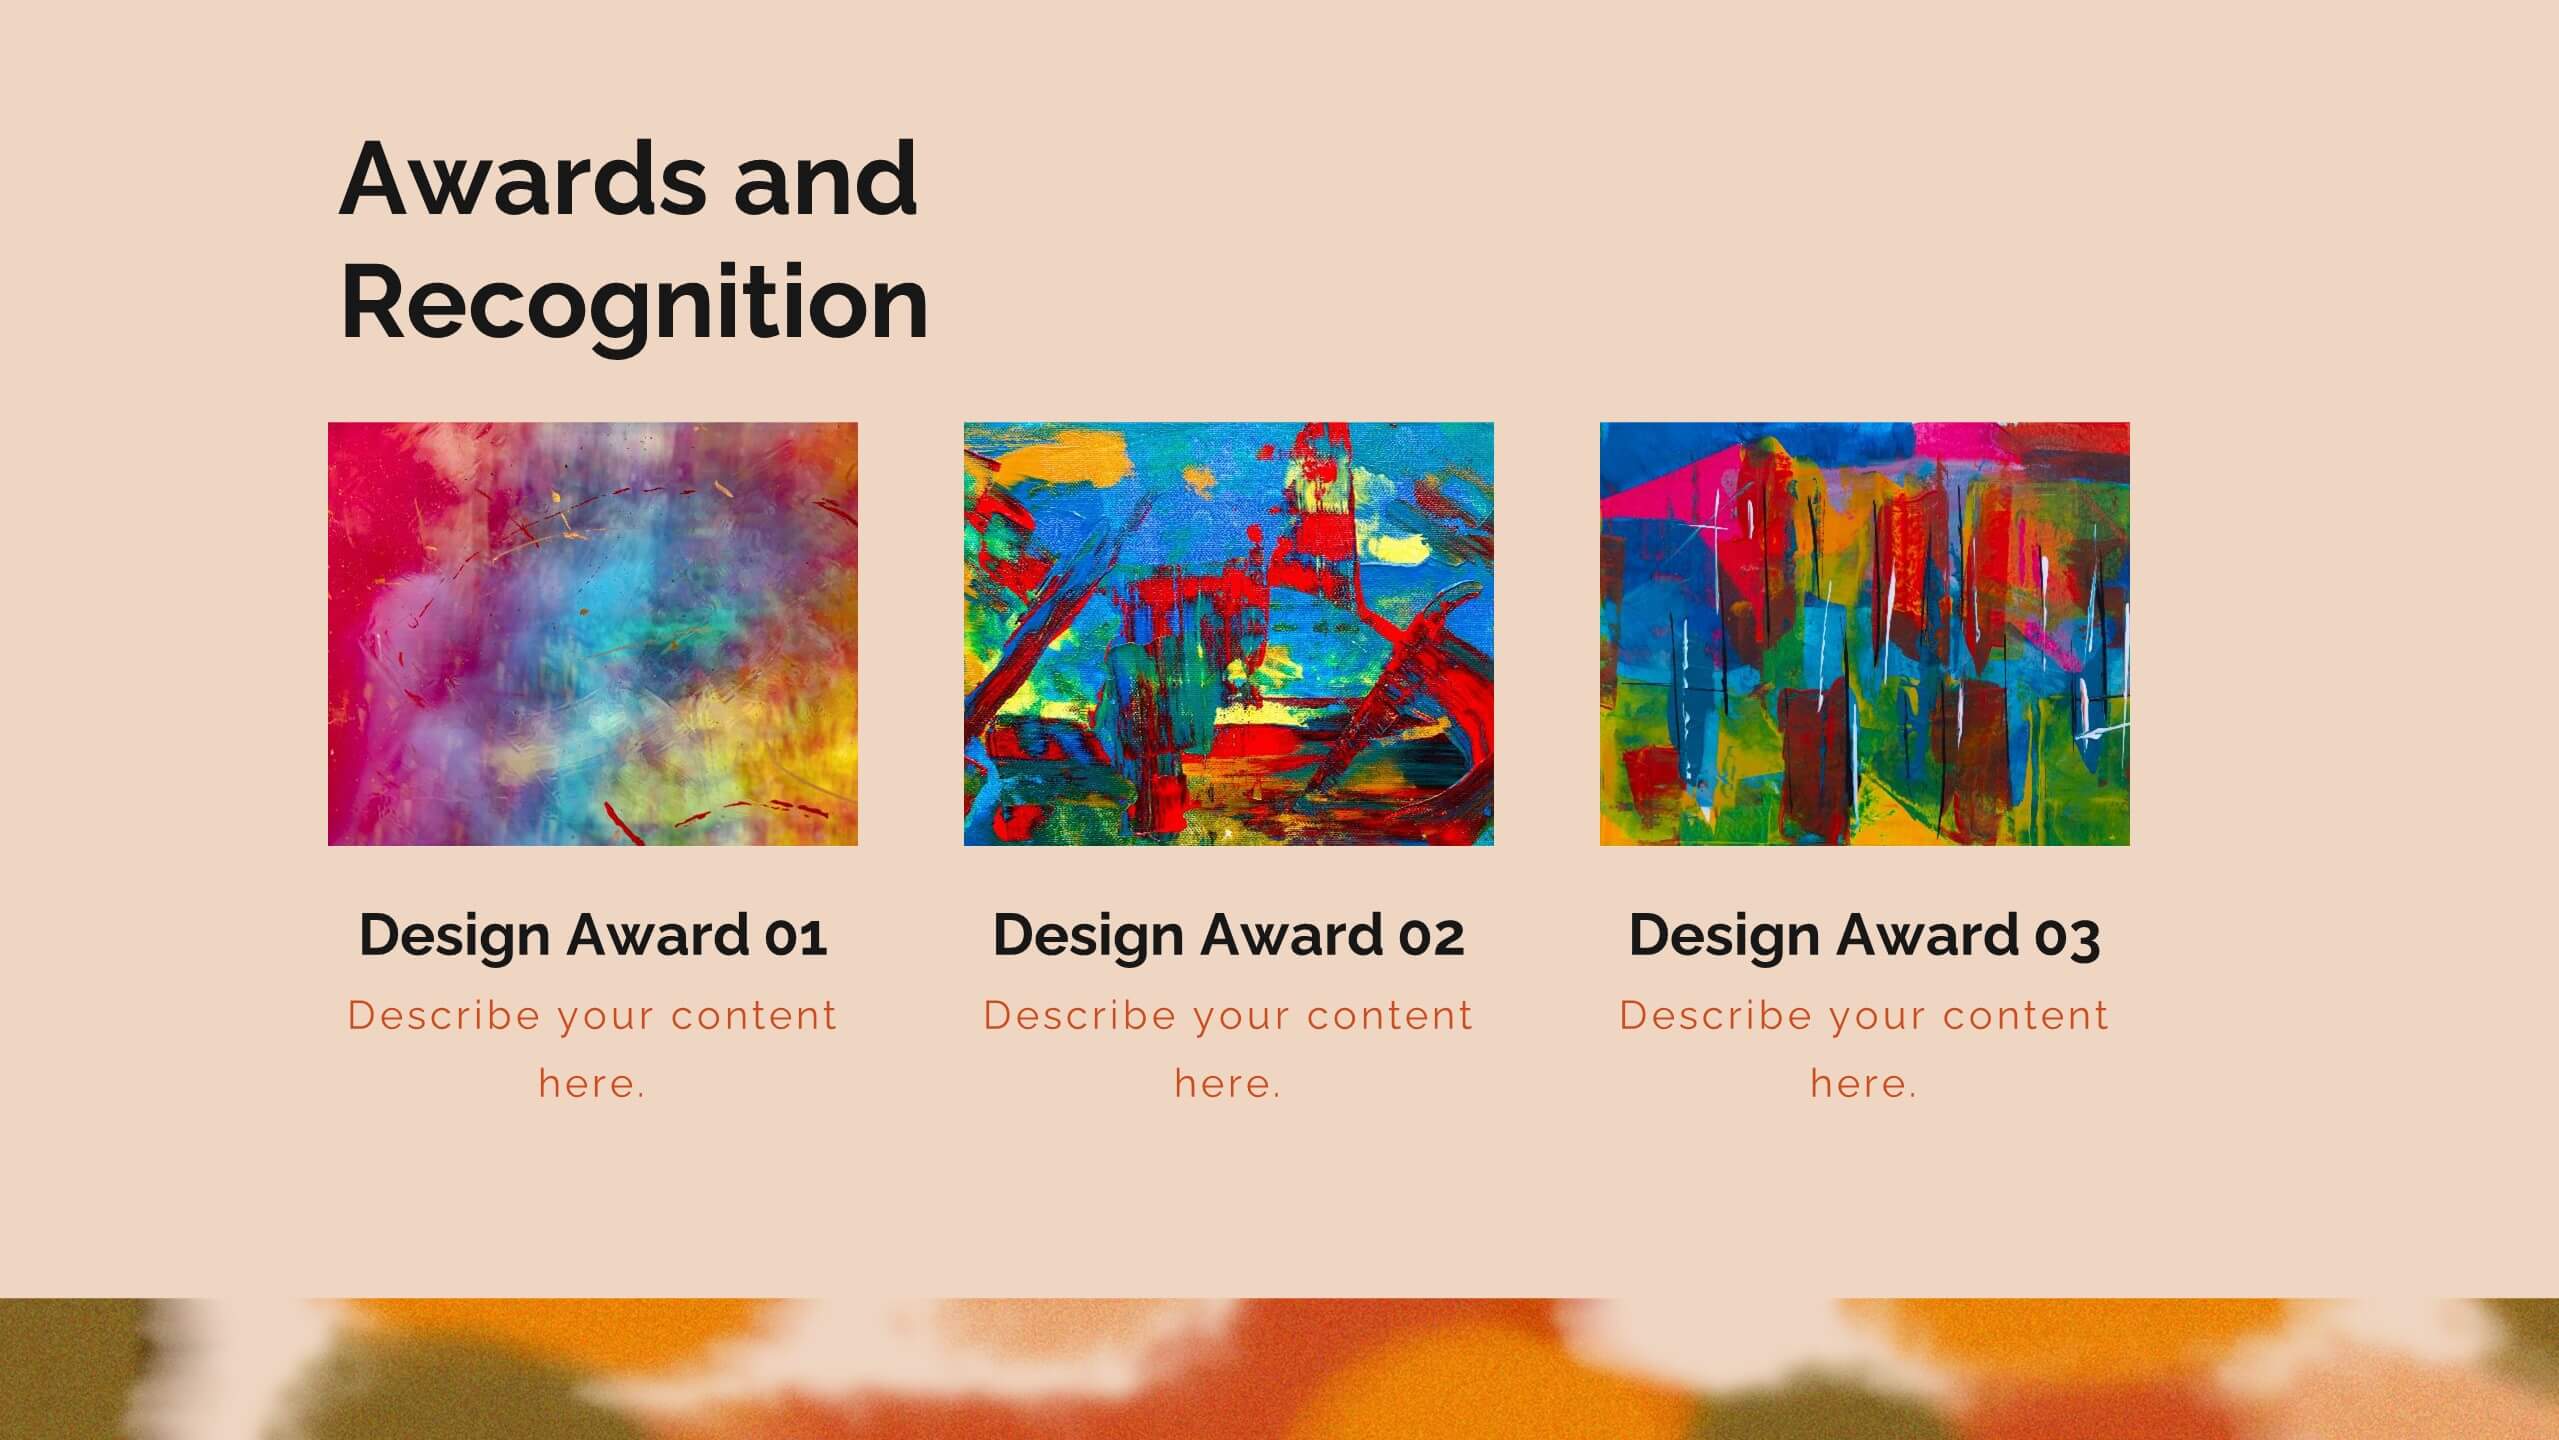
Zenith Artist Portfolio Presentation
Showcase your artistic journey with this captivating portfolio template! Perfect for presenting your projects, creative process, and client testimonials. Ideal for artists aiming to highlight their work and achievements. Compatible with PowerPoint, Keynote, and Google Slides, this template ensures your portfolio is visually stunning and professionally presented. Make your art stand out!


6 slides
Big Data Insights Visual Presentation
Transform complex analytics into clear, engaging visuals that tell a compelling story. This modern layout is perfect for showcasing data connections, performance metrics, and analytical insights in a visually balanced way. Fully editable and compatible with PowerPoint, Keynote, and Google Slides for seamless customization and professional presentations.


4 slides
IT Network Infrastructure
Simplify the complexity of your digital ecosystem with this IT Network Infrastructure presentation. Designed to visualize connectivity, servers, and system architecture, this layout is perfect for IT teams, consultants, and tech-focused reports. Fully editable in PowerPoint, Keynote, and Google Slides for seamless integration into your workflow.


20 slides
Pulsebeat Sales Proposal Presentation
Seal the deal with this compelling sales proposal template, crafted to showcase your offerings, customer value, and competitive edge with clarity. Including slides for sales objectives, process, pricing strategy, and performance metrics, it’s perfect for sales teams aiming to impress. Compatible with PowerPoint, Keynote, and Google Slides for effortless presentation.


5 slides
Visual Differentiator Comparison Slide Presentation
Make your unique selling points stand out with the Visual Differentiator Comparison Slide Presentation. This slide is designed to highlight key advantages between two offerings or brands using side-by-side stacked bars and icons. Emphasize what sets you apart at a glance. Fully editable in Canva, PowerPoint, and Google Slides.


20 slides
Obscuran Sales Performance Report Presentation
Take your sales analysis to the next level with this sleek and professional presentation template. Designed to highlight key areas such as sales objectives, process, performance metrics, competitive analysis, pricing strategy, and future opportunities. This modern layout ensures clarity and impact, making it perfect for sales teams, managers, and stakeholders. Fully customizable and compatible with PowerPoint, Keynote, and Google Slides.


4 slides
Cost Analysis and Budget Overview Presentation
Break down financial details with clarity using the Cost Analysis and Budget Overview Presentation. This slide helps you present cost structures, budget allocations, and key financial metrics side by side using icons and visual data blocks. Perfect for reports, planning, or investment decks. Fully editable in PowerPoint, Google Slides, Keynote, and Canva.


5 slides
Layered Business Pyramid Framework
Visualize business hierarchy and strategic layers with the Layered Business Pyramid Framework Presentation. This editable slide features a five-tier pyramid diagram aligned with corresponding text sections, ideal for showcasing organizational structures, workflow levels, or growth stages. Each layer is color-coded for clarity and impact, making your insights easy to digest. Fully compatible with PowerPoint, Keynote, and Google Slides.


4 slides
Market Research Survey Insights Presentation
Showcase key data from your latest research with this bold, megaphone-themed survey slide. Ideal for presenting percentages and key findings side-by-side, this layout draws attention to market trends, consumer feedback, or audience segmentation. Fully editable in PowerPoint, Keynote, and Google Slides.