


Features
- 4 Unique slides
- Fully editable and easy to edit in Microsoft Powerpoint, Keynote and Google Slides
- 16:9 widescreen layout
- Clean and professional designs
- Export to JPG, PDF or send by email


Do you have any questions?
Recommend


5 slides
Colorful Circular Flow Chart Presentation
Bring your ideas full circle with a vibrant, energetic flow that instantly grabs attention and makes complex processes feel effortless to follow. This presentation is perfect for illustrating cycles, workflows, or interconnected stages in a clear, dynamic way. Fully compatible with PowerPoint, Keynote, and Google Slides.

20 slides
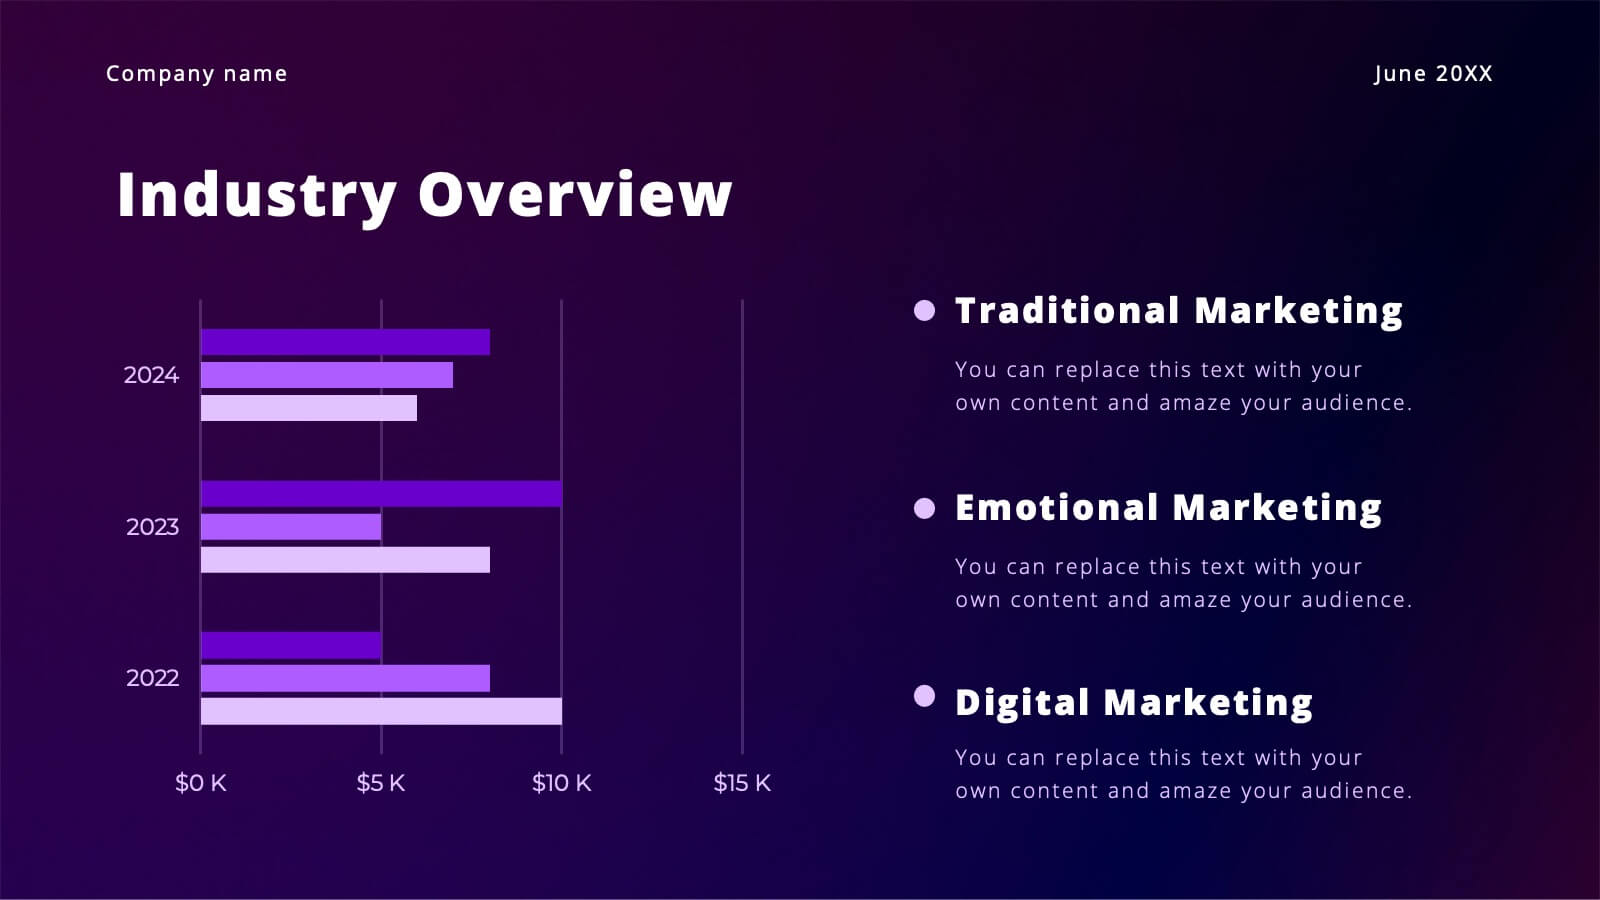
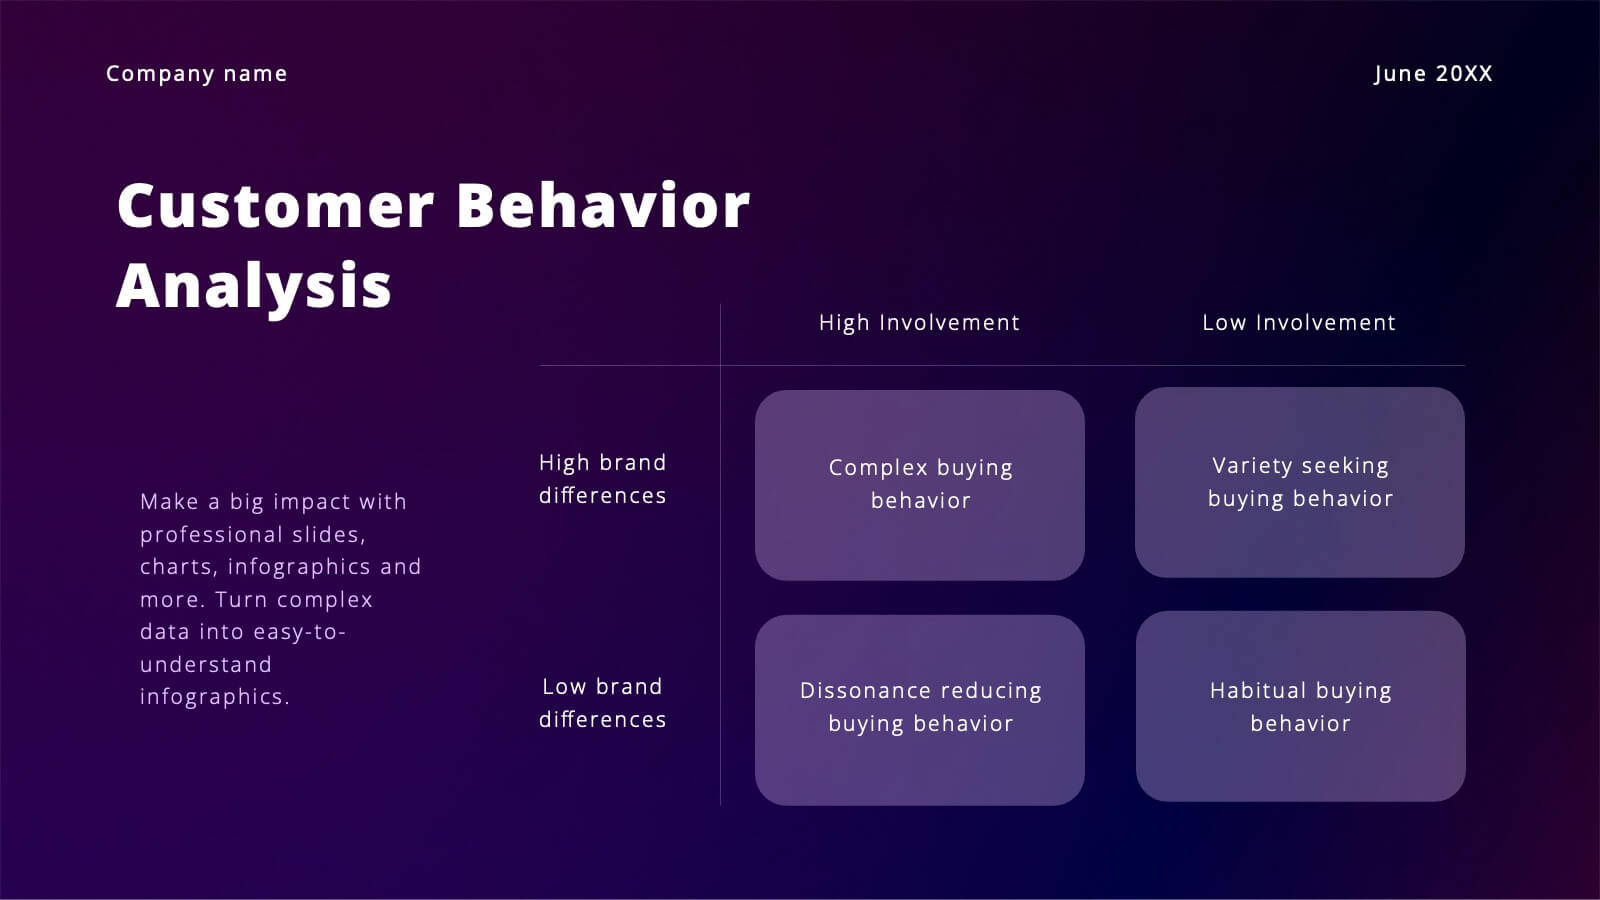
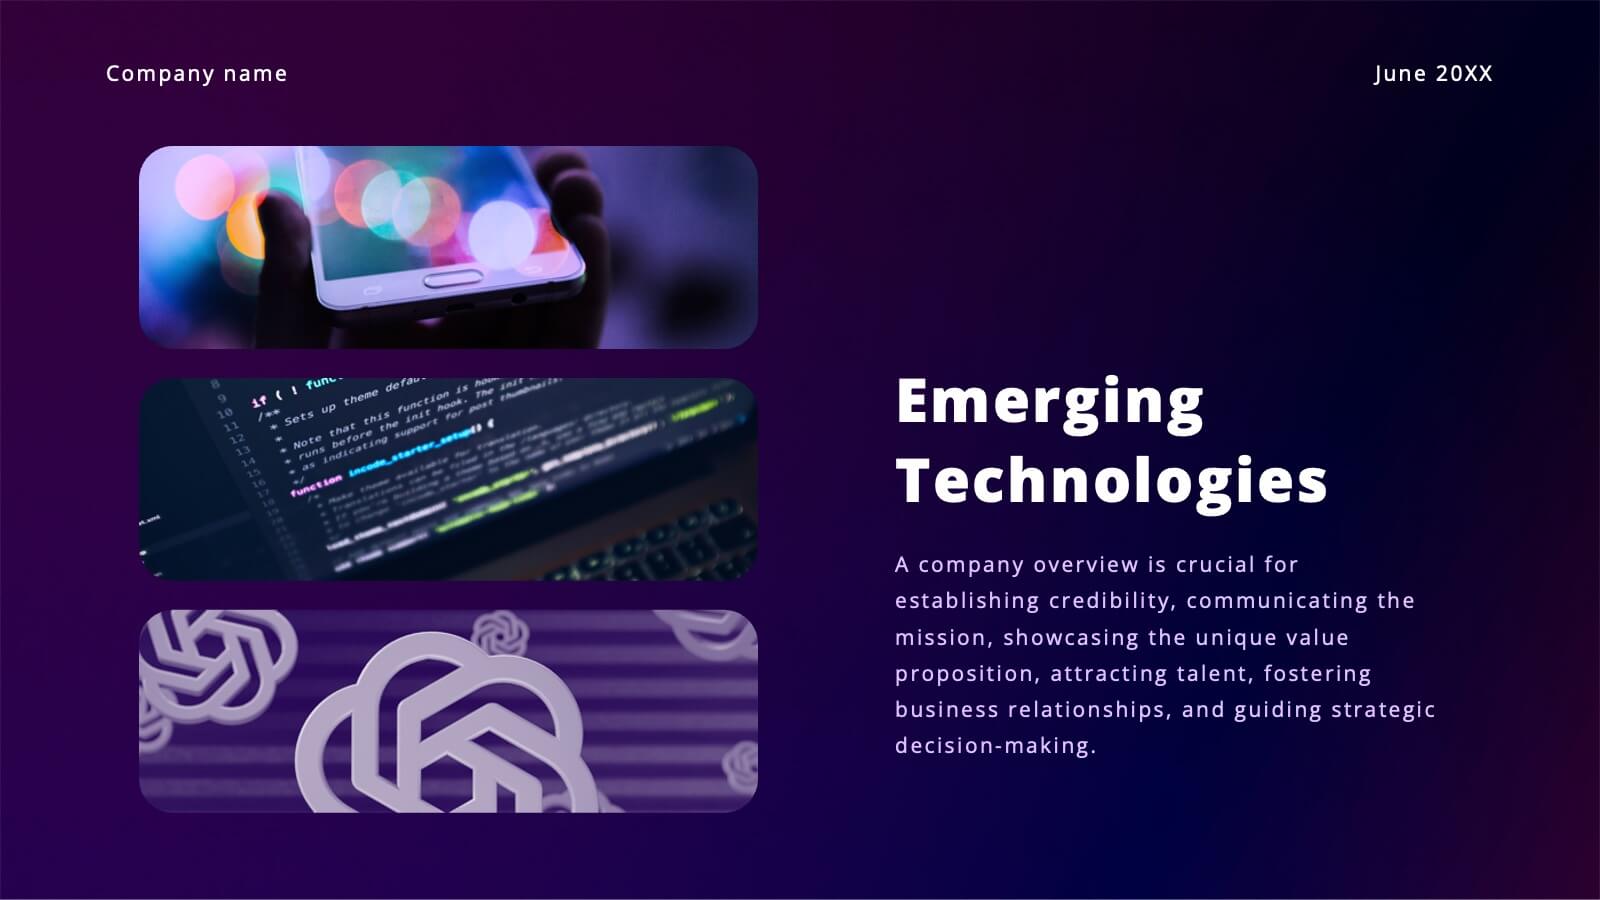
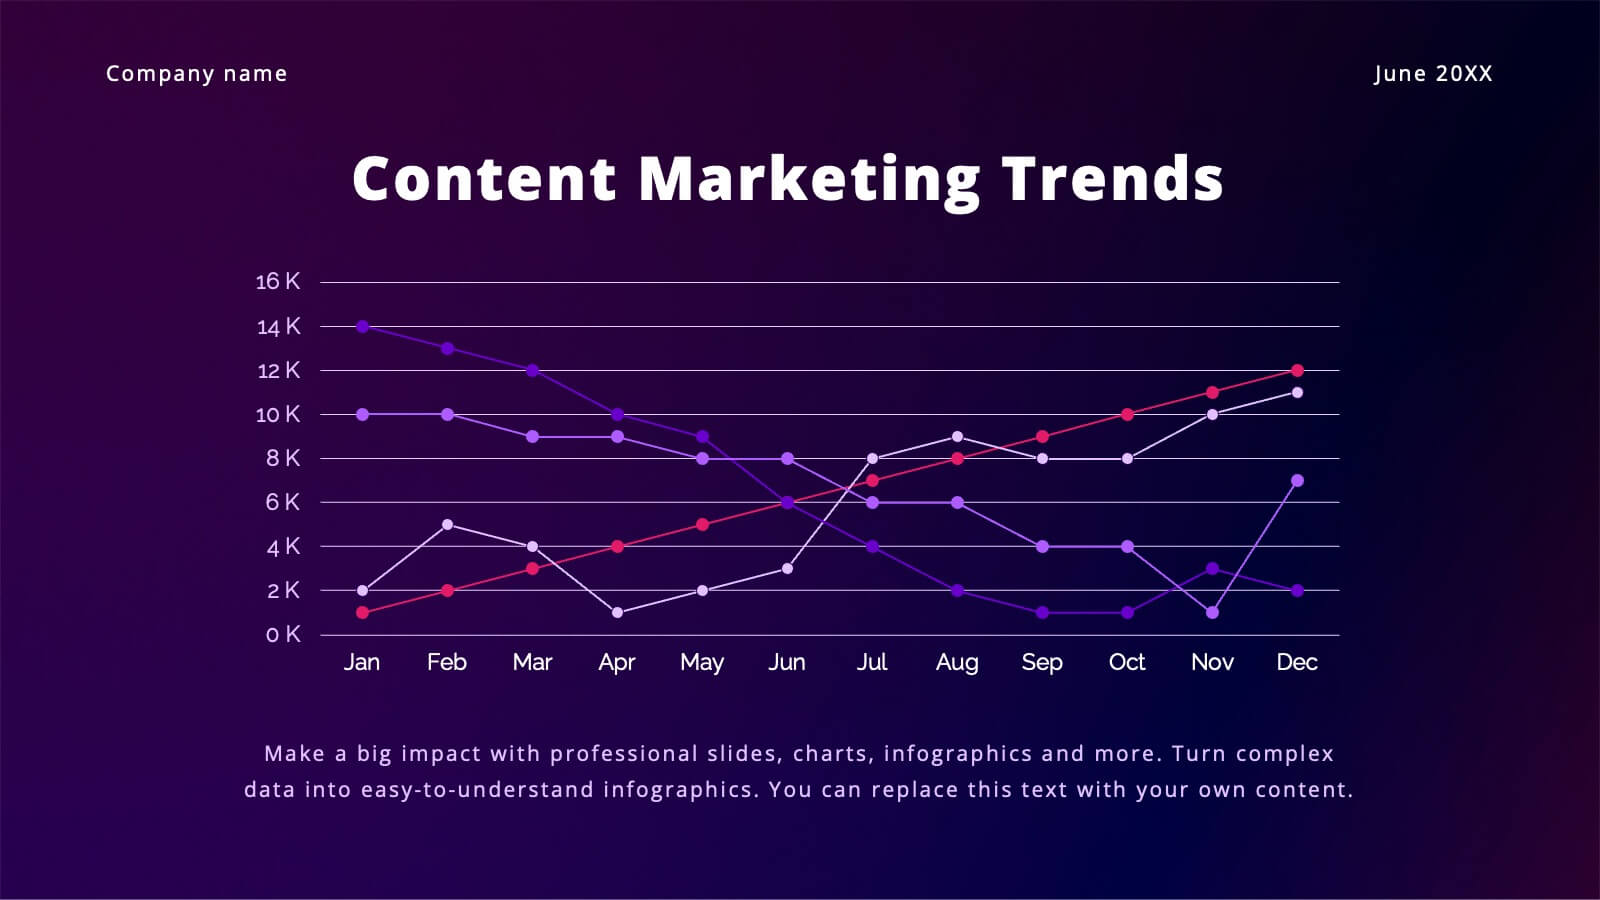
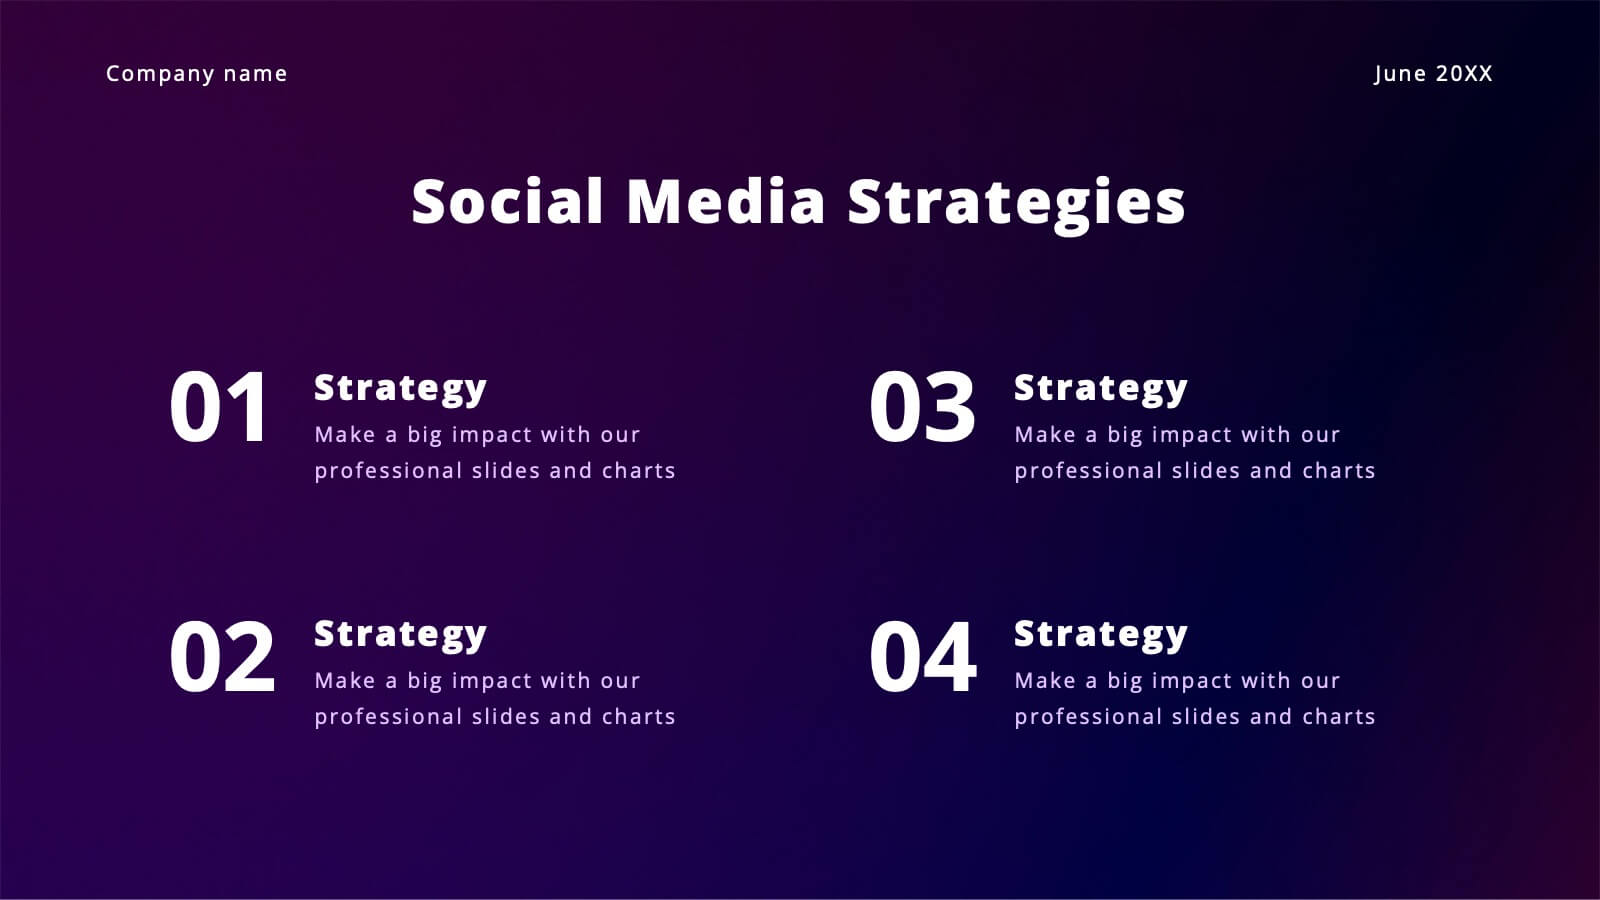
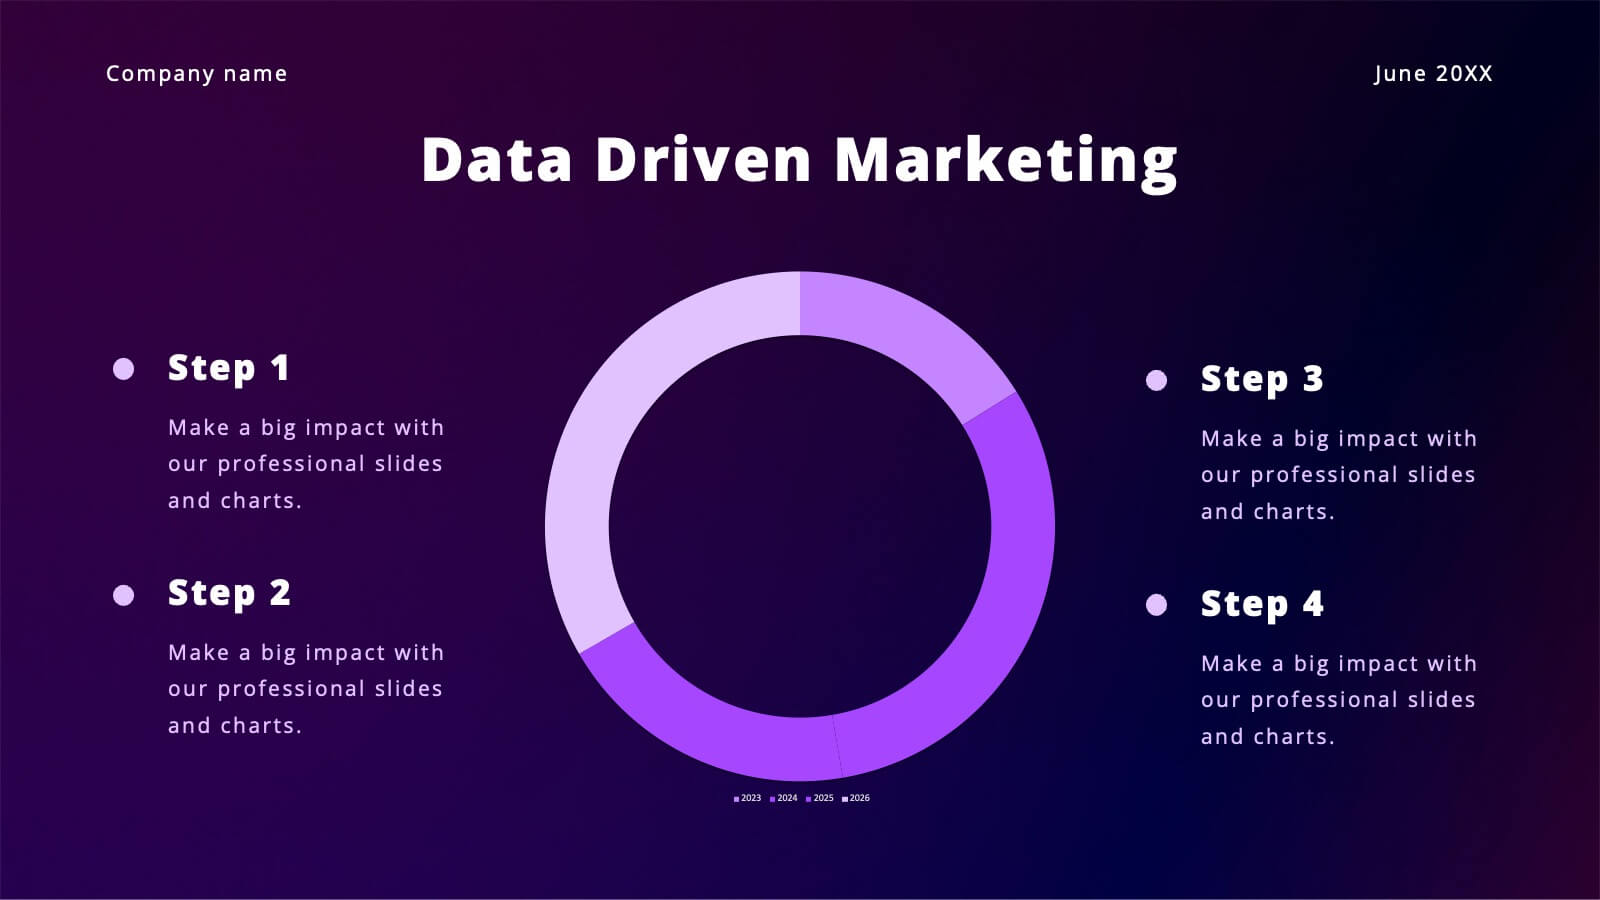
Vibrant Content Marketing Pitch Deck Presentation
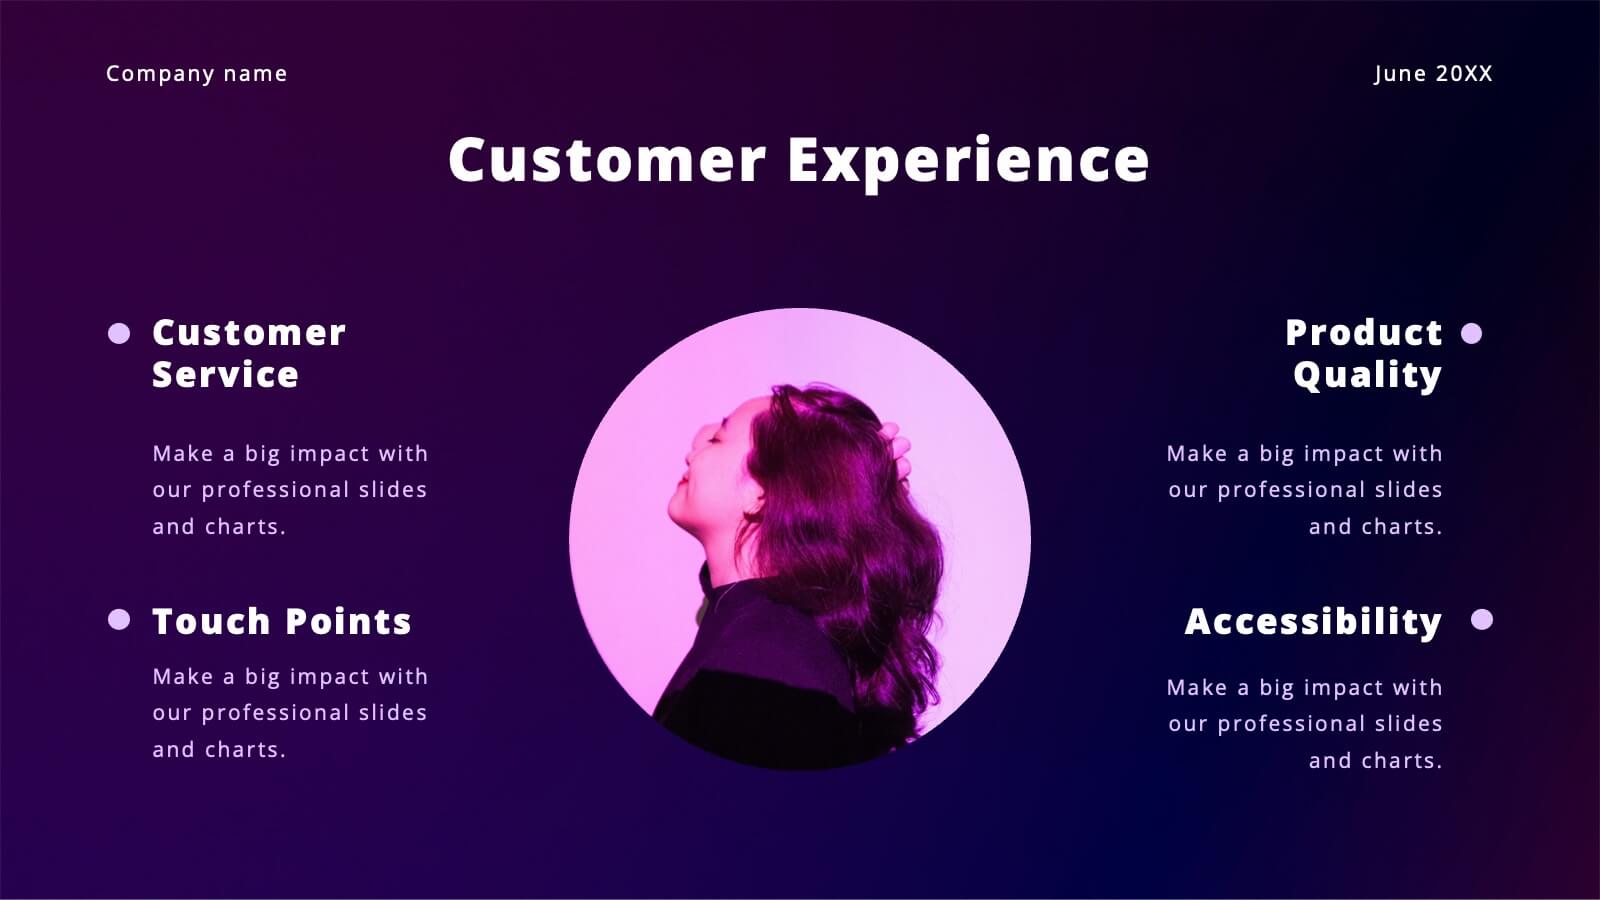
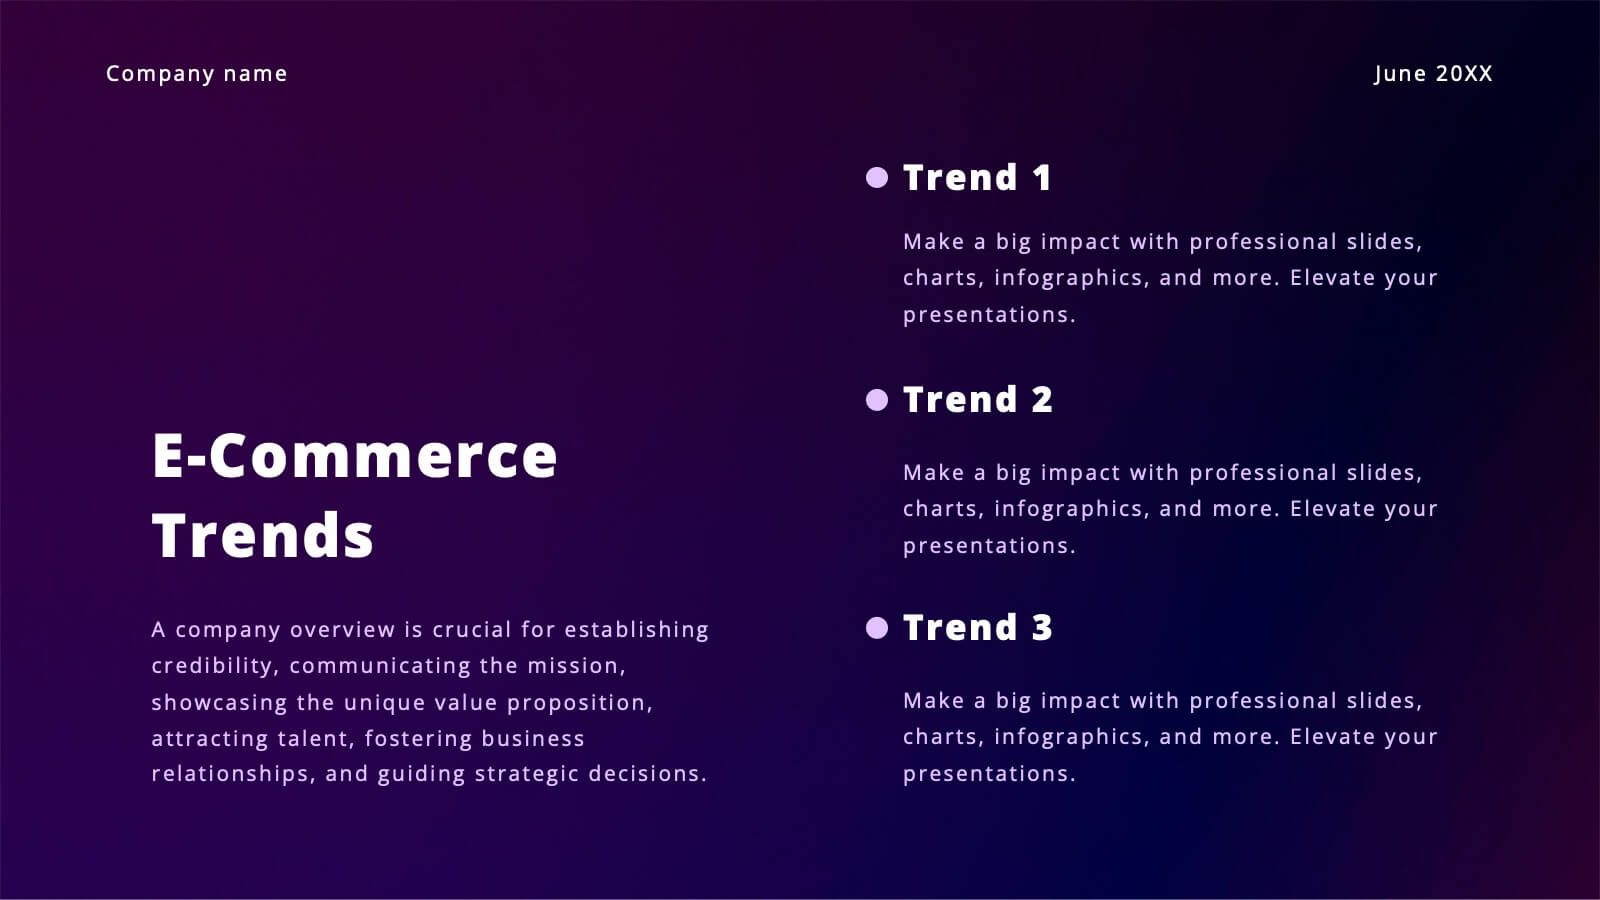
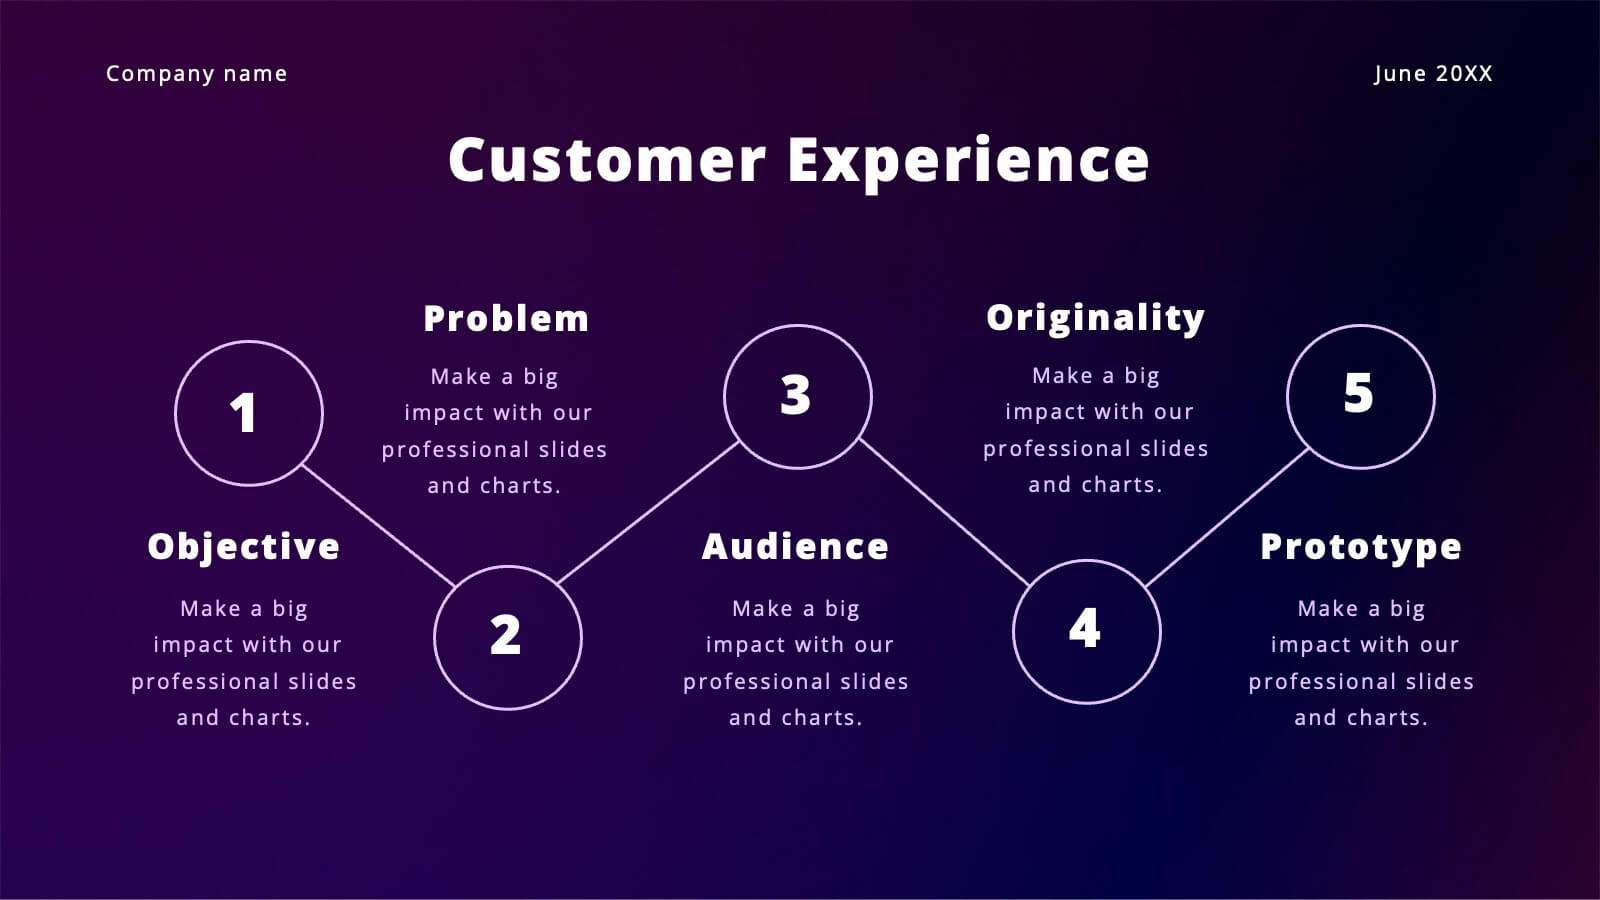
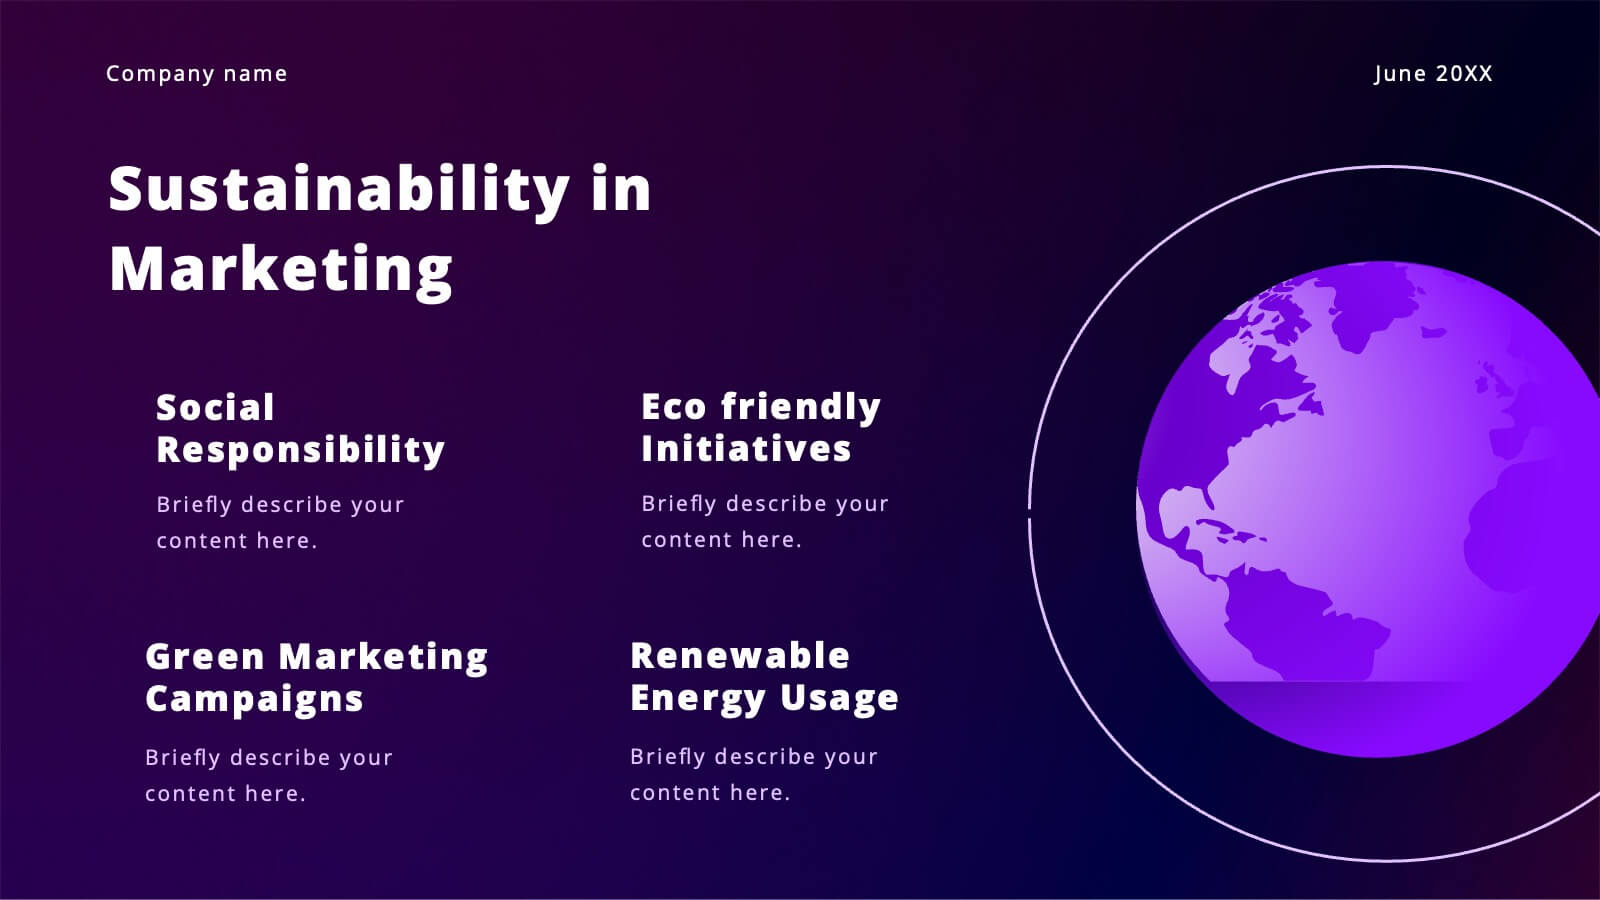
Boost your marketing pitch with this vibrant deck! Covering industry overviews, customer behavior analysis, and emerging technologies, it’s designed to captivate your audience. Highlight social media strategies, data-driven marketing, and e-commerce trends effortlessly. Perfect for presenting a comprehensive marketing plan. Compatible with PowerPoint, Keynote, and Google Slides. Make your next pitch stand out!


5 slides
New Venture Pitch Deck Structure Presentation
Outline your pitch with clarity using the New Venture Pitch Deck Structure Presentation. Designed for startups and entrepreneurs, this vertical timeline layout helps you present key sections like business model, problem/solution, and go-to-market strategy. Fully editable in PowerPoint, Canva, and Google Slides to fit your branding needs.


20 slides
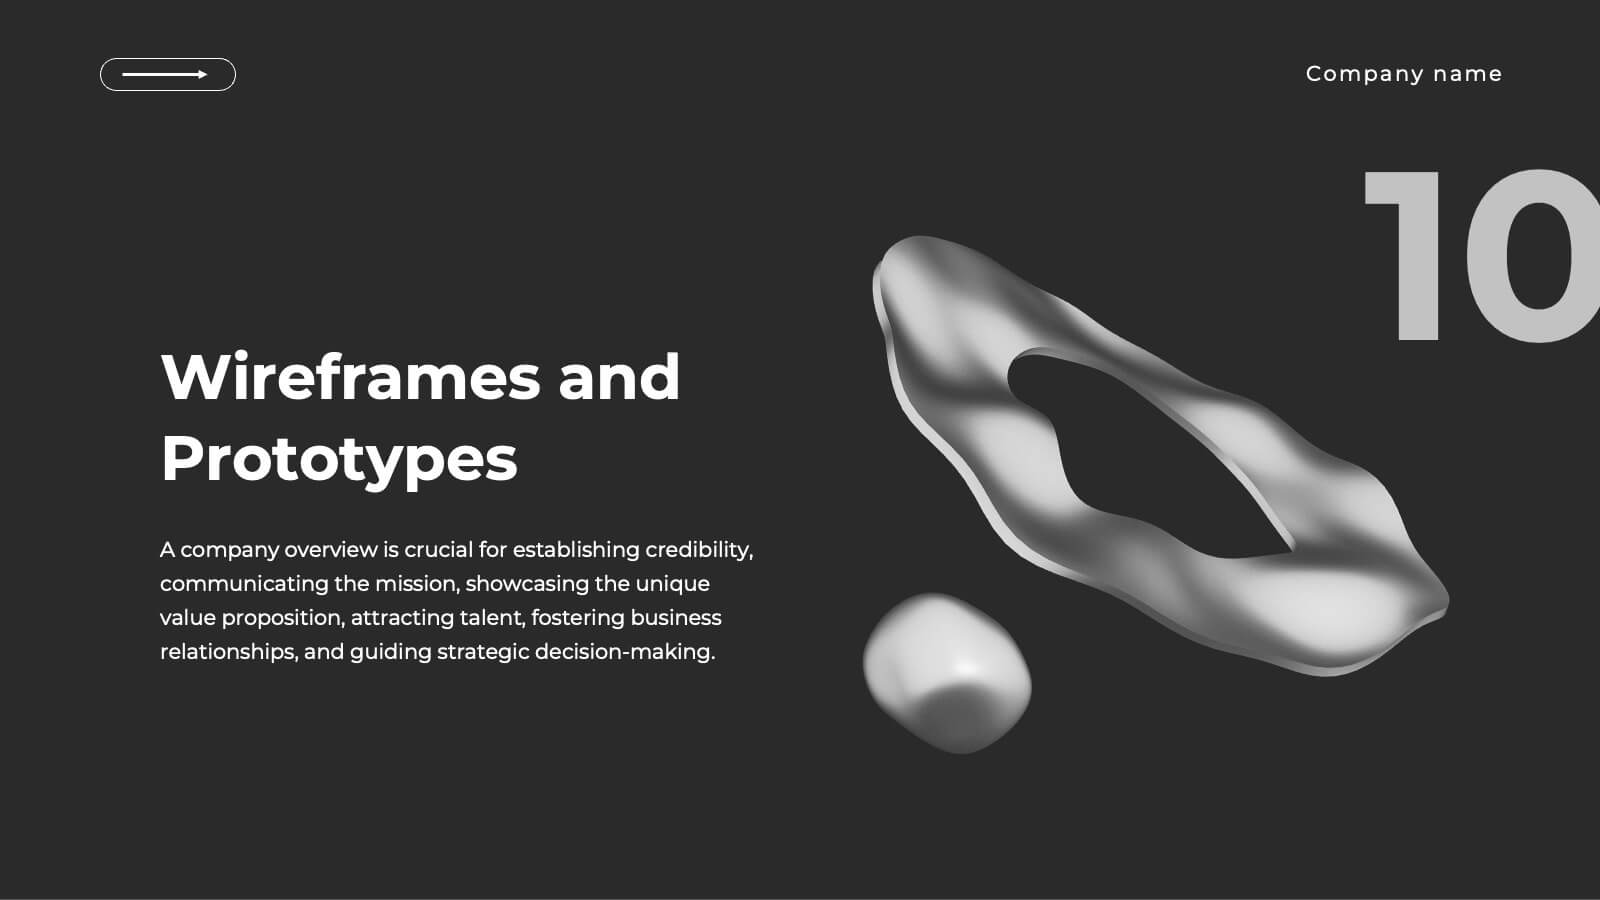
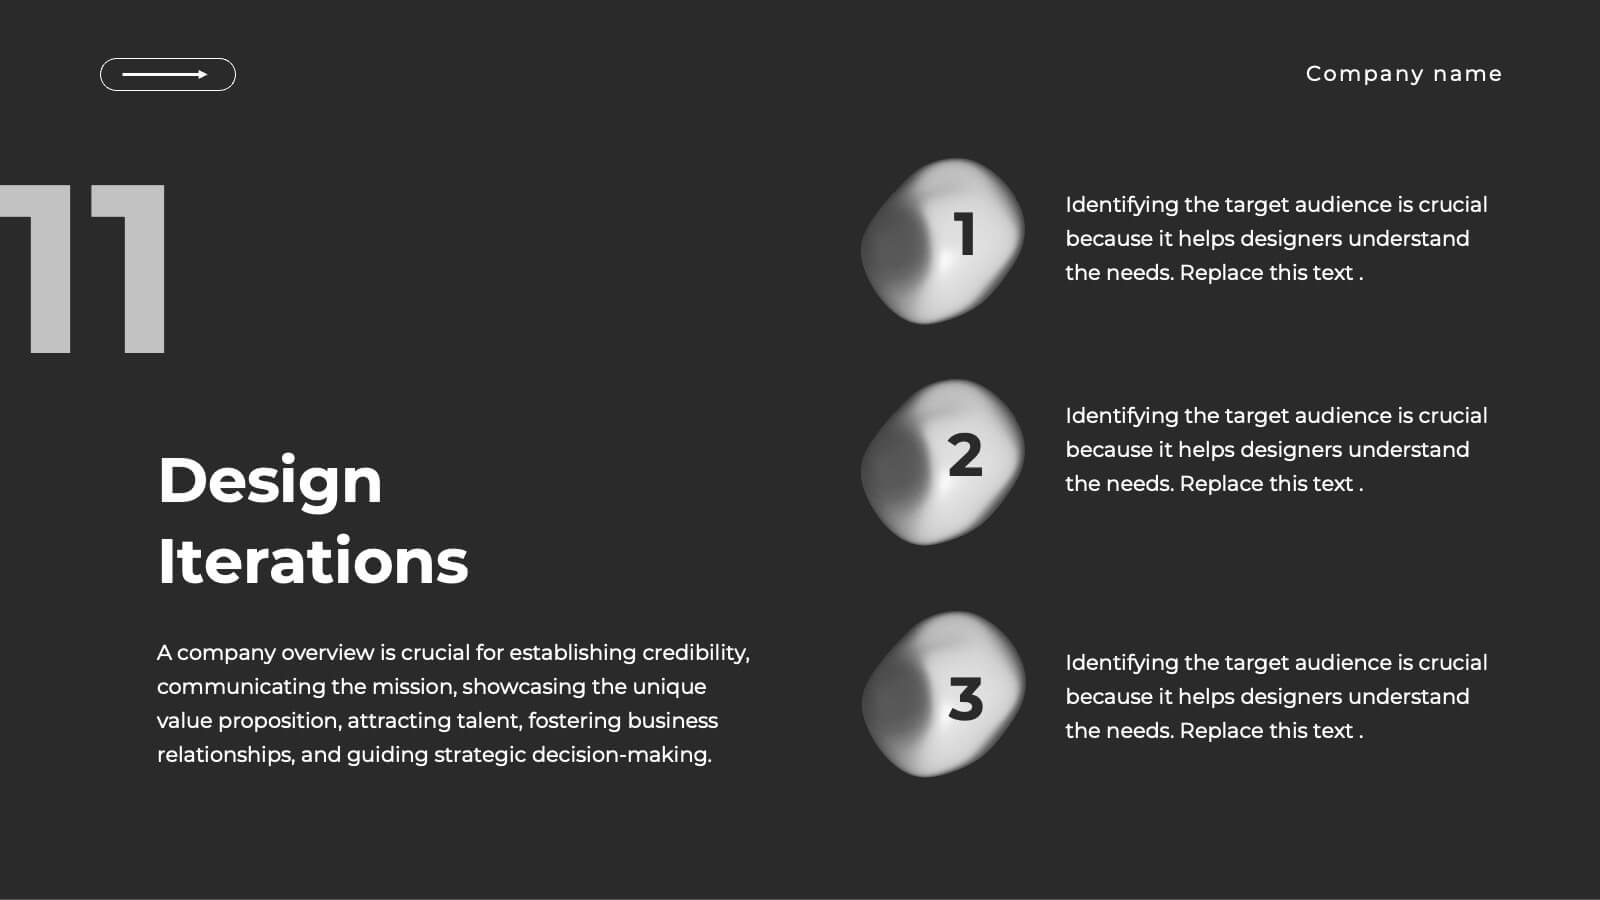
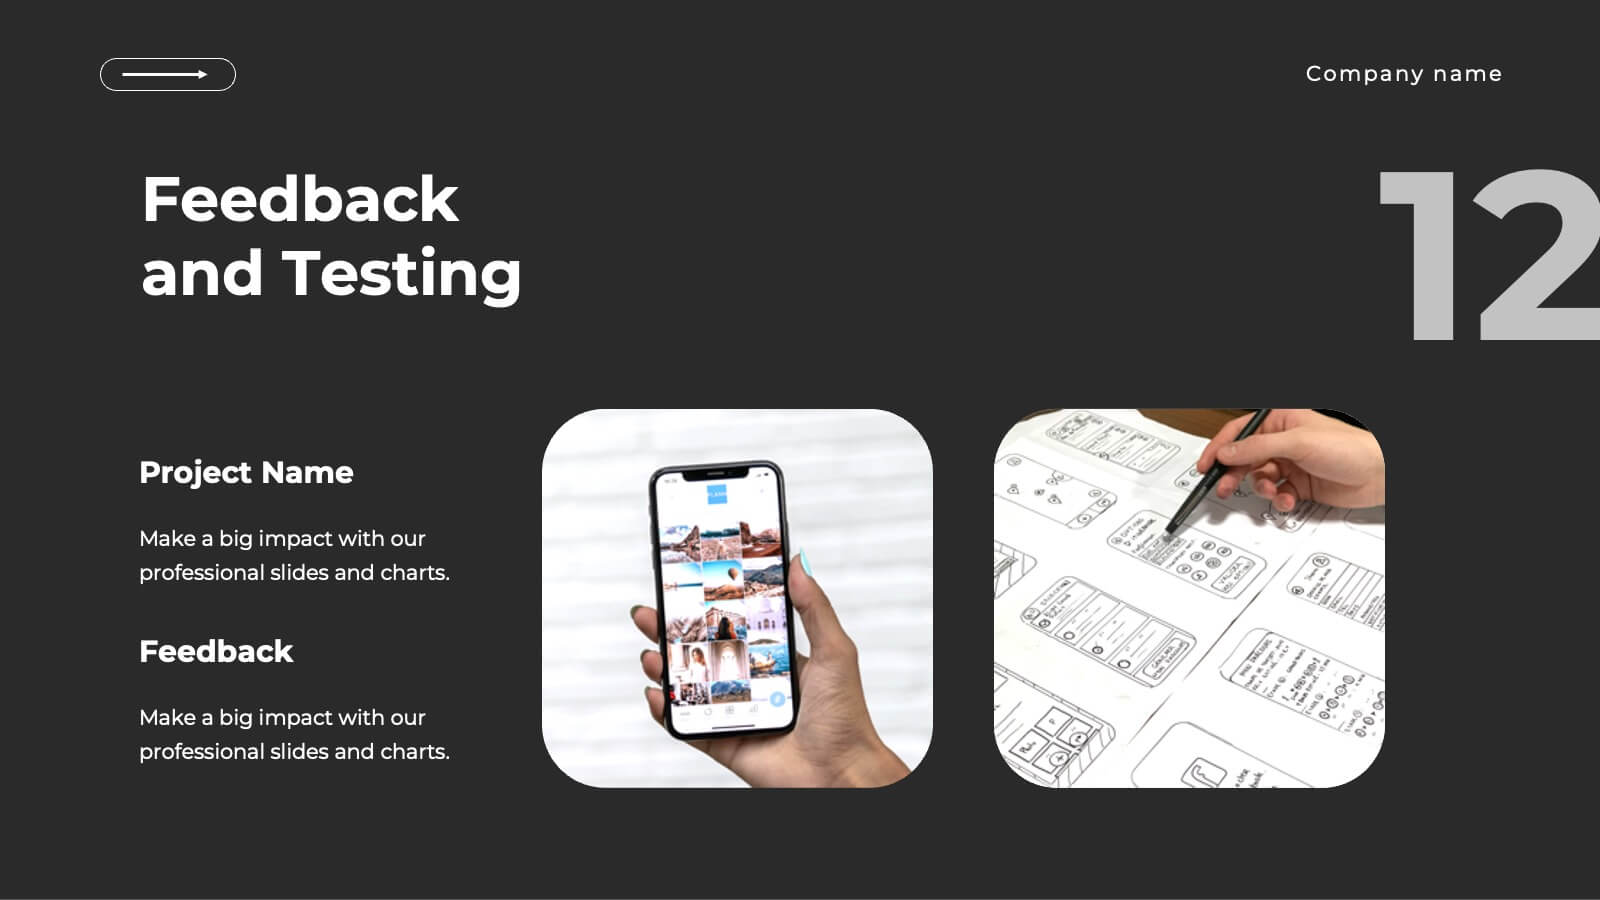
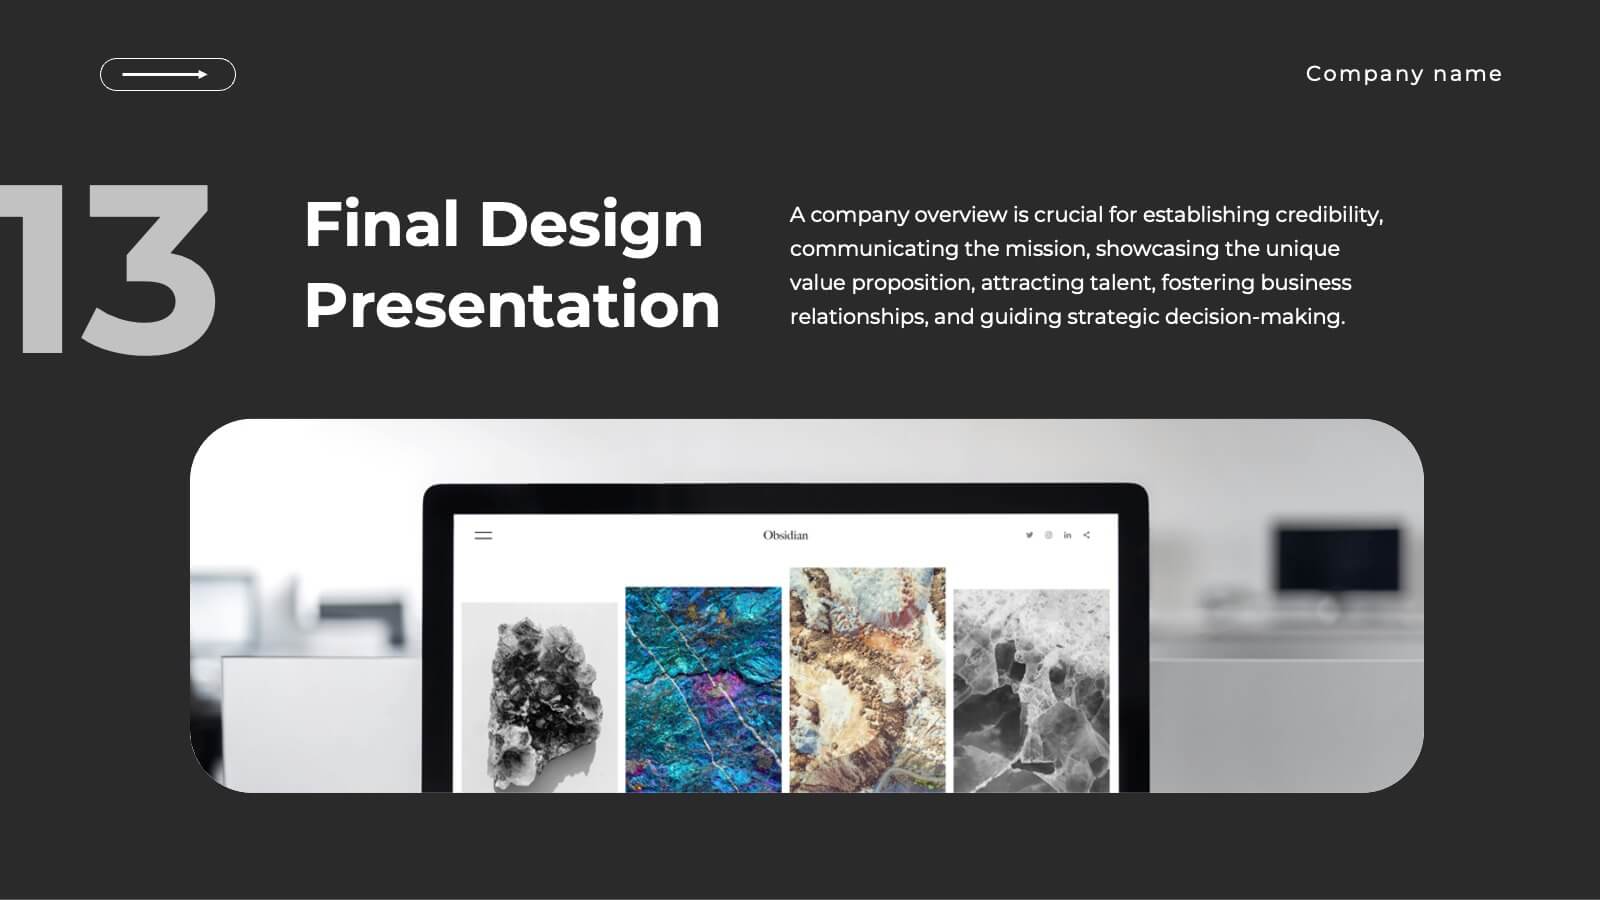
Realm UX UI Design Pitch Deck Presentation
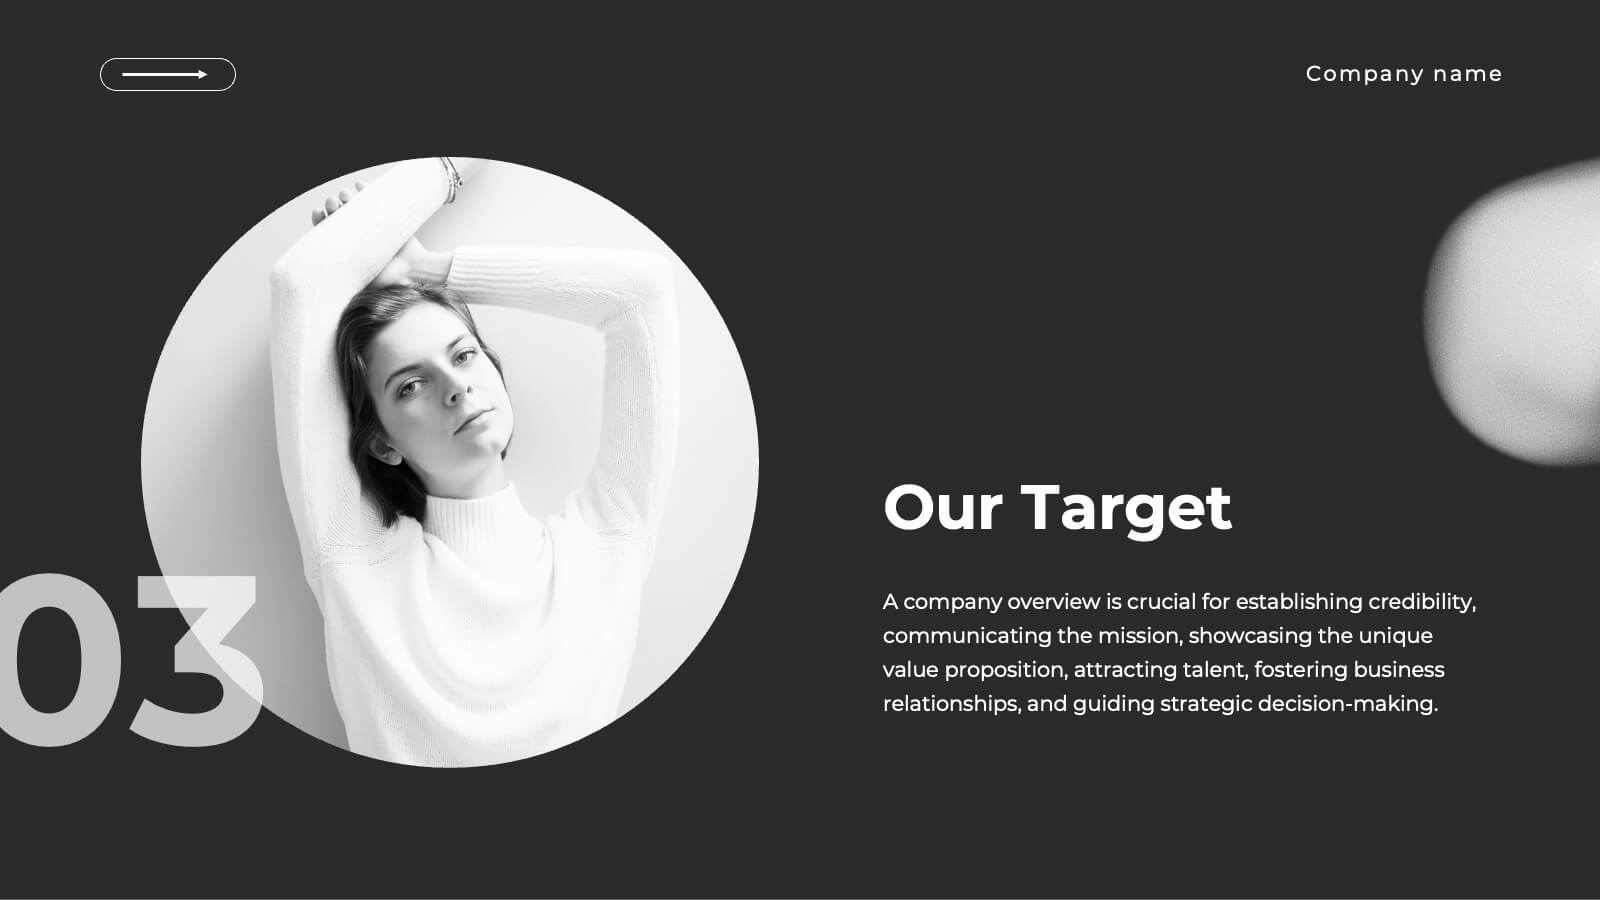
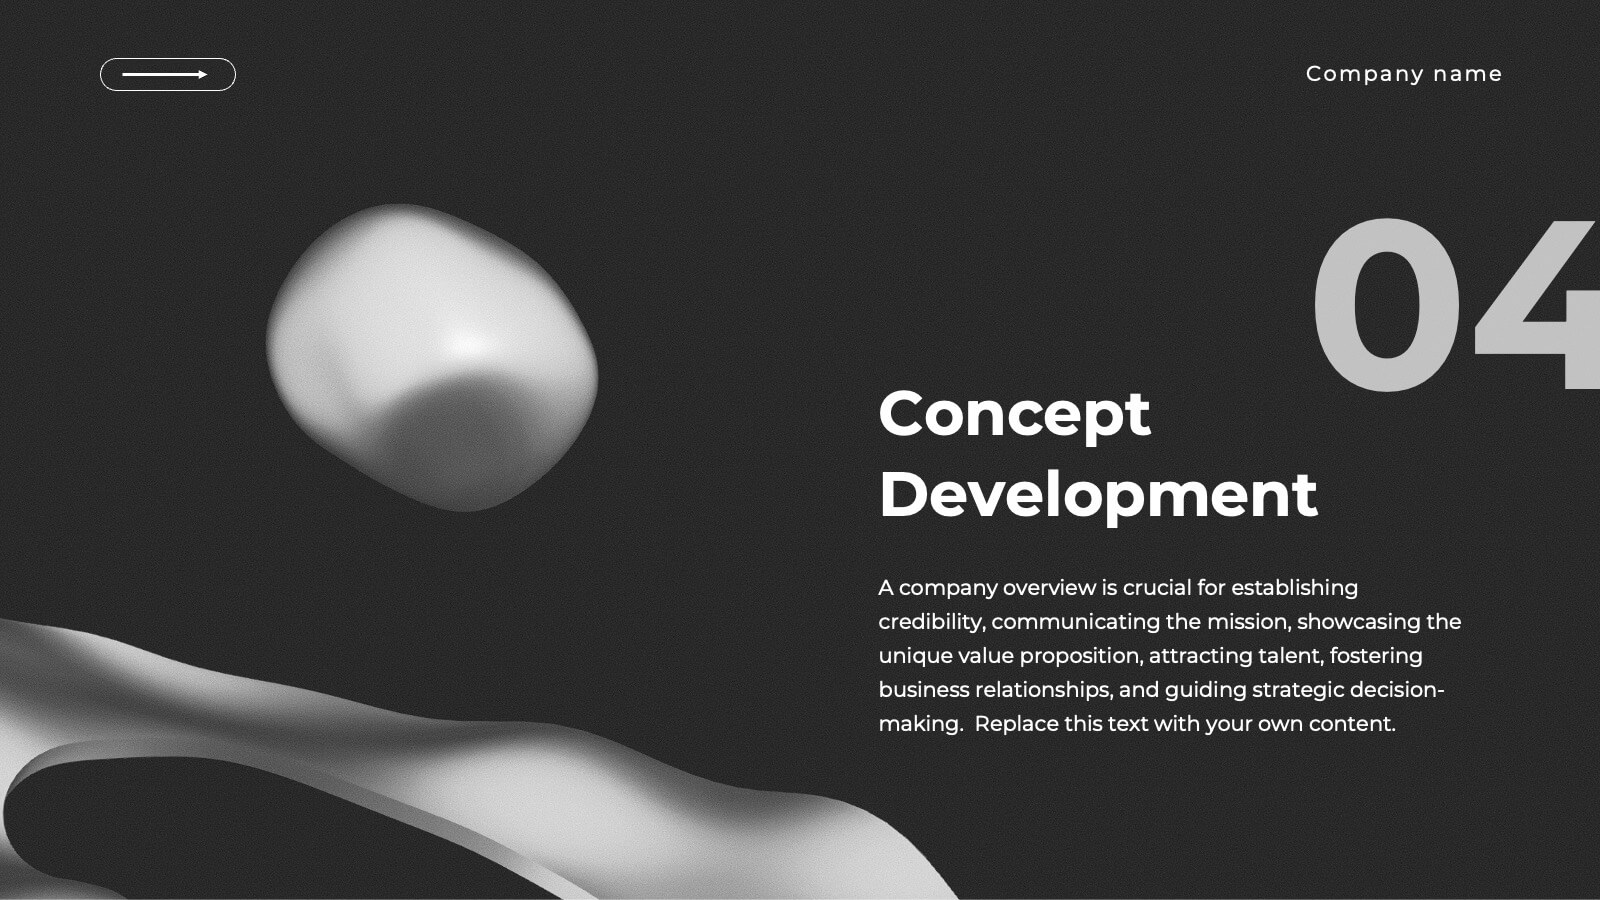
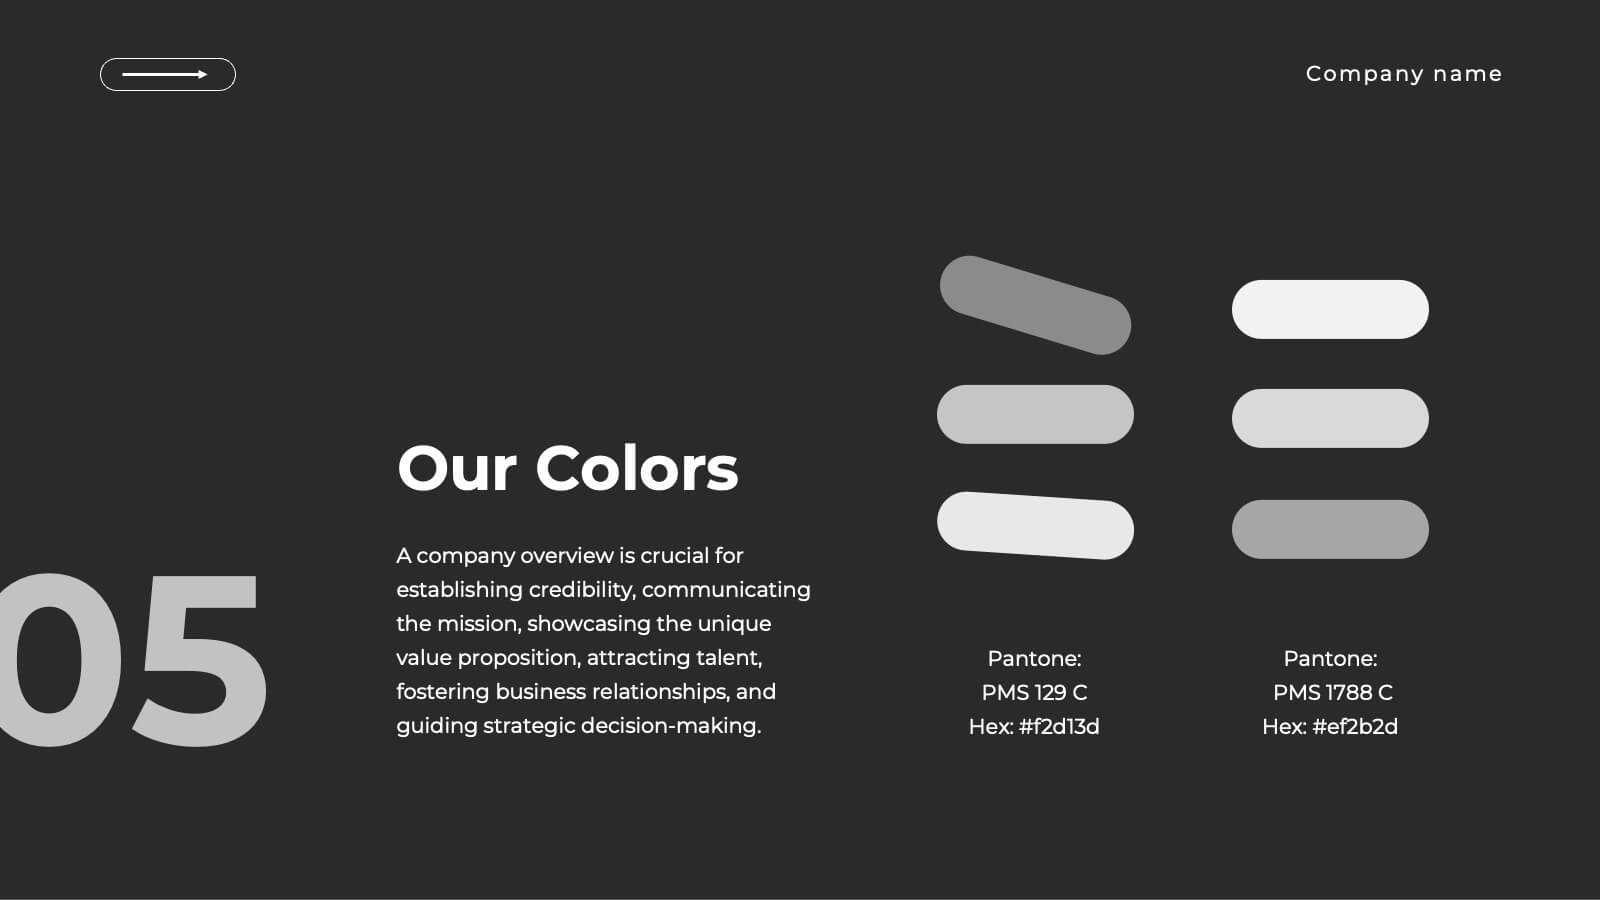
Present your UX/UI design process with this sleek and modern design template! It covers everything from concept development to wireframes, prototypes, design iterations, and final design presentation. Fully customizable and compatible with PowerPoint, Keynote, and Google Slides, it’s perfect for design teams and professionals looking to showcase their creative process effectively.


5 slides
Business Growth Cycle Presentation
Illustrate your company’s journey with the Business Growth Cycle slide. This dynamic layout features four sleek arrow segments that represent each phase of growth—from initiation to expansion. Color-coded steps and minimalist icons help guide the audience through your strategy clearly and efficiently. Ideal for outlining roadmaps, business stages, or workflow transitions. Fully editable and compatible with PowerPoint, Keynote, and Google Slides.


6 slides
Construction Project Timeline and Stages Presentation
Map out your project from groundbreaking to completion with the Construction Project Timeline and Stages Presentation. This visual timeline uses illustrated trucks to represent key construction phases—ideal for progress reports, planning reviews, or contractor briefings. Fully editable in PowerPoint, Keynote, and Google Slides.


6 slides
Investment Trust Infographic
An investment trust, also known as a closed-end fund, is a type of collective investment vehicle that pools funds from multiple investors to invest in a diversified portfolio of assets. This Infographic template visually communicates key information about investment trusts, which are financial vehicles from multiple investors to invest in a diversified portfolio of assets. This template highlights different types of investment, such as trusts, fixed-income trusts, or sector-specific trusts. The icons and images are included to represent each type. This infographic is fully customizable and compatible with Powerpoint, Keynote, and Google Slides.


5 slides
Business Opportunities Infographics
Business Opportunities refer to favorable circumstances or situations in the market that can be exploited to start a new business venture or expand an existing one. These infographic templates offers various business opportunities and potential areas for growth and success. It enables you to present market analysis, emerging trends, niche markets, global expansion opportunities, and other factors that entrepreneurs and businesses should consider. This template serves as a valuable resource for entrepreneurs, business professionals, consultants, and educators looking to explore new business possibilities or expand their existing ventures.


8 slides
Green Business Sustainability Strategy Presentation
Promote eco-friendly business strategies with the Green Business Sustainability Strategy infographic. Featuring a circular flow diagram, this template highlights key sustainable initiatives, resource management, and environmental impact strategies. Fully editable and compatible with PowerPoint, Keynote, and Google Slides.


5 slides
Multiple Lists Infographics
Unleash the power of organized information with our multiple lists infographics template, your companion for presenting diverse data. This versatile resource, steeped in a vibrant mix of orange, blue, and purple hues, caters to professionals from all sectors, aiding in the seamless conveyance of varied content, from business agendas to educational material. The template, characterized by its informative and creatively random style, integrates compelling graphics and intuitive icons. Whether you're a business leader, educator, or content creator striving for clarity and engagement, this infographic tool is tailored for an unforgettable visual impact.


26 slides
Wilten Presentation Template
This template is a design foundation, and has been built with modern esthetic principles. The shapes are organic and earthy, with image place holders to allow customization. Designed for companies that have a strong connection to nature and the aesthetic, who wants to go beyond just being organic. Wilten template allows you to save time while getting the best result possible. A great clean modern template for creative agencies, business or branding deck. Enhance your presentations with this minimalistic design and impress your audience with smart ideas.


6 slides
Children's Smile Rating Infographic
Smile Rating refers to a method of evaluating customer satisfaction or user experience by measuring the positive emotional response elicited, often in the form of a smile. This infographic template is a visually engaging way to showcase customer satisfaction or feedback using smiley faces to represent different levels of happiness or contentment. This type of infographic is commonly used in customer service, user experience, and feedback analysis. This can provide valuable insights into emotional engagement and satisfaction. This infographic is designed to focus on providing services or products that are intended to create a positive and enjoyable experience.


7 slides
Customer Empathy Map Infographic Presentation
An Empathy Map infographic is a visual tool used to help understand the needs, wants, and behaviors of a particular customer. This template is a perfect way to gather and organize information about a person's experience and perspective, in order to better understand their motivations and desires. This empathy map infographic consists of a diagram that is divided into four quadrants: what the user thinks and feels, what they hear, what they see, and what they do. In each quadrant, information is gathered about the user's thoughts, feelings, and actions related to a particular product or service.


4 slides
Cost Breakdown for Business Planning Presentation
Visually balance your budget strategy with the Cost Breakdown for Business Planning Presentation. Featuring a scale-style layout, this slide helps you compare two financial metrics or allocations with clarity and simplicity. Ideal for showcasing trade-offs, resource planning, or funding distribution. Fully editable in PowerPoint, Google Slides, Keynote, and Canva.


6 slides
Funding Request Project Proposal
Visually communicate your project's financial needs using this tiered Funding Request Project Proposal slide. With a stacked layout ideal for outlining budget categories or funding stages, it’s perfect for grant applications, investor decks, or internal pitches. Fully customizable in PowerPoint, Keynote, and Google Slides.


21 slides
Goldenshadow Professional Portfolio Showcase Presentation
A refined portfolio presentation template crafted to highlight professional achievements and expertise. Showcase featured projects, collaborations, and client testimonials with a sleek, modern design. Includes sections for services offered, awards, pricing, and contact information. Fully customizable and compatible with PowerPoint, Keynote, and Google Slides for impactful portfolio presentations.


26 slides
Agile Project Management Presentation
Elevate your project management approach with our Agile Project Management presentation template. Compatible with PowerPoint, Keynote, and Google Slides, it's designed to adapt to any presentation environment effortlessly. Ideal for project managers, team leaders, and agile enthusiasts, this template is engineered to illustrate the flexibility and efficiency of agile methodologies in project execution. Our Agile Project Management template is a powerful tool for demonstrating the benefits of agile processes, including increased adaptability, improved stakeholder engagement, and enhanced product quality. With a series of well-organized slides, it guides you through the agile journey, from project inception to completion. The template offers a diverse range of slides that cover all facets of agile project management, including sprint planning, daily stand-ups, and retrospectives. This template is not just visually appealing but also rich in content, providing ample space to detail out roles, responsibilities, and timelines. It ensures that your team and stakeholders are aligned with the project goals, making complex information accessible and understandable. Unlock the potential of your projects with this SEO-optimized template, and become the go-to source for agile project management strategies.