


Features
- 8 Unique slides
- Fully editable and easy to edit in Microsoft Powerpoint, Keynote and Google Slides
- 16:9 widescreen layout
- Clean and professional designs
- Export to JPG, PDF or send by email


Do you have any questions?
Recommend


7 slides
Consulting Business Strategy Infographic Presentation
A company’s business strategy is a plan that helps it achieve its goals and meet long-term objectives. A business strategy should be designed to fulfill the company’s mission, vision, and values. This template is designed to make your business or company plan, easy to understand and present in a professional way with the best design. This template can be used to present your company's strategic vision, long-term goals, and key initiatives. With its colorful and dynamic design, this can attract your audience’s attention, while also providing them with useful information about your strategy.


6 slides
Tourism and Hospitality Industry Trends Presentation
Visually map out emerging trends with this engaging circular infographic layout. This slide features six labeled segments connected to a central tourism icon, ideal for highlighting key industry insights, traveler behavior shifts, or hospitality service updates. Sleek and professional, it's perfect for travel agencies, hotel chains, or tourism reports. Fully customizable in PowerPoint, Keynote, and Google Slides.


8 slides
Tech Product Showcase Mockup Presentation
Highlight your mobile or app-based product with this sleek tech showcase slide. Featuring a realistic smartphone mockup alongside three content sections, it's perfect for presenting app features, service tiers, or UI comparisons. Fully customizable in PowerPoint, Keynote, or Google Slides to suit tech startups, product demos, or marketing presentations.


4 slides
Innovation with Design Thinking Framework Presentation
Drive innovation with the Design Thinking Framework presentation. This visually engaging layout structures ideas, processes, and solutions into a clear and adaptable design. Perfect for brainstorming sessions, business strategy meetings, and creative problem-solving. Fully customizable and compatible with PowerPoint, Keynote, and Google Slides for a seamless workflow.


8 slides
Annual Highlights and Key Achievements Presentation
Showcase your biggest wins with this award-themed highlights slide. Featuring colorful trophy icons, it’s perfect for summarizing yearly accomplishments or milestones. Each section is clearly labeled to spotlight key points. Fully editable and compatible with PowerPoint, Keynote, and Google Slides—ideal for business recaps, team recognition, or performance reviews.


4 slides
Home Design and Architecture Presentation
Showcase Home Design and Architecture with this layered house-themed presentation template. This stacked structure layout effectively illustrates key concepts such as floor planning, architectural elements, space optimization, and construction insights. Ideal for architects, interior designers, and real estate developers, this template helps communicate design strategies and structural layouts with clarity. Fully customizable and compatible with PowerPoint, Keynote, and Google Slides.


4 slides
UX Empathy Map Design Presentation
Spark deeper user understanding with a layout that turns thoughts, feelings, and behaviors into clear visual insights. This presentation helps teams explore customer motivation and improve product decisions through a simple, structured empathy-mapping framework. Fully compatible with PowerPoint, Keynote, and Google Slides.


7 slides
Investment Bank Infographic Presentation
An investment infographic helps investors understand complex investment concepts by presenting information in a clear and concise manner. This is a professional Investment template with all the elements you need to make a great impact. Use this presentation to help you explain a new investment opportunity, or show the benefits of your product or service. Designed for use in PowerPoint, Keynote and Google Slides, it is easy to customize and fully editable, making it a perfect starting point for any investor or financial pitch. You can change the texts, image and shapes as you wish!


5 slides
Leadership and Team Management
Showcase roles, responsibilities, and the structure of your team with this clear and engaging leadership diagram. Ideal for HR professionals, team leads, and project managers to explain reporting lines and team composition. Easily editable in PowerPoint, Keynote, and Google Slides—customize colors, icons, and content in minutes.


22 slides
Athena Creative Design Report Presentation
Showcase your creative projects with this vibrant design report template! Highlight objectives, concept development, prototypes, and design iterations with sleek visuals. Perfect for designers and creative teams. Compatible with PowerPoint, Keynote, and Google Slides.


20 slides
Aeneas Sales Proposal Presentation
Seal your next deal with this professional sales proposal template. It covers key sections like objectives, pricing strategy, and target market, offering a comprehensive layout for your pitch. Ideal for impressing clients, it's compatible with PowerPoint, Keynote, and Google Slides for smooth, impactful presentations.


7 slides
Investment Management Infographic
Investment management, also known as asset management or fund management, involves the professional management of various securities and assets with the goal of achieving specific investment objectives for individuals, institutions, or entities. This infographic will encourage your audience to start or enhance their investment journey for financial prosperity. Customize the content, design, and visuals to craft an engaging and informative infographic that educates about investment management. This infographic should serve as a useful guide for both beginners and those looking to refine their investment strategies.


7 slides
Chart Comparison Infographic Presentation
Chart Comparison is the process of comparing different charts or graphs to identify similarities. It involves analyzing multiple sets of data by visually presenting them in charts. Use this template to show the comparison of various charts and how things look when they are compared. This template will help you create a professional Infographic presentation that highlights the key differences between data sets. Each chart can have it's own color, so you can use any color you want. You can also add text in the chart with your own content, and edit in Powerpoint, Keynote, or Google Slides.


27 slides
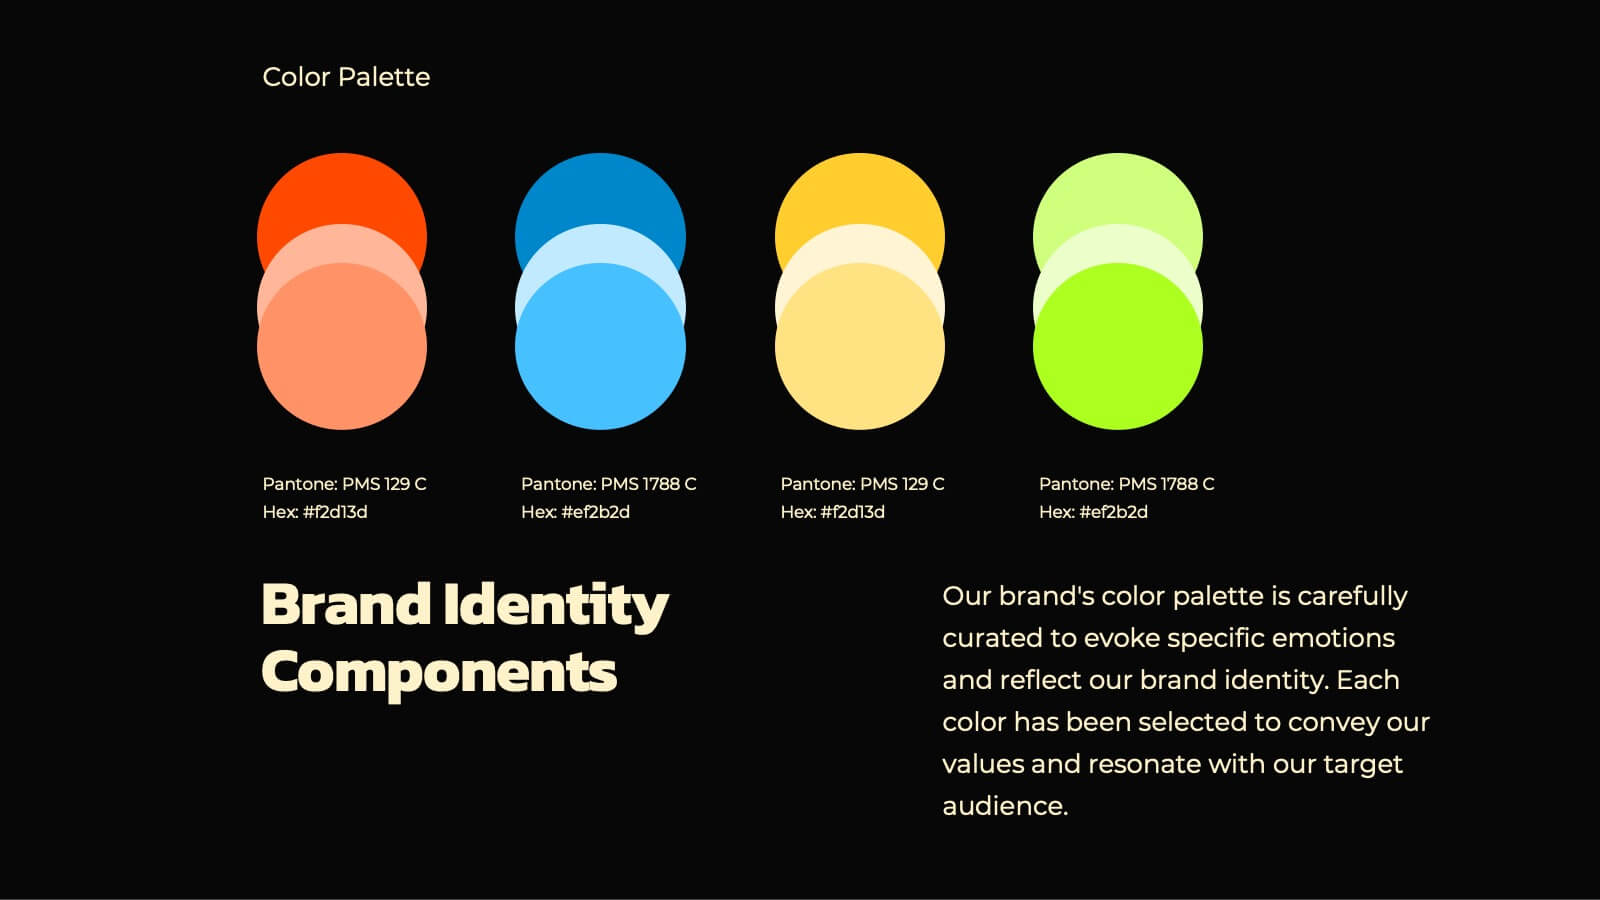
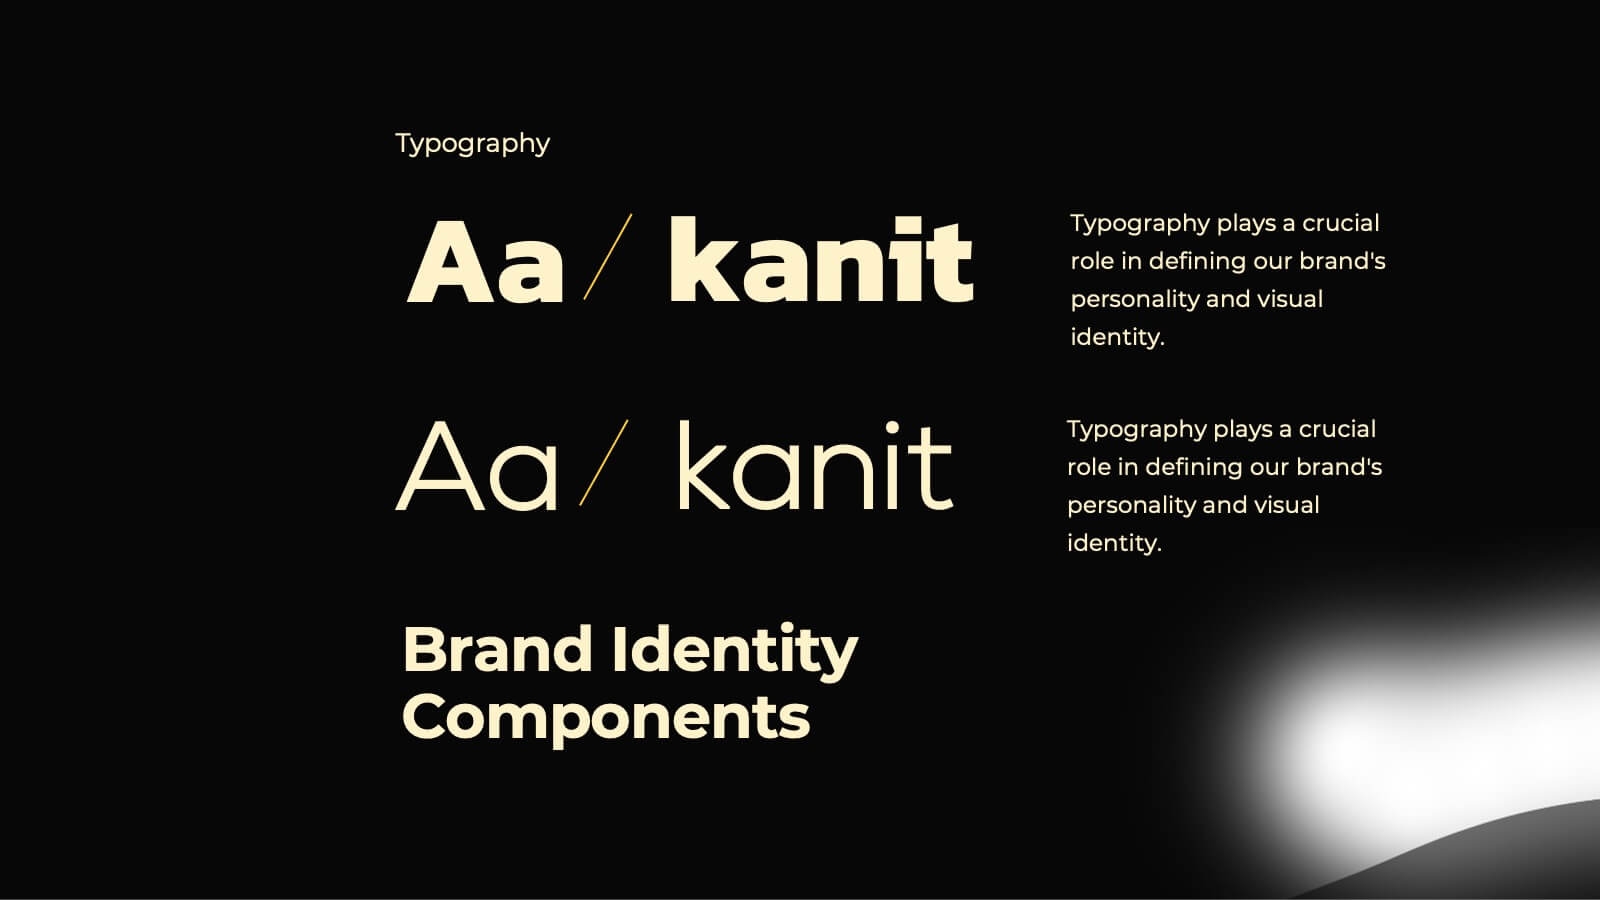
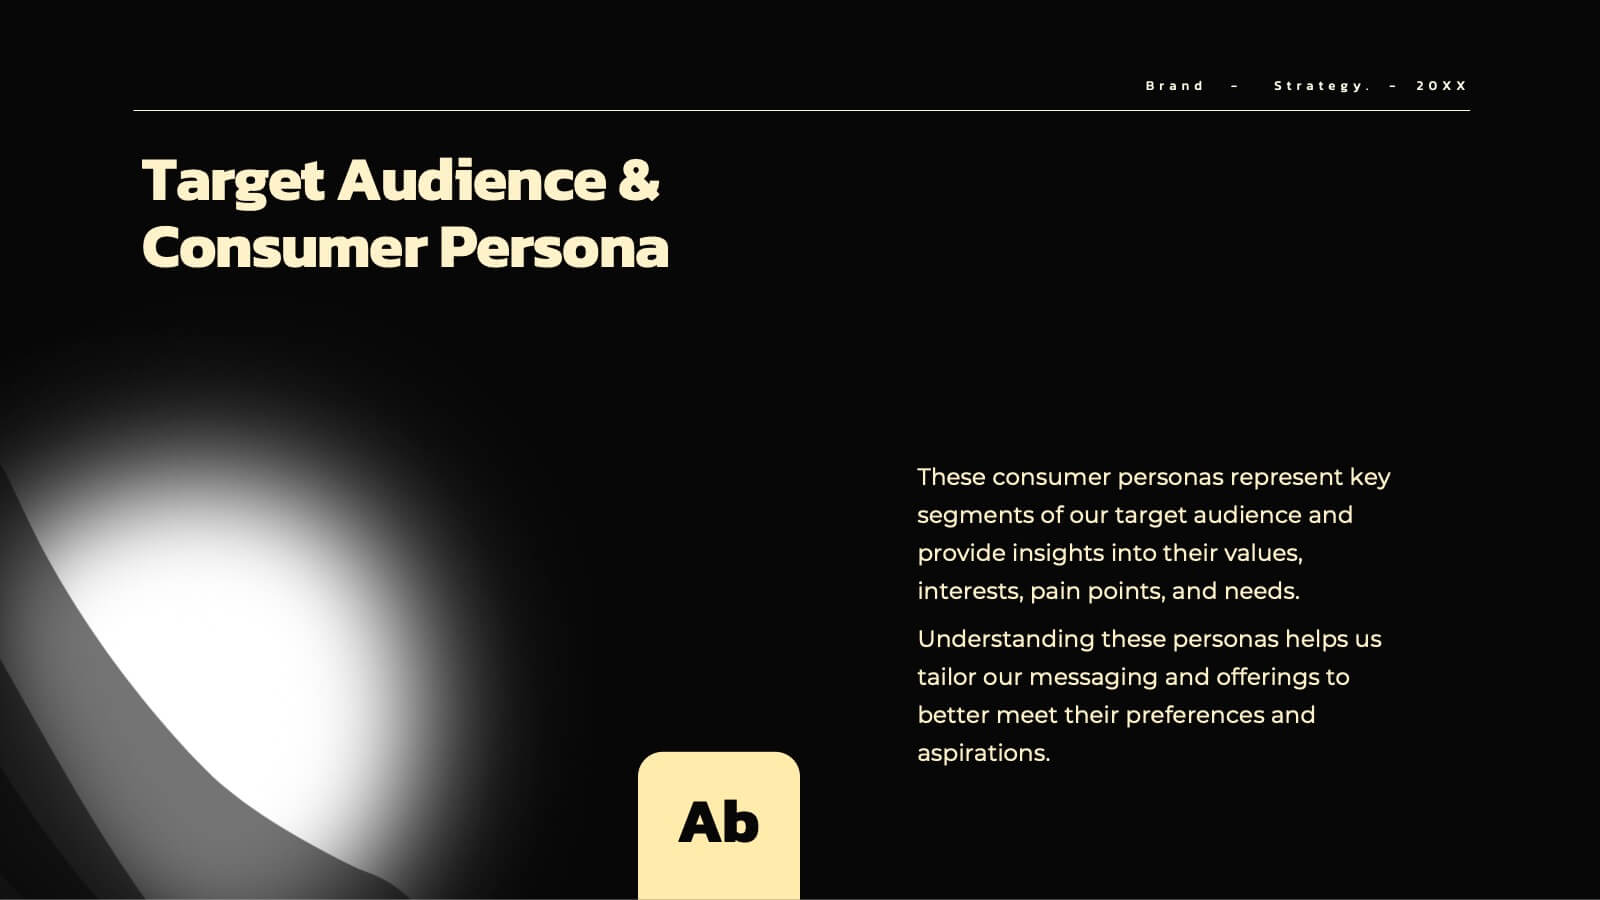
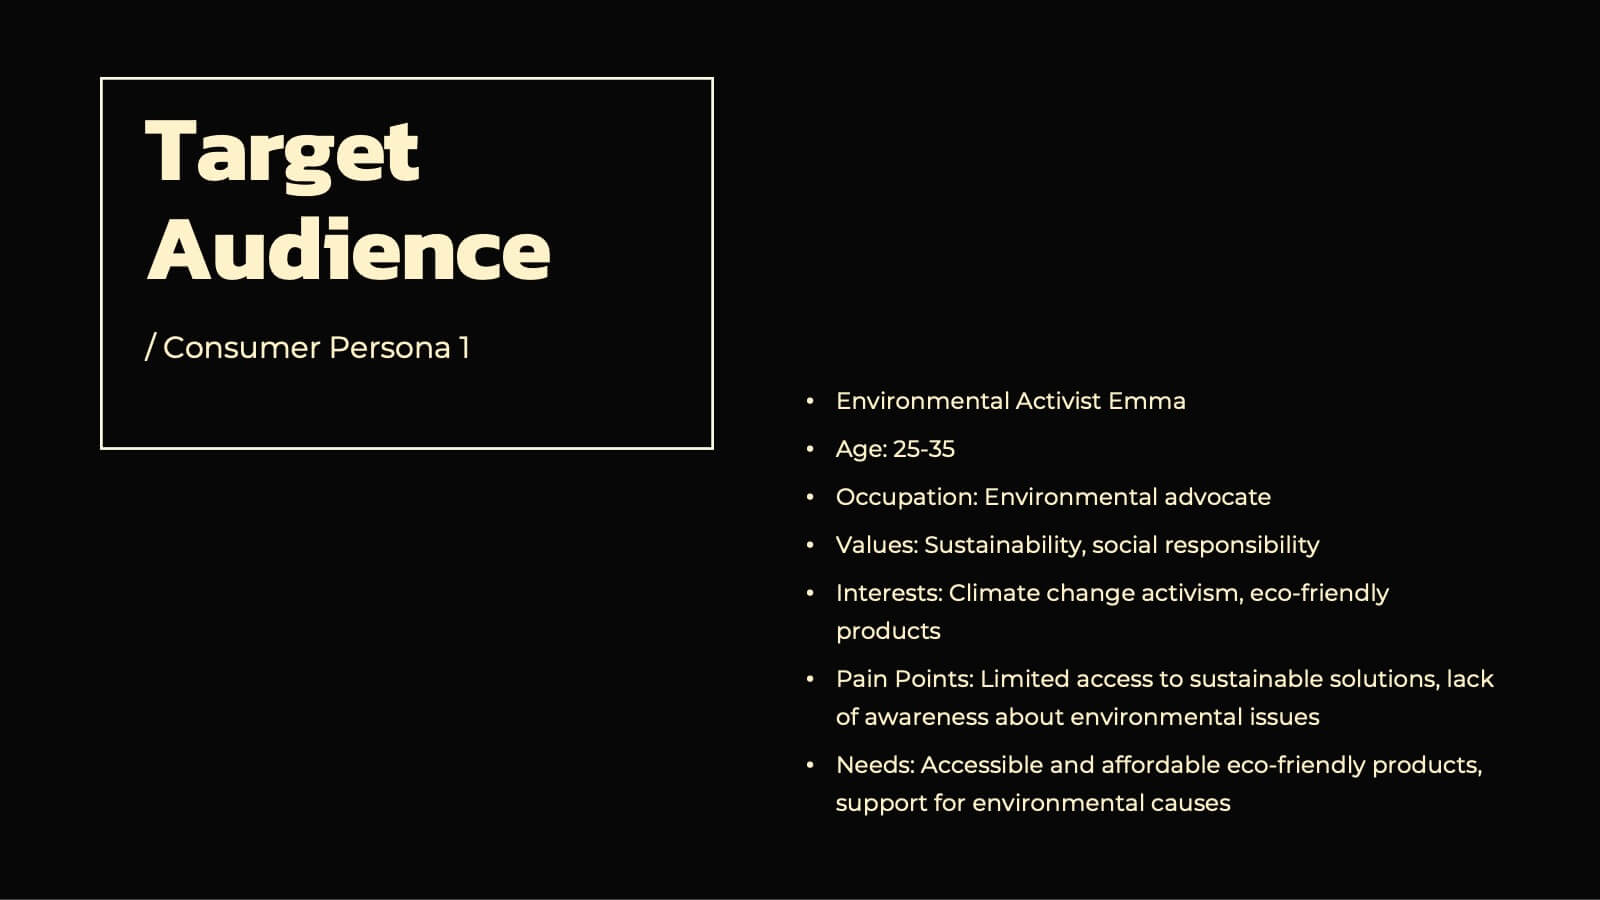
Aqua Brand Strategy Report Presentation
Make waves with this fresh, aqua-inspired presentation template, perfect for delivering a standout brand strategy report! Designed to help you showcase your brand's vision, market positioning, and strategic goals, it features a clean, modern layout that grabs attention. Compatible with PowerPoint, Keynote, and Google Slides for effortless customization.


4 slides
Mental Health Awareness Presentation
Bright visuals meet deep meaning in this engaging slide, designed to spotlight key facts and insights. This template helps present vital information on emotional well-being, stigma reduction, and support strategies with clarity and empathy. Fully editable and easy to use in PowerPoint, Keynote, and Google Slides for seamless presentation delivery.


5 slides
Health Care Infographics
Taking care of your health is an investment in your future self and can lead to a happier and more fulfilling life. These vertical health care infographics are visual representations of information related to health care. They can cover a wide range of topics, such as disease prevention, medical treatments, and patient care. These are designed to be easily understandable and engaging for a general audience. They use colorful graphics and illustrations to convey complex information in an eye-catching manner. These also include graphs, diagrams text boxes, and other design elements to highlight key information.


5 slides
Tiered Strategy Framework Pyramid Presentation
Break down your plan into clear, actionable steps with this Tiered Strategy Framework Pyramid presentation. Each arrow-shaped tier helps visualize hierarchical strategies, workflows, or growth levels. Use this layout to communicate priorities, initiatives, or milestones in a sleek and modern format. Fully editable in Canva, PowerPoint, or Google Slides.