


Features
- 5 Unique slides
- Fully editable and easy to edit in Microsoft Powerpoint, Keynote and Google Slides
- 16:9 widescreen layout
- Clean and professional designs
- Export to JPG, PDF or send by email


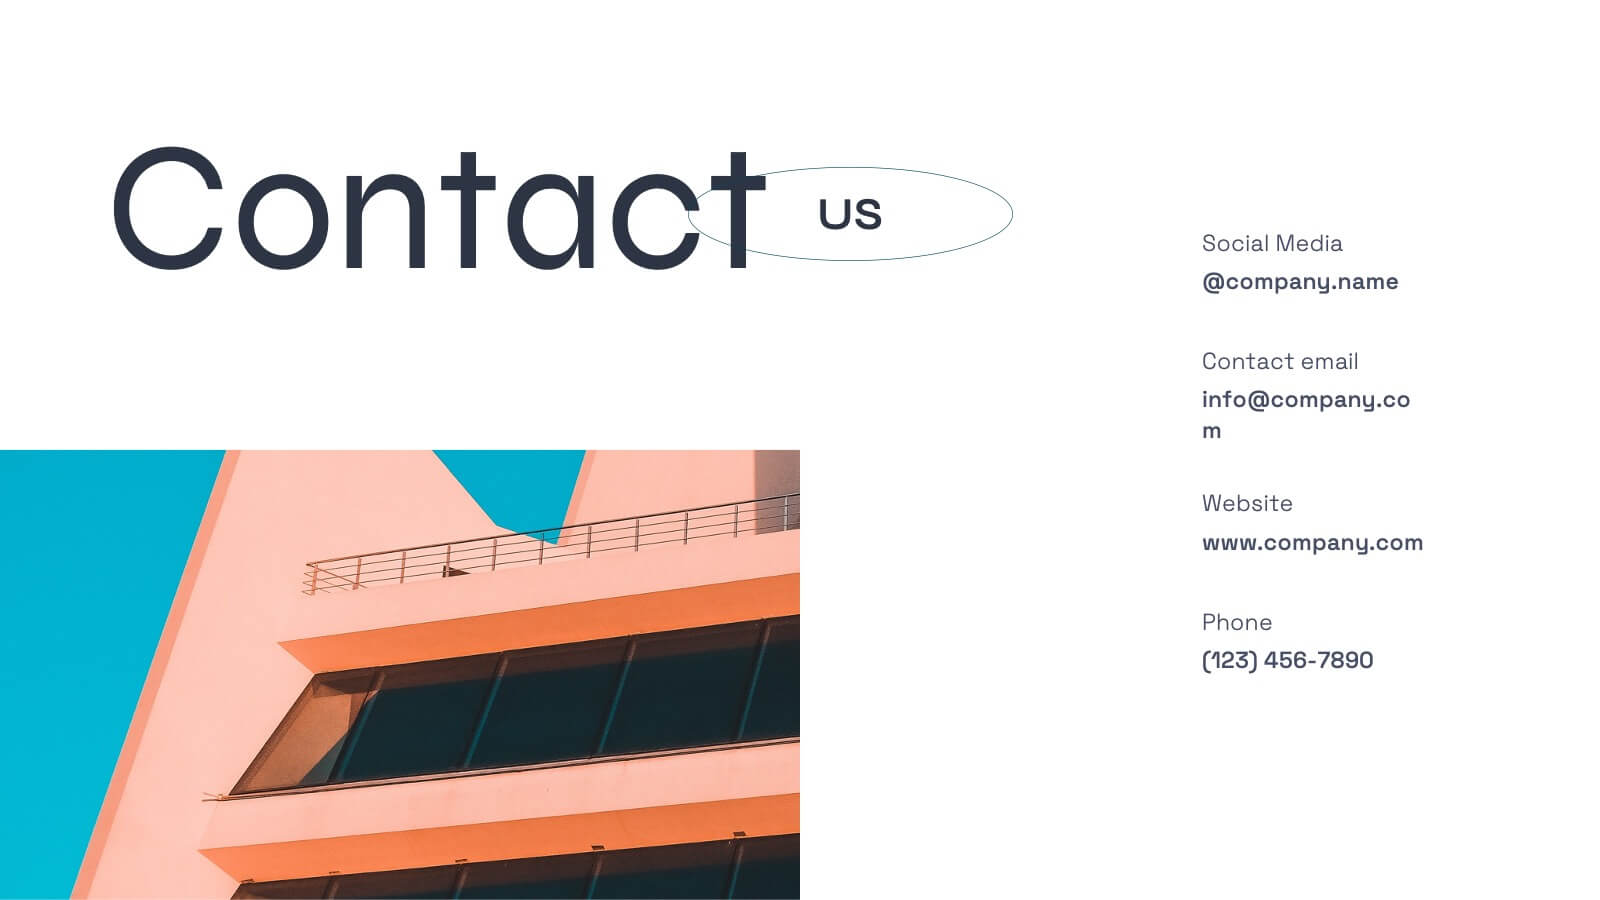
Do you have any questions?
Recommend


6 slides
Ideas Connection Venn Presentation Design
Present interconnected ideas with creativity and impact using the Ideas Connection Venn Presentation Design. This colorful, lightbulb-themed 5-section layout helps you visualize related concepts or stages, ideal for brainstorming, innovation mapping, or content planning. Each segment includes icons, titles, and descriptions to showcase your thoughts clearly. Fully customizable in PowerPoint, Keynote, and Google Slides.


4 slides
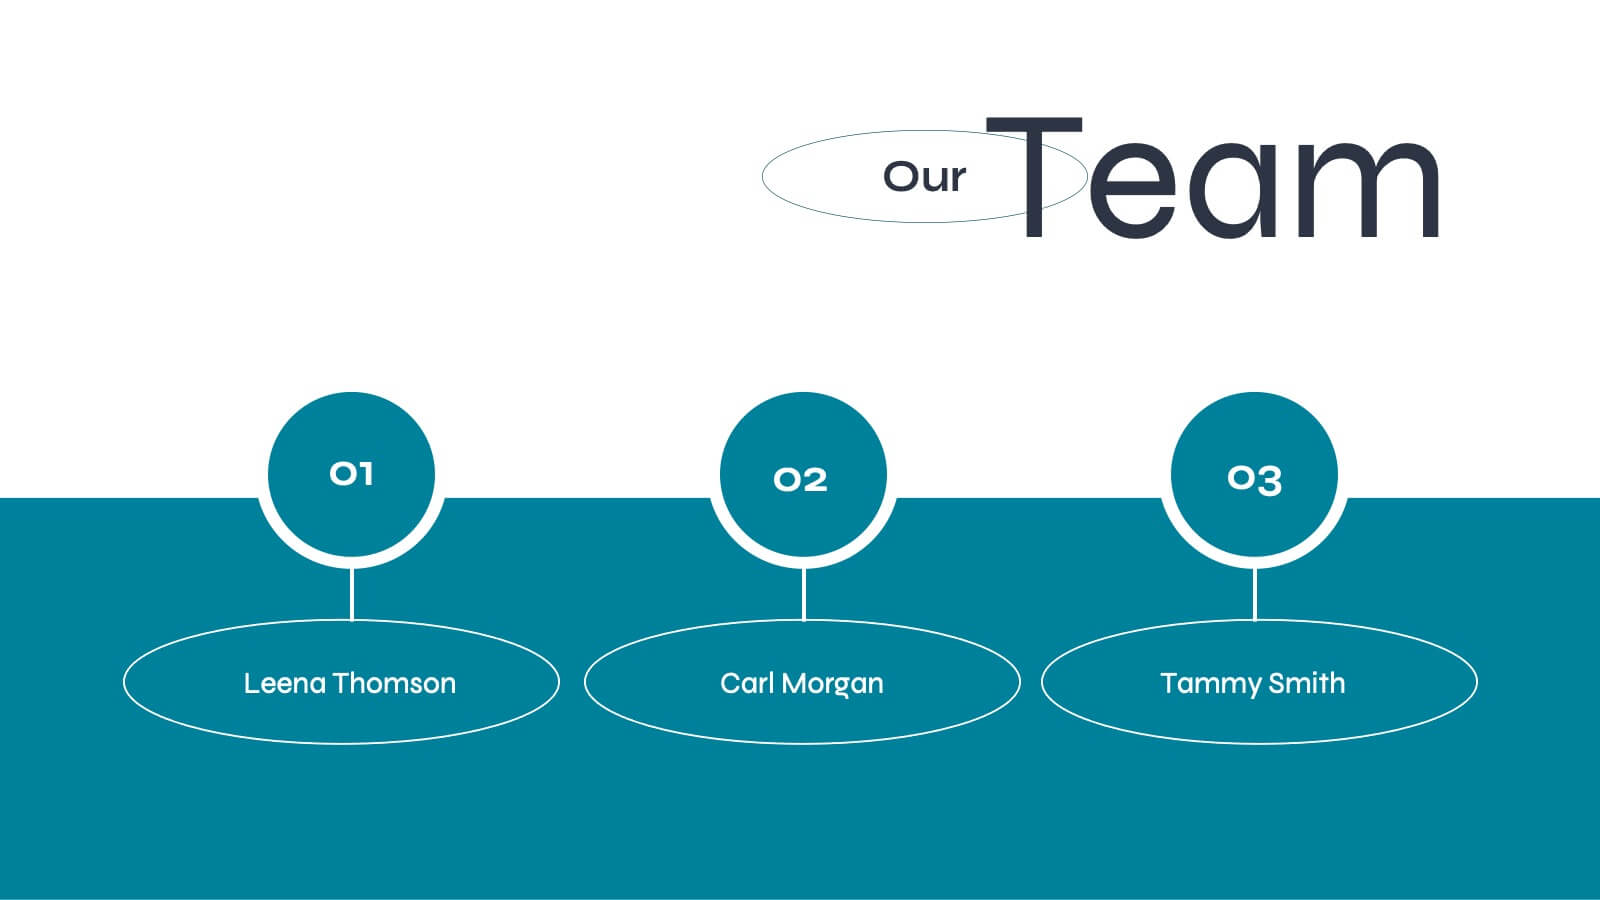
Meet the Business Team Presentation
Ignite curiosity from the start with a clean, modern layout designed to introduce your team with clarity and confidence. This presentation highlights key roles, expertise, and contributions, helping audiences quickly understand who drives the work forward. Fully editable and easy to customize in PowerPoint, Keynote, and Google Slides.


7 slides
Editable List Slide Presentation
Organize your ideas with style and simplicity using this clean, structured layout designed for clarity and impact. Ideal for summarizing key points, checklists, or action plans, it keeps your content professional and easy to follow. Fully customizable and compatible with PowerPoint, Keynote, and Google Slides for seamless presentation design.


4 slides
Watercolor Style Infographic Presentation
Bring an artistic flair to your data storytelling with this Watercolor Style Infographic Presentation. Featuring elegant, hand-painted flower visuals labeled A–D, this template is perfect for showcasing ideas in a soft, organic, and creative way. Ideal for branding presentations, product highlights, or educational content. Compatible with PowerPoint, Keynote, and Google Slides. Fully customizable and easy to use.


4 slides
Business Cycle Diagram Overview Presentation
Illustrate your business processes with this modern cycle diagram template. Designed to showcase four interconnected stages, it’s ideal for visualizing workflows, project phases, or continuous improvement models. Fully editable in Canva, PowerPoint, and Google Slides, this template helps you present complex cycles with clarity and visual impact.
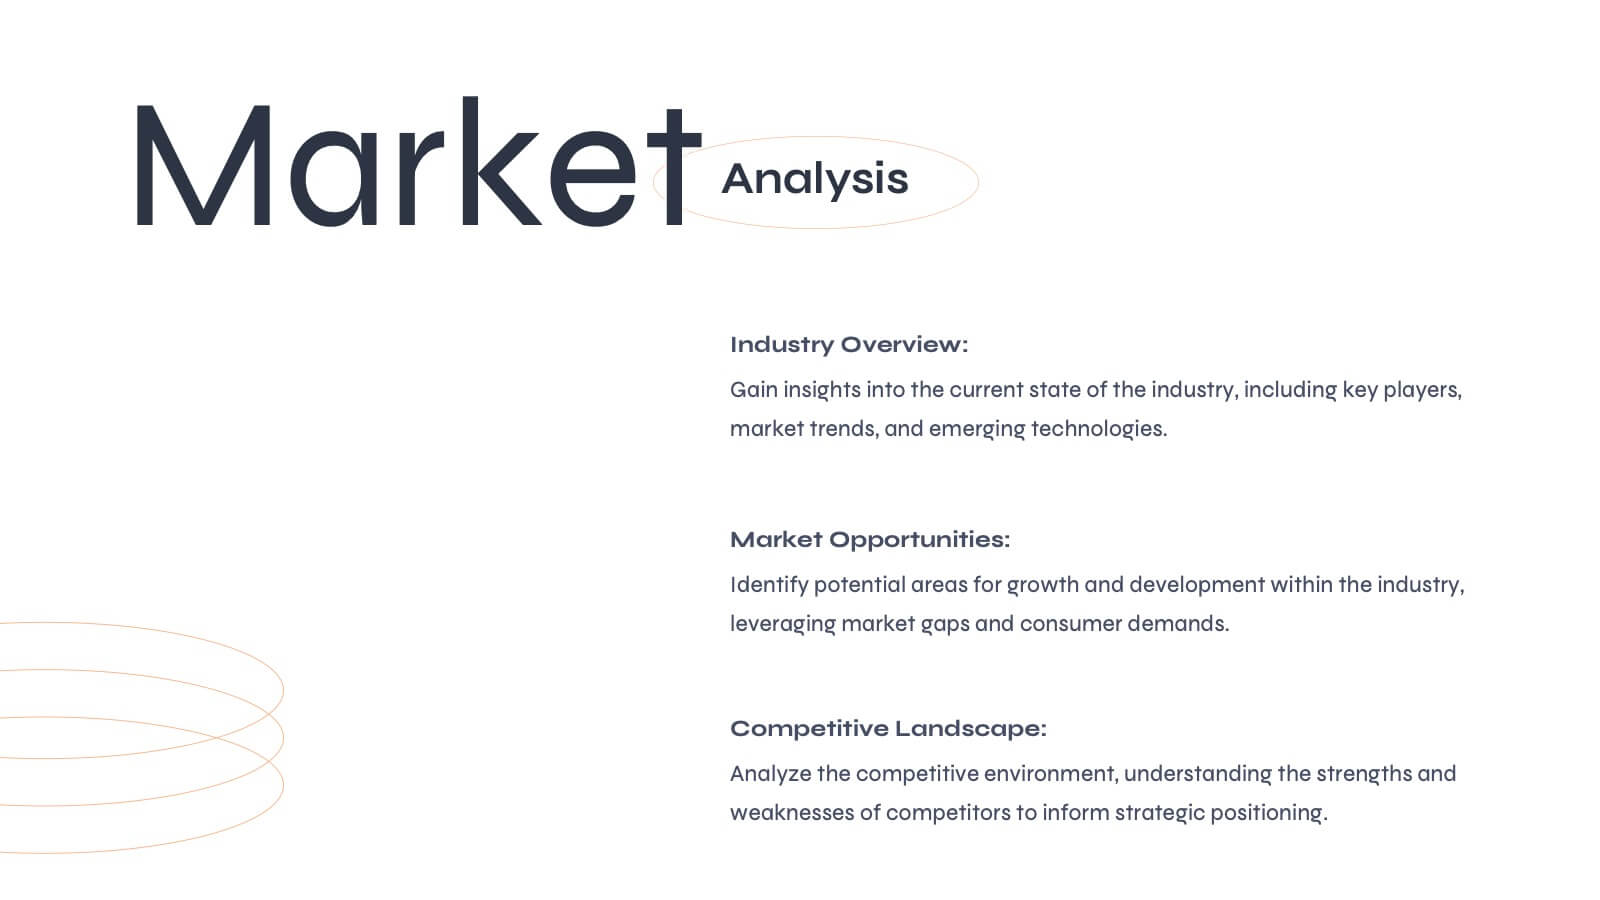
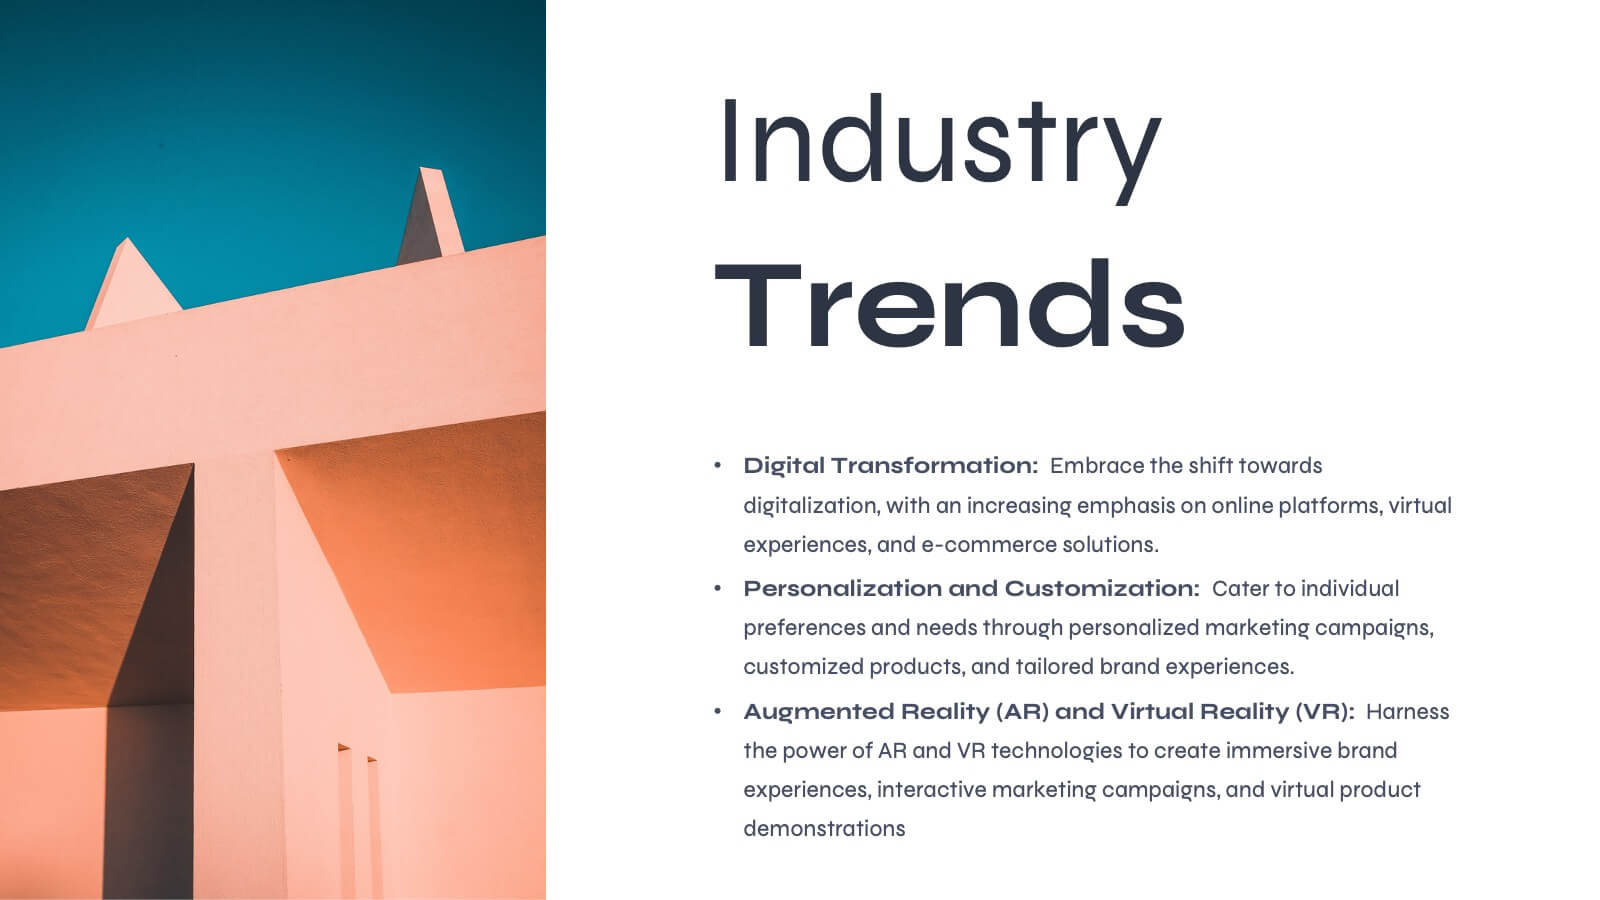
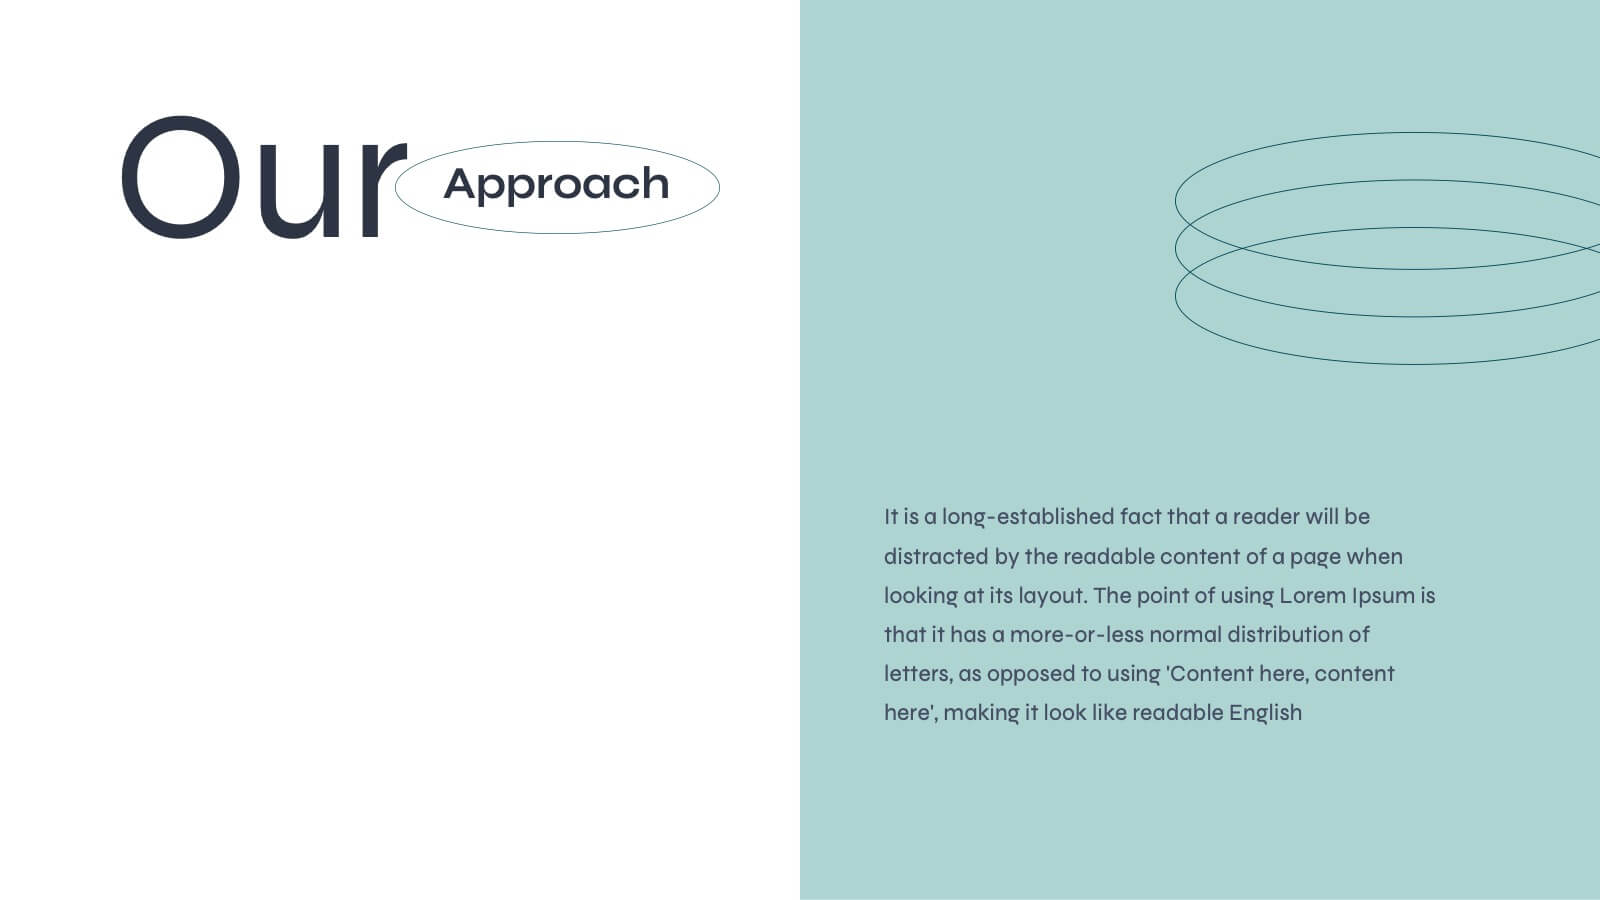
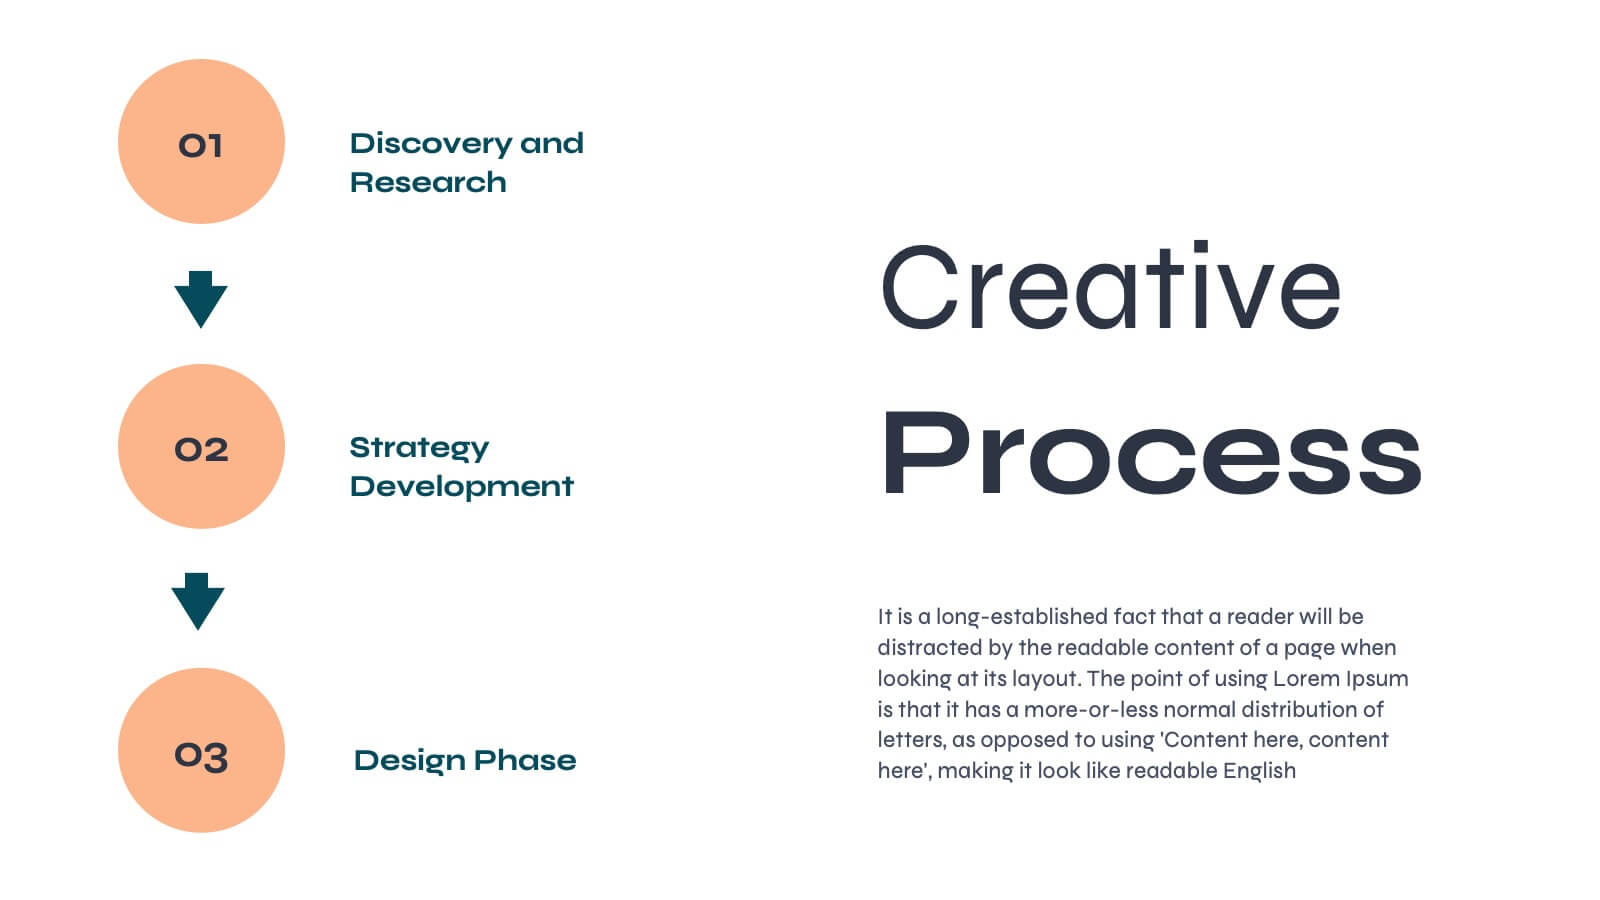
22 slides
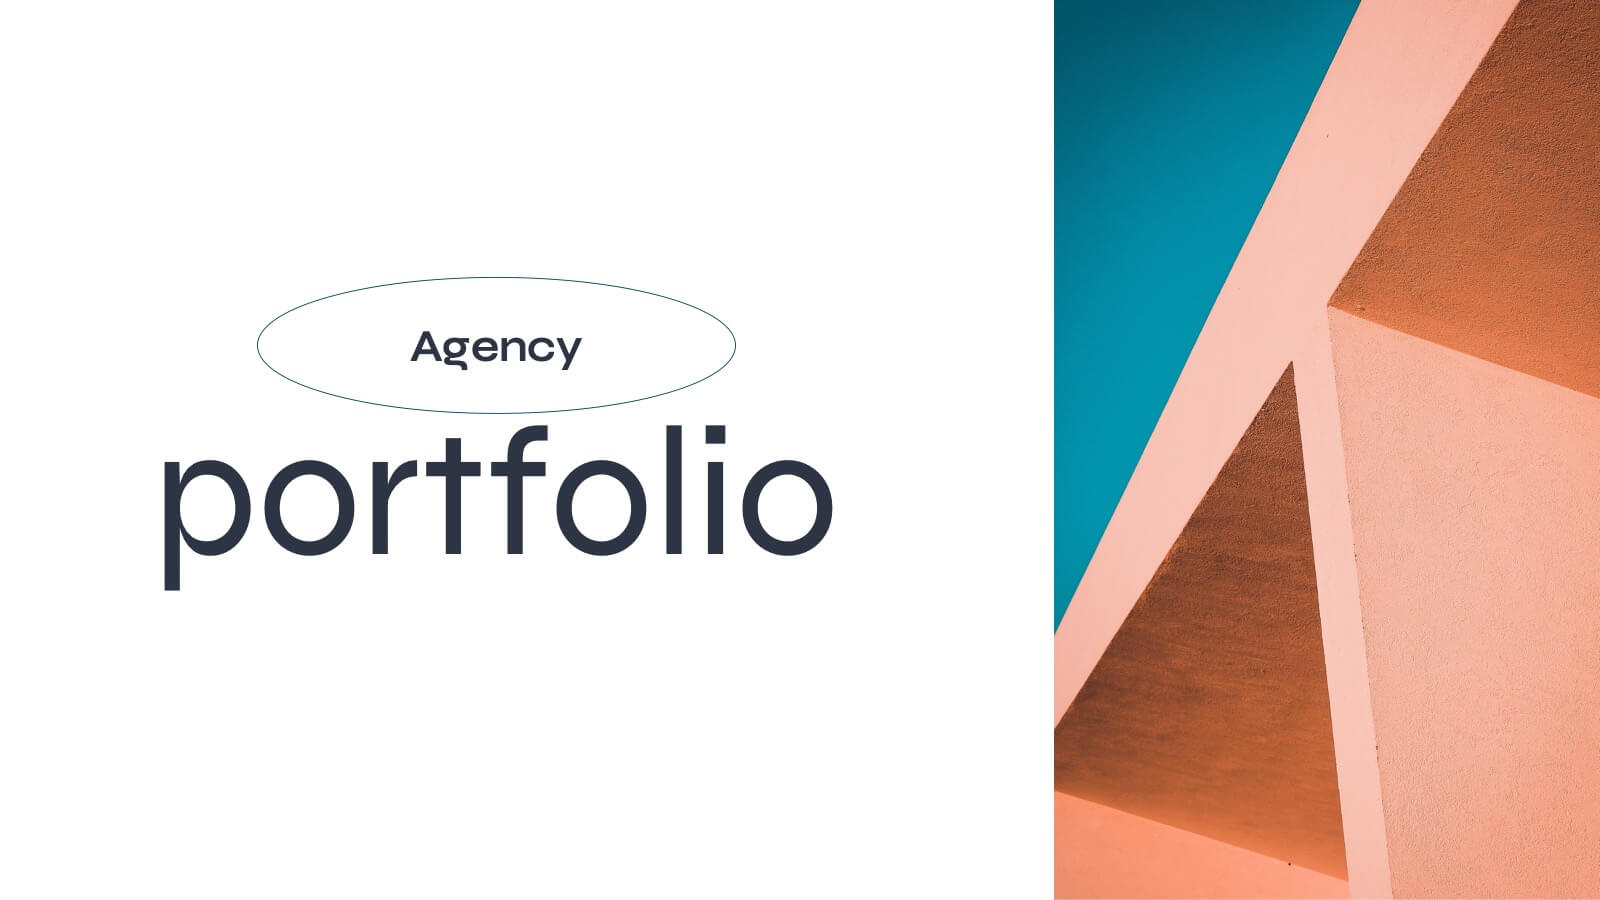
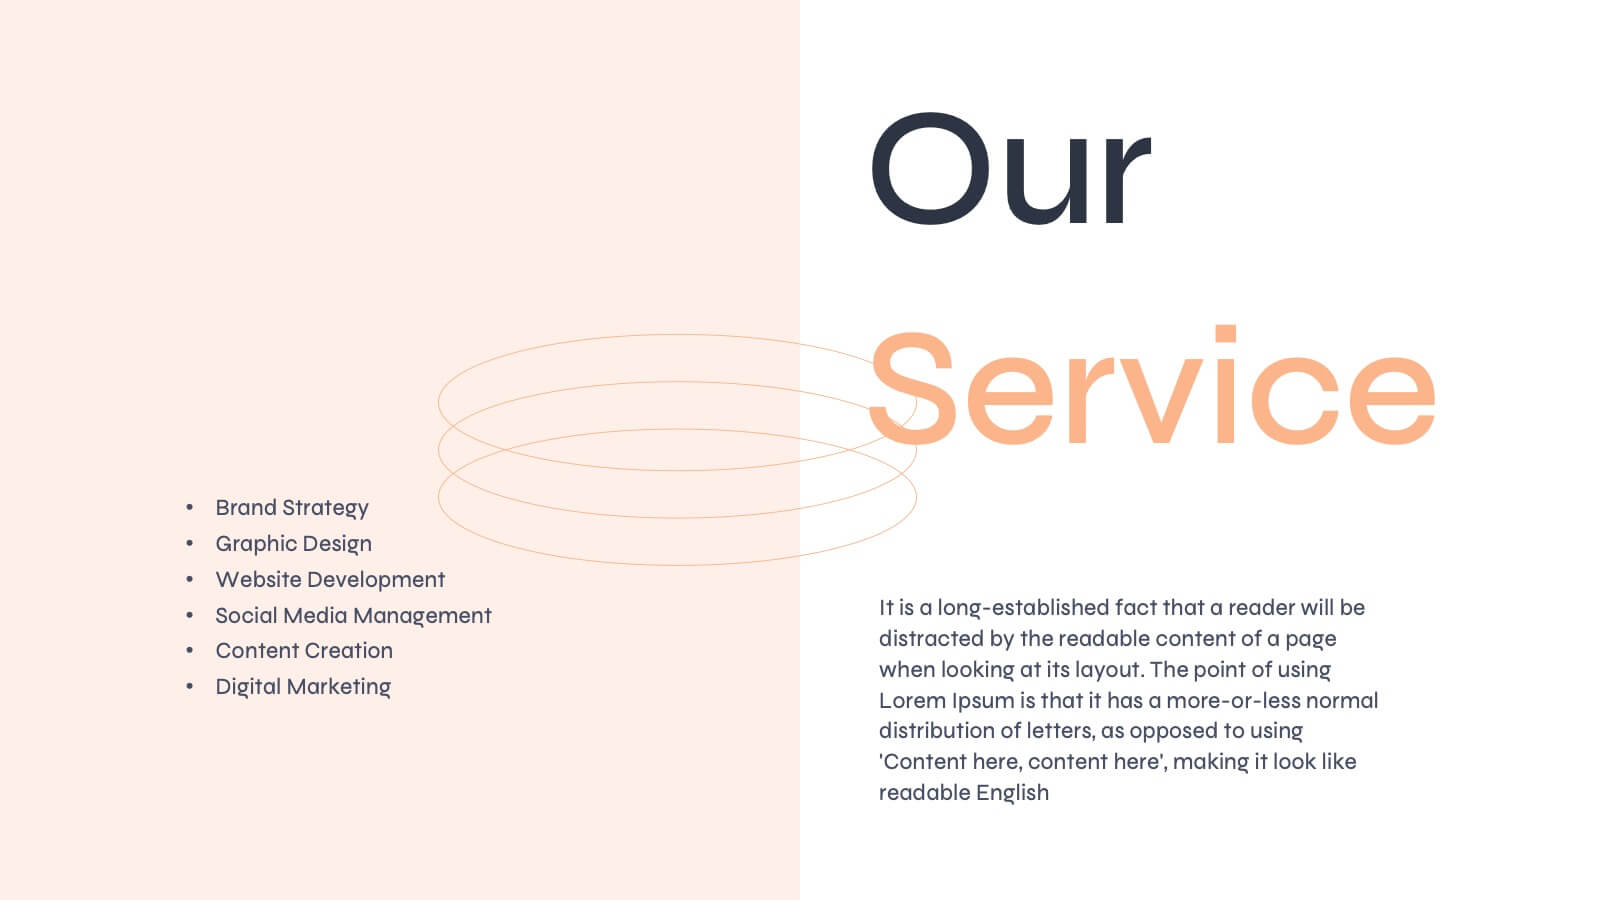
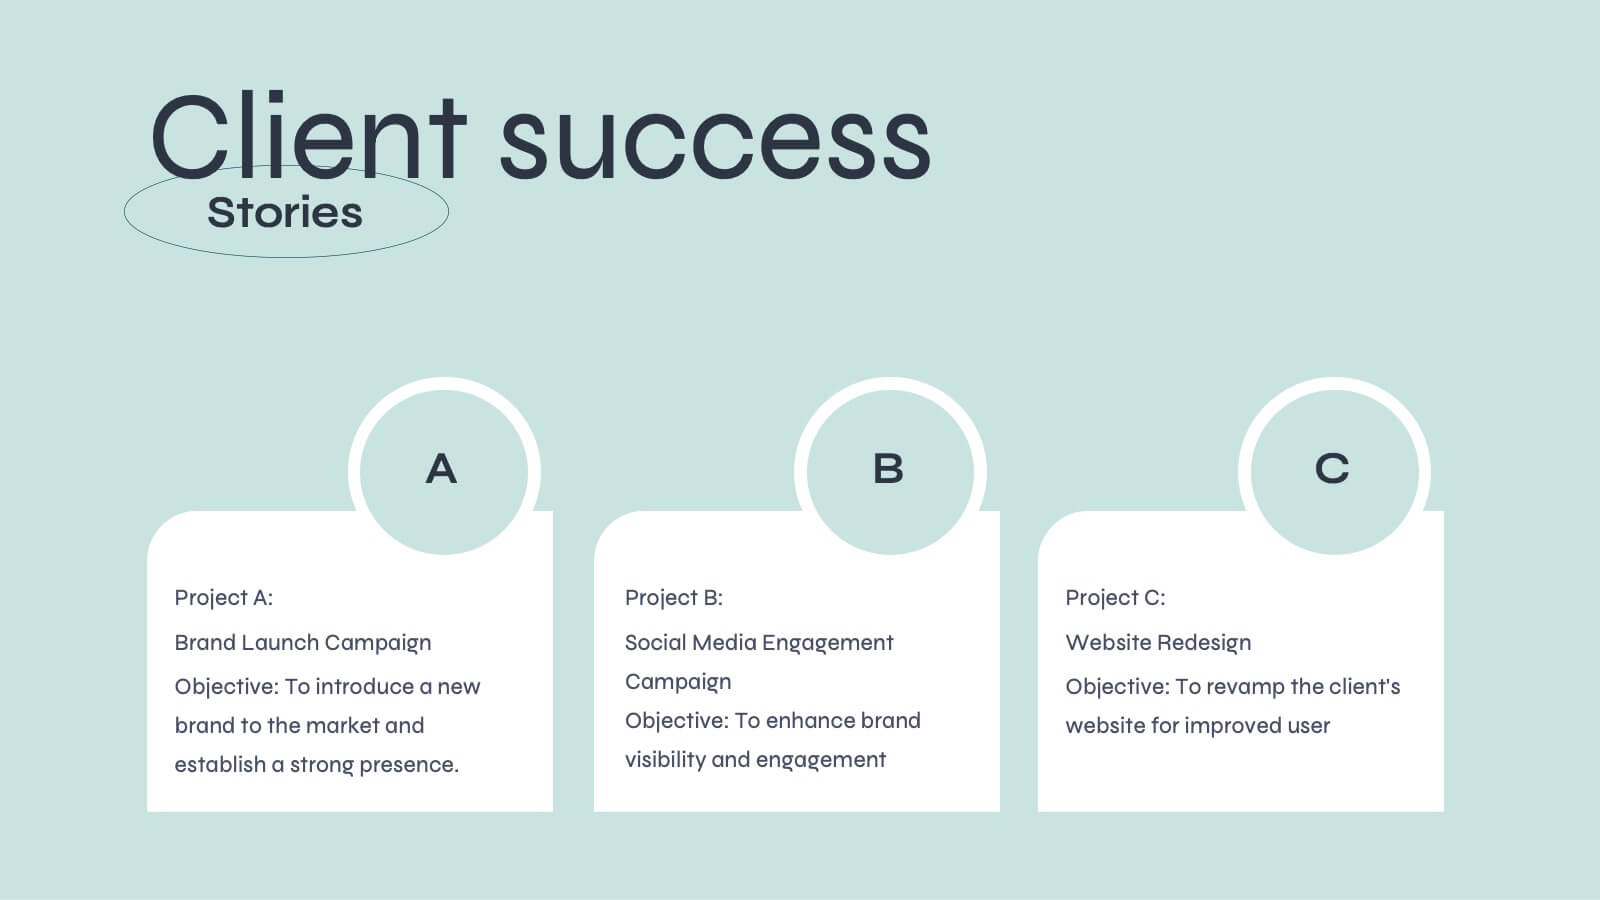
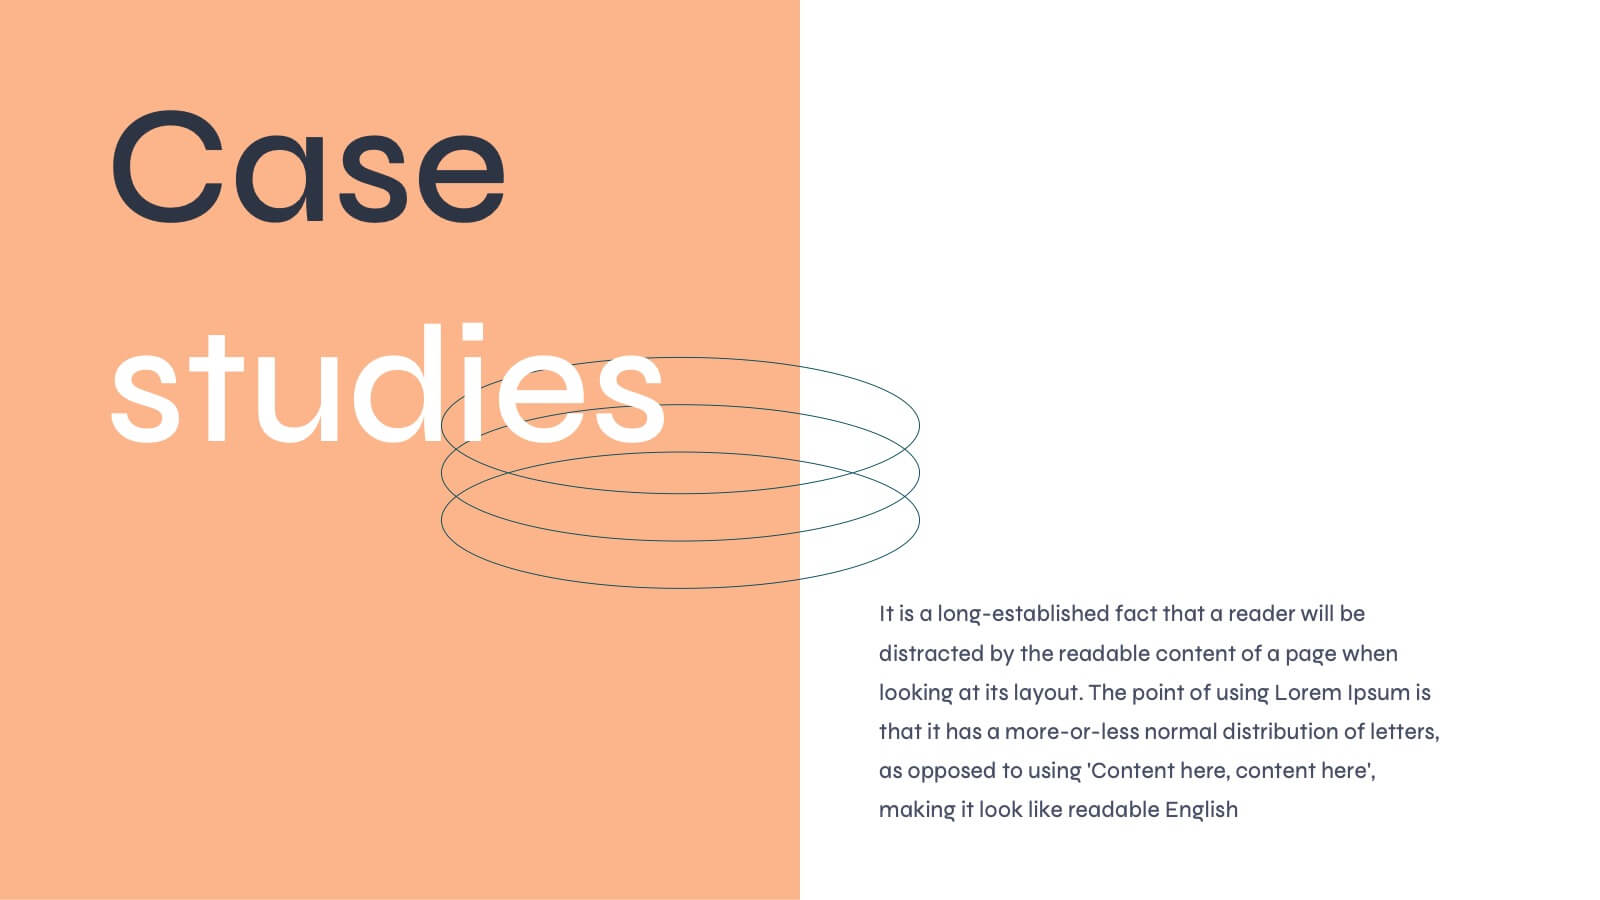
Aurora Agency Portfolio Presentation
Showcase your agency's strengths with this polished, modern presentation template. Perfect for presenting market analysis, client success stories, and creative processes, it features a clean and professional design. Highlight your team's expertise and strategic approach to impress potential clients. Compatible with PowerPoint, Keynote, and Google Slides, it ensures seamless presentations on any platform.


5 slides
Crypto Investment Trends and Insights Presentation
Stay ahead of the digital asset curve with the Crypto Investment Trends and Insights presentation template. This slide features a visually compelling mining cart illustration filled with cryptocurrency symbols, perfect for presenting market data, blockchain innovations, or digital asset strategies. Highlight three core insights using customizable text areas and icons. Ideal for crypto analysts, fintech professionals, and investment briefings. Fully editable in PowerPoint, Keynote, and Google Slides.


5 slides
5-Stage Growth Plan Presentation
Take your audience on a visual journey through each phase of success with this sleek step-by-step presentation. Designed to illustrate progress, milestones, and development stages clearly, it’s ideal for business planning or strategy discussions. Fully editable and compatible with PowerPoint, Keynote, and Google Slides for effortless customization.


5 slides
Online Learning Platforms and Strategies Presentation
Simplify complex educational strategies with this layered house-shaped diagram designed for digital learning topics. Each tier represents a strategic element of your e-learning platform, from planning to implementation. Featuring five clearly labeled sections with editable icons and text, this slide is ideal for showcasing course structures, platform features, or training rollouts. Fully customizable in PowerPoint, Keynote, and Google Slides.


6 slides
Annual Budget Forecast Template Presentation
Plan smarter and present your financial goals with precision using this clean, data-driven layout. Designed to visualize yearly spending, savings, and projections, this template helps teams clearly communicate performance and future targets. Perfect for finance reports or business reviews, it’s fully compatible with PowerPoint, Keynote, and Google Slides for effortless customization.


12 slides
Business Environmental Factors PESTEL Analysis Presentation
Visualize critical external influences on your business strategy with this Business Environmental Factors PESTEL Analysis slide. Designed for consultants, business analysts, and executive teams, this template uses a circular layout to highlight the six core PESTEL categories—Political, Economic, Sociocultural, Technological, Environmental, and Legal. Each segment is clearly marked with icons and labels, offering space to insert key insights or impact notes. Perfect for competitive analysis, board presentations, and long-term planning. Fully editable in PowerPoint, Keynote, and Google Slides.


4 slides
Investor Business Plan One-Pager Presentation
Present your startup vision with clarity using this Investor Business Plan One-Pager. Designed to outline key milestones, growth projections, and funding goals, it’s perfect for pitch decks and investor briefs. Visually dynamic and fully customizable, this one-slide format works seamlessly in PowerPoint, Keynote, and Google Slides—ideal for entrepreneurs and startups.


5 slides
Health Care Access and Equity Infographics
Health Care Access refers to the ability of individuals and communities to obtain medical services and receive appropriate care when needed. These infographic templates serve as an educational and advocacy tool, helping to raise awareness about the importance of equitable healthcare access and the need for addressing disparities. Whether used in healthcare organizations, educational settings, or public awareness campaigns, this template effectively communicates the urgency of achieving health equity and encourages individuals to take action towards a more equitable healthcare system. Compatible with Powerpoint, Keynote, and Google Notes.


15 slides
Business Infographic Presentation Template
A business is an organization engaged in commercial, industrial, or professional activities. A Business Infographic is a visual representation of information related to business topics like marketing, sales, finance, project management, customer service, and more. Using the graphics, charts, icons, and other design elements provided, create the best presentation. These infographics are usually used to help explain business concepts, show trends and results, and communicate information to employees, stakeholders, customers, and for students. Use this for presentations, reports and websites!


5 slides
Fitness Trainings Infographics
Fitness Training refers to structured physical activities or exercises designed to improve and maintain physical fitness, overall health, and athletic performance. Using these infographic templates, you can effectively educate your audience about different fitness training techniques, inspire them to adopt a healthy and active lifestyle, and provide them with practical tips and guidance for their fitness journey. These are designed to showcase various fitness training concepts, techniques, and tips. Whether you're a fitness instructor, personal trainer, or fitness enthusiast, this template is a valuable resource to educate and motivate your audience about fitness training.


7 slides
RAPID Matrix Infographic Presentation Template
RAPID stands for Recommend, Agree, Perform, Input and Decide. The RAPID Matrix is a popular tool used to determine project planning and decision-making responsibilities. It helps ensure that the right people are involved at the right time, with the right knowledge and skills. This template makes it easy for anyone to efficiently take notes. Use it to share information on your company, business plan or vision, or for a brainstorming session with your team. Take your presentation to the next level with this easy-to-personalize template and eye catching infographic with tips for using it.


26 slides
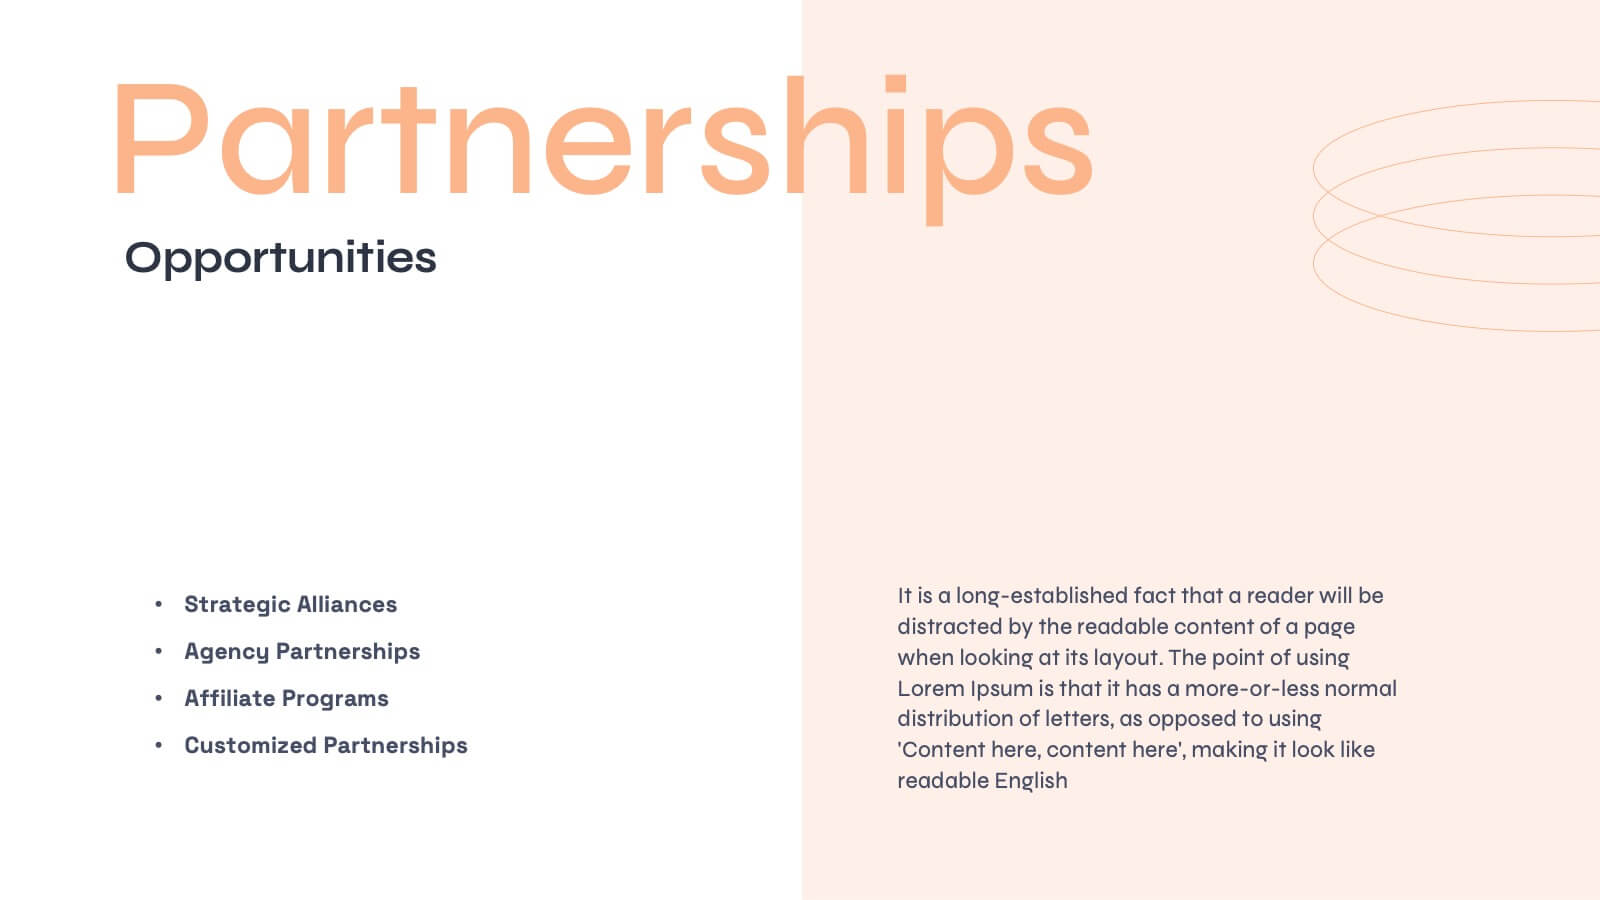
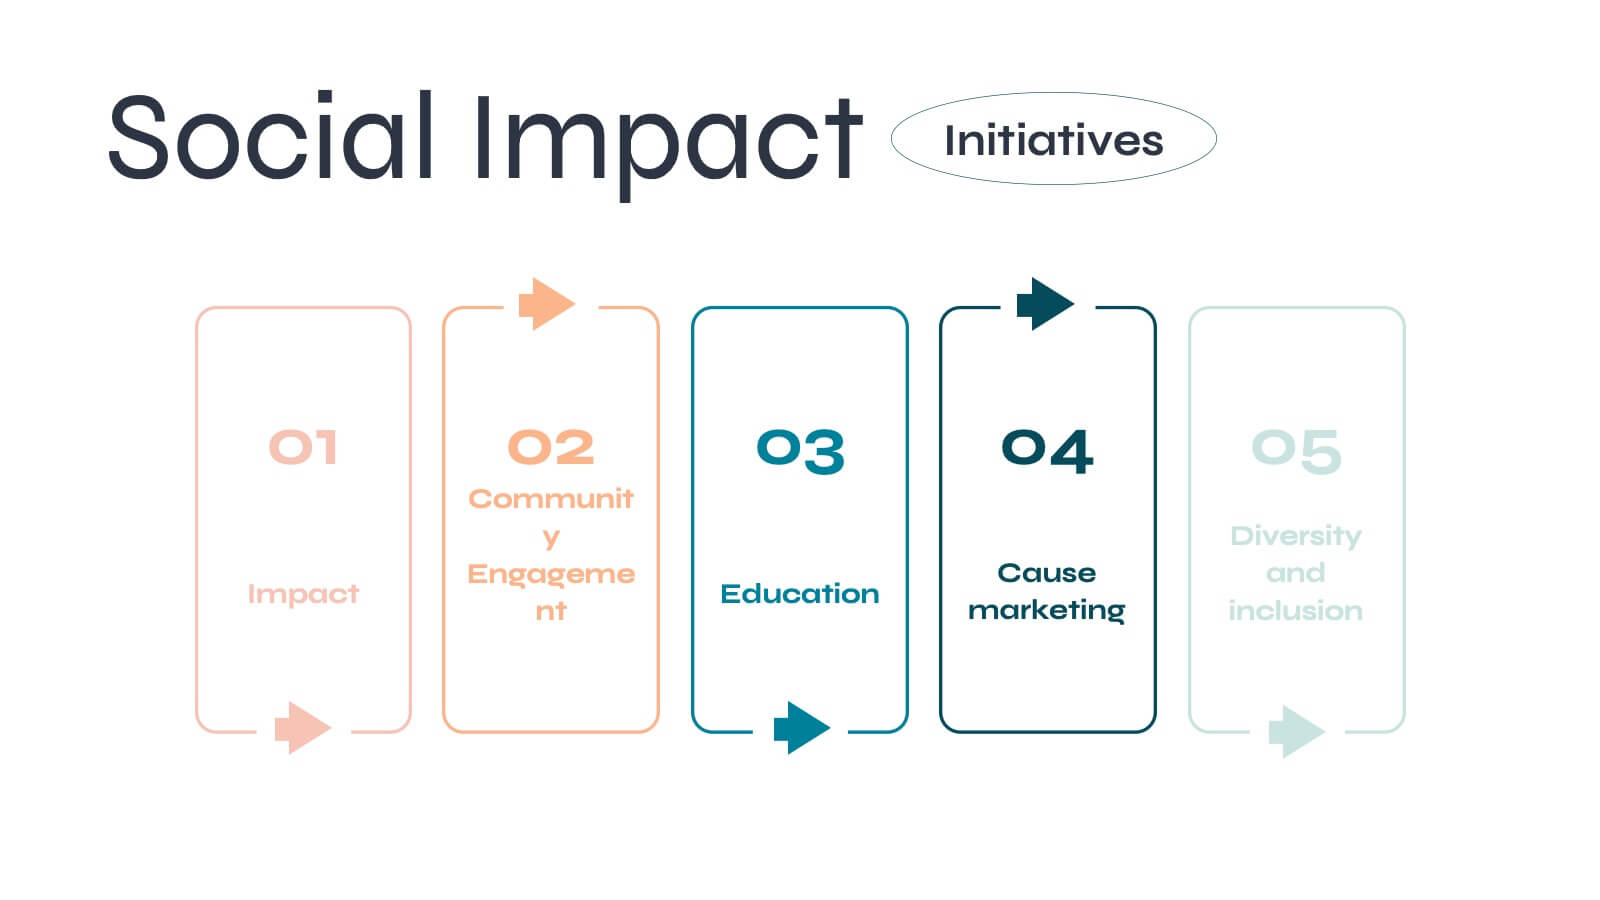
AIl for Social Good Presentation
Harness the power of technology for positive change with this inspiring presentation on AI for social good. Covering topics like ethical AI, humanitarian applications, sustainability, and global impact, this template helps showcase how artificial intelligence can drive meaningful progress. Fully customizable and compatible with PowerPoint, Keynote, and Google Slides for a seamless experience.