


Features
- 26 Unique slides
- Fully editable and easy to edit in Microsoft Powerpoint, Keynote and Google Slides
- 16:9 widescreen layout
- Clean and professional designs
- Export to JPG, PDF or send by email.


Do you have any questions?
Recommend


7 slides
Business Strategy with 7S Model
Clearly map out your organizational alignment using this Business Strategy with 7S Model template. Perfect for strategy consultants, leadership teams, and business educators, it illustrates the interconnectedness of structure, strategy, systems, style, staff, skills, and shared values. Fully customizable in PowerPoint, Keynote, and Google Slides.


6 slides
5-Level Risk Assessment Diagram Presentation
Simplify complex risk analysis with a clean, layered design that walks your audience through five key levels of impact and probability. Perfect for corporate reports, project management, or strategic planning, this presentation ensures clarity and engagement. Fully compatible with PowerPoint, Keynote, and Google Slides for easy customization.


5 slides
RAPID Decision-Making Roles Overview Presentation
Clarify accountability and streamline decisions with the RAPID Decision-Making Roles Overview Presentation. This visual layout breaks down the five essential roles—Recommend, Agree, Perform, Input, and Decide—into a clear quadrant diagram. Ideal for project teams, leadership alignment, or decision-making workshops. Fully editable in PowerPoint, Google Slides, Keynote, and Canva.


5 slides
Meeting Schedule and Agenda Layout Presentation
Plan, track, and communicate multi-day meetings with this Meeting Schedule and Agenda Layout presentation. Ideal for organizing conference sessions, workshops, or internal team agendas, this layout lets you present key topics by day and time. Clean, structured, and fully editable in Canva, PowerPoint, and Google Slides for easy customization.


5 slides
Company Vision and Operations Overview Presentation
Present your company’s mission and structure with this Company Vision and Operations Overview Presentation. Designed around a central eye graphic, it highlights four strategic pillars or core values. Ideal for executive summaries, leadership decks, or internal briefings. Fully editable in Canva, PowerPoint, or Google Slides.


6 slides
Executive Leadership Training Presentation
Enhance professional development with this executive leadership training template, designed with a step-by-step staircase layout symbolizing career progression. Perfect for leadership programs, corporate training, and skill-building workshops, it visually organizes six key topics for clarity. Fully editable in Canva, PowerPoint, or Google Slides, making customization effortless for any organization’s needs.


26 slides
Navigating Freelance and Flexible Work Presentation
Take control of your career with this insightful presentation on navigating freelance and flexible work. Covering key topics like client management, productivity strategies, income stability, and remote work tools, this template helps you present a clear roadmap to success. Fully customizable and compatible with PowerPoint, Keynote, and Google Slides for a seamless experience.


12 slides
5-Step Growth Strategy Presentation
Map out your success with this 5-step growth strategy template. Designed for business professionals, this layout simplifies complex strategies into clear, actionable steps, guiding teams through each stage of expansion. Ideal for strategic planning, goal setting, and performance tracking. Fully customizable and compatible with PowerPoint, Keynote, and Google Slides.


4 slides
Simple and Effective Steps Presentation
Guide your audience through a seamless workflow with this "Simple and Effective Steps" template. Designed for clarity and impact, this layout breaks down processes into four distinct steps, making it ideal for project planning, decision-making, and strategy execution. Fully customizable and compatible with PowerPoint, Keynote, and Google Slides.


23 slides
Orbit Marketing Strategy Plan Presentation
Elevate your marketing strategy presentations with this vibrant and dynamic template! Perfect for analyzing market trends, identifying target audiences, and outlining strategic objectives. Ideal for marketing professionals aiming to captivate their audience and drive results. Compatible with PowerPoint, Keynote, and Google Slides, this template ensures your strategy is clear, compelling, and effective.


6 slides
Modern Science Report Presentation
Bring your findings to life with a clean, dynamic layout designed to make scientific insights easy to follow. This presentation highlights key data, research points, and lab observations in a structured, visually engaging format that supports clarity and accuracy. Fully compatible with PowerPoint, Keynote, and Google Slides.


24 slides
Dreamveil UX Strategy Plan Presentation
Enhance your user experience strategy with this professionally designed UX Strategy Plan presentation. Covering essential topics such as user research, wireframes, prototyping, design principles, and usability guidelines, this deck offers a structured approach to refining your UX/UI processes. With a clean layout and engaging visuals, it’s perfect for teams, stakeholders, and clients looking to improve user interactions and design consistency. Fully customizable in popular formats like PowerPoint, Keynote, and Google Slides.
22 slides
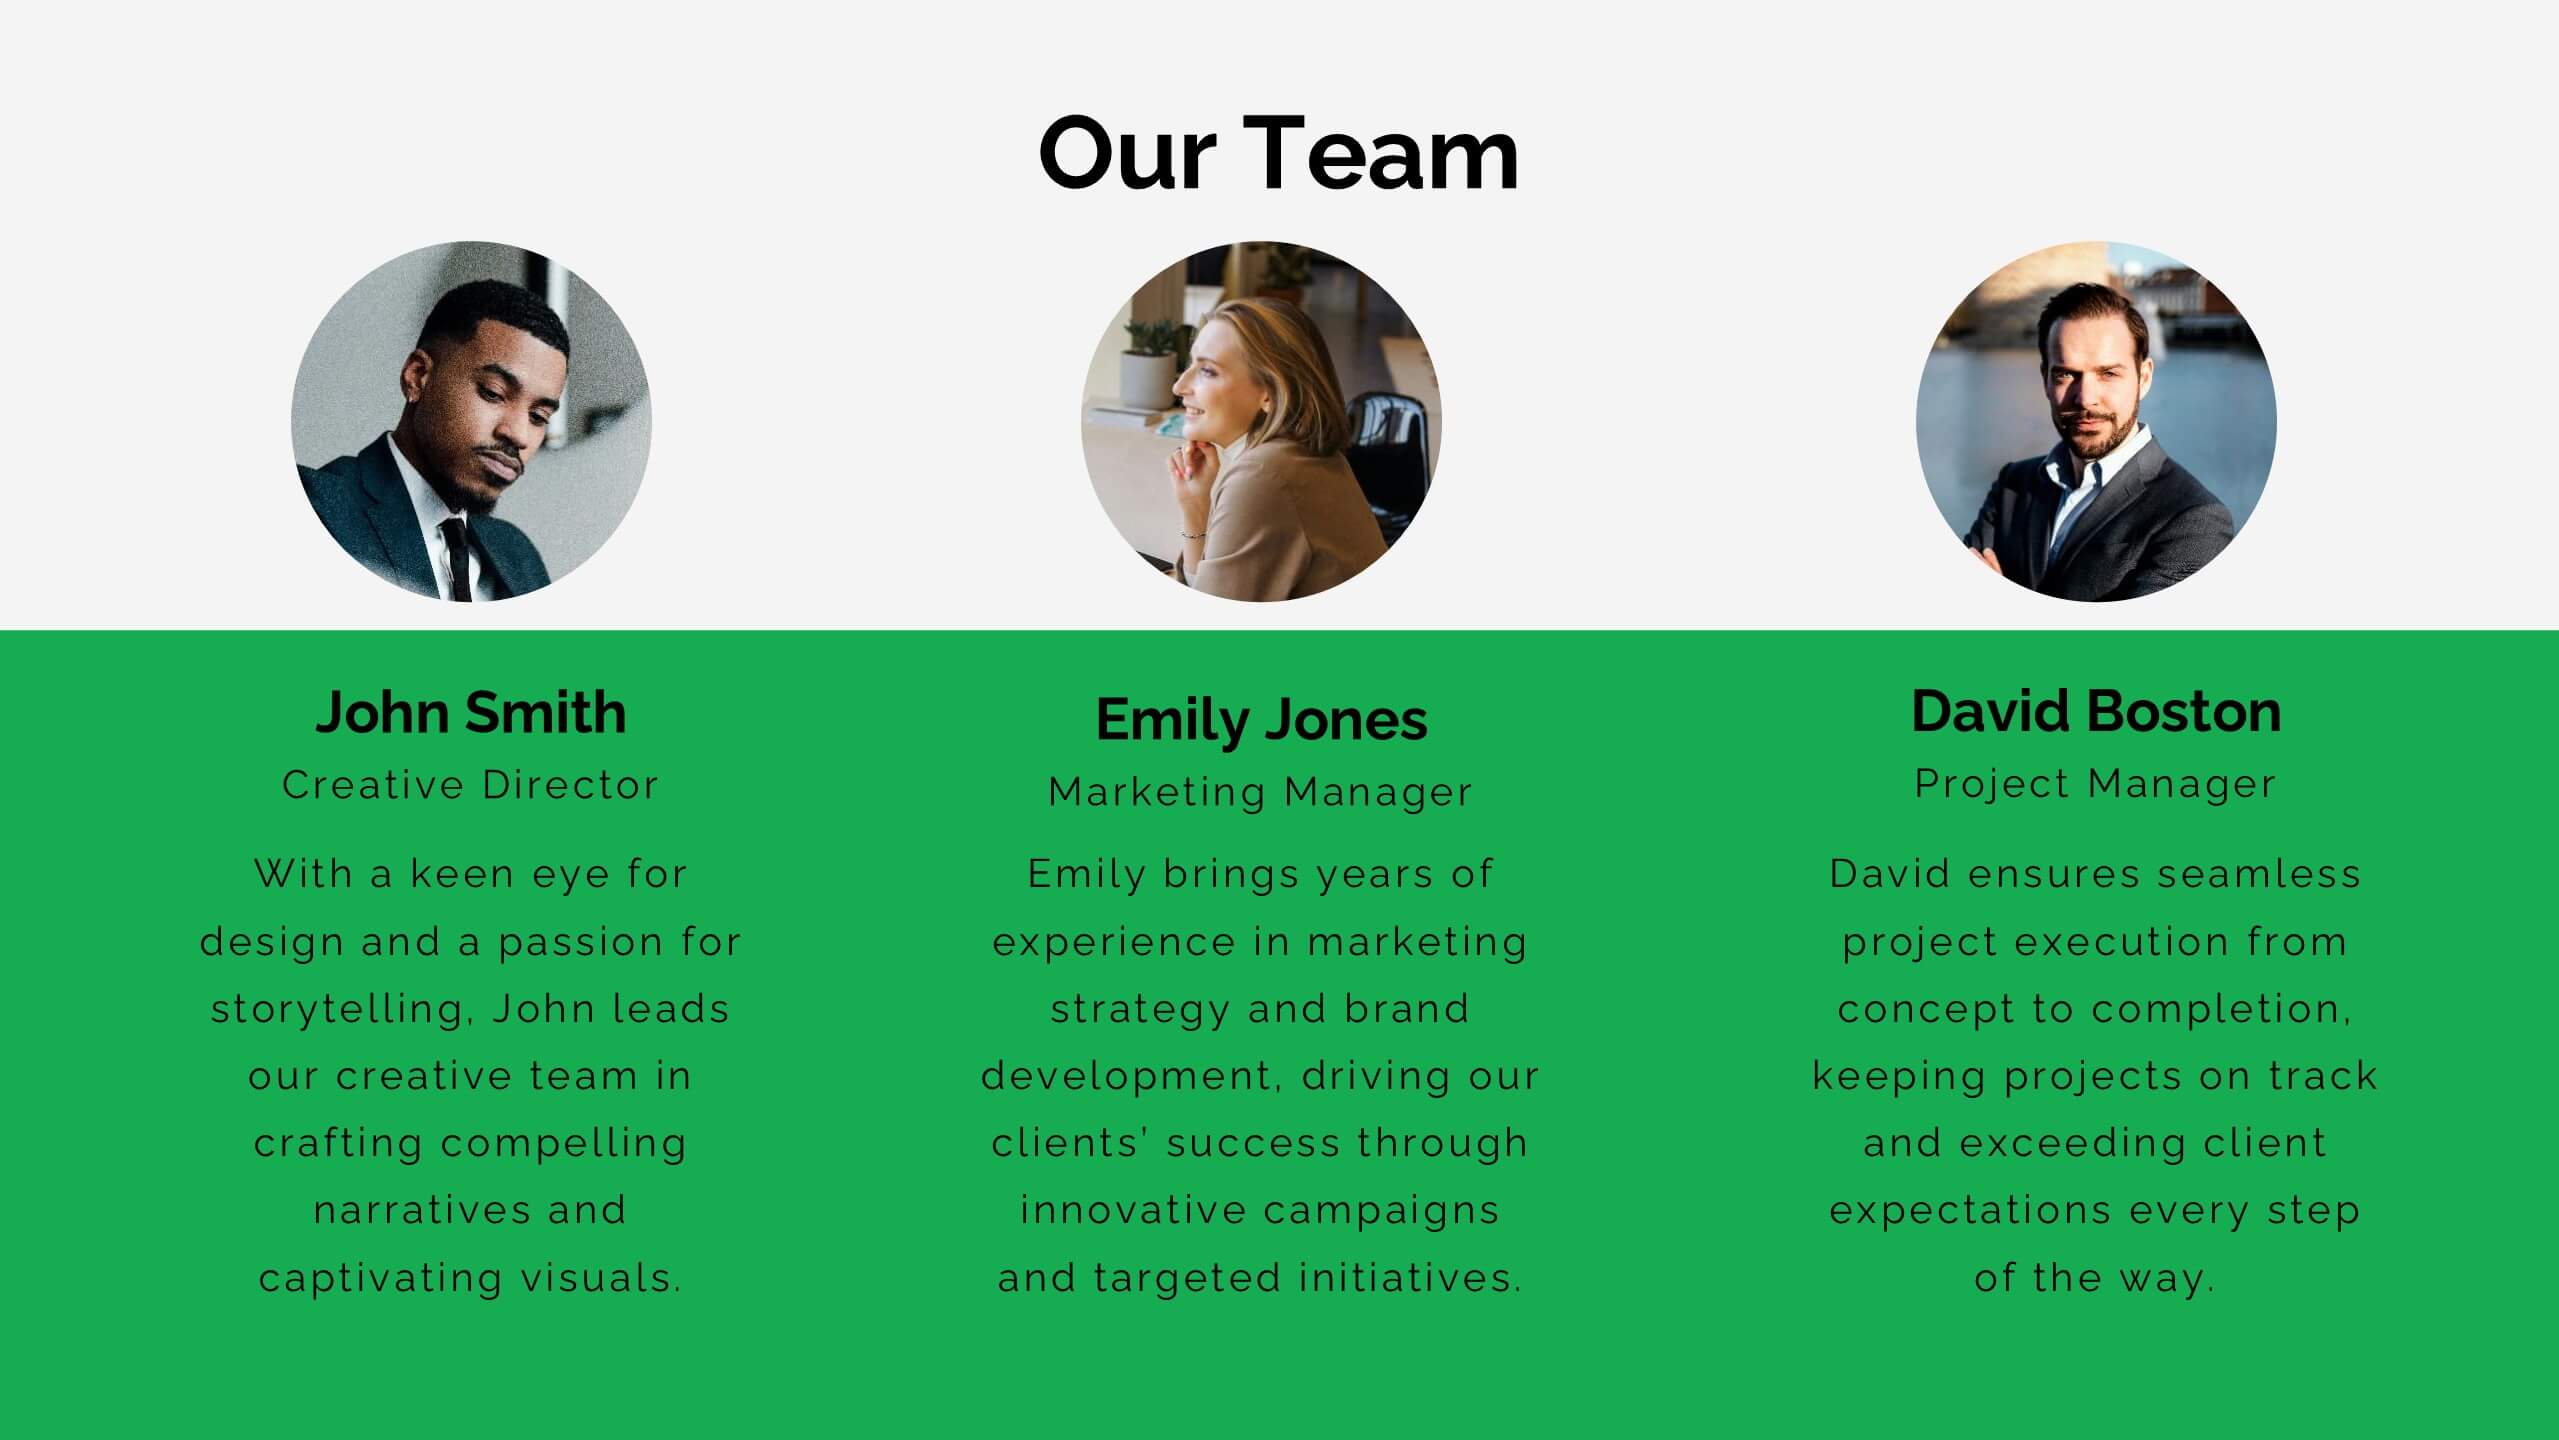
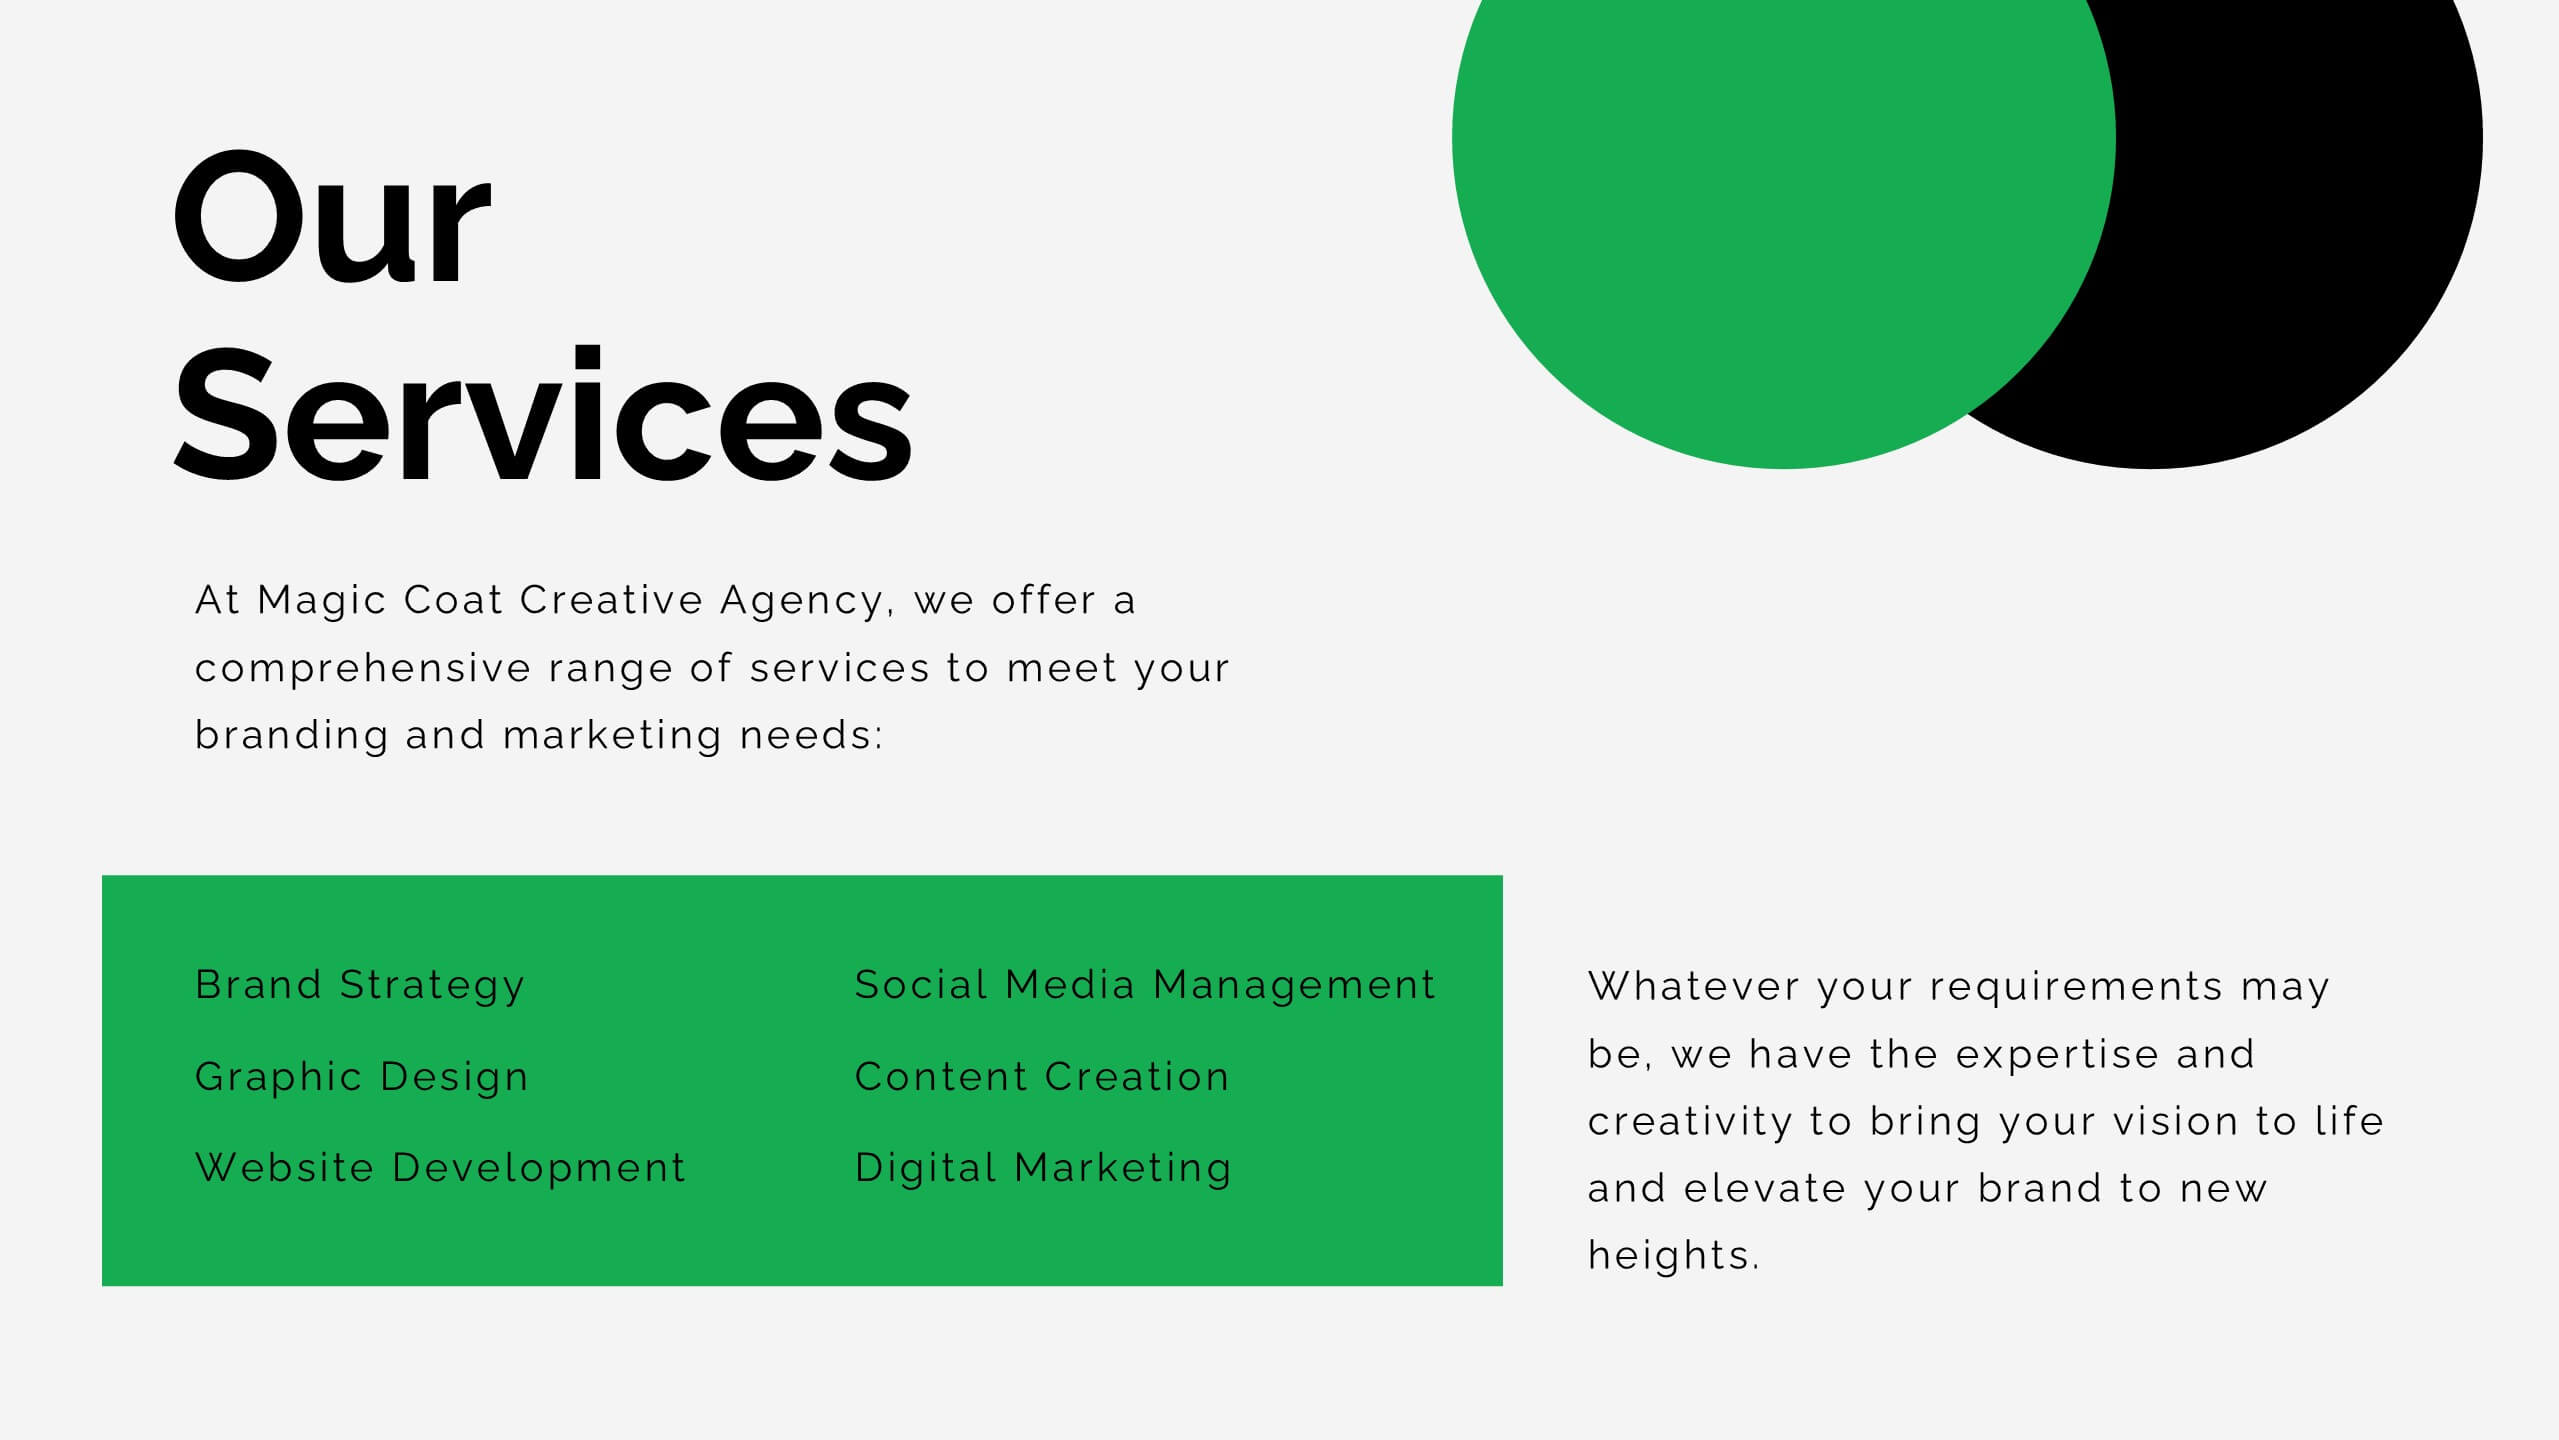
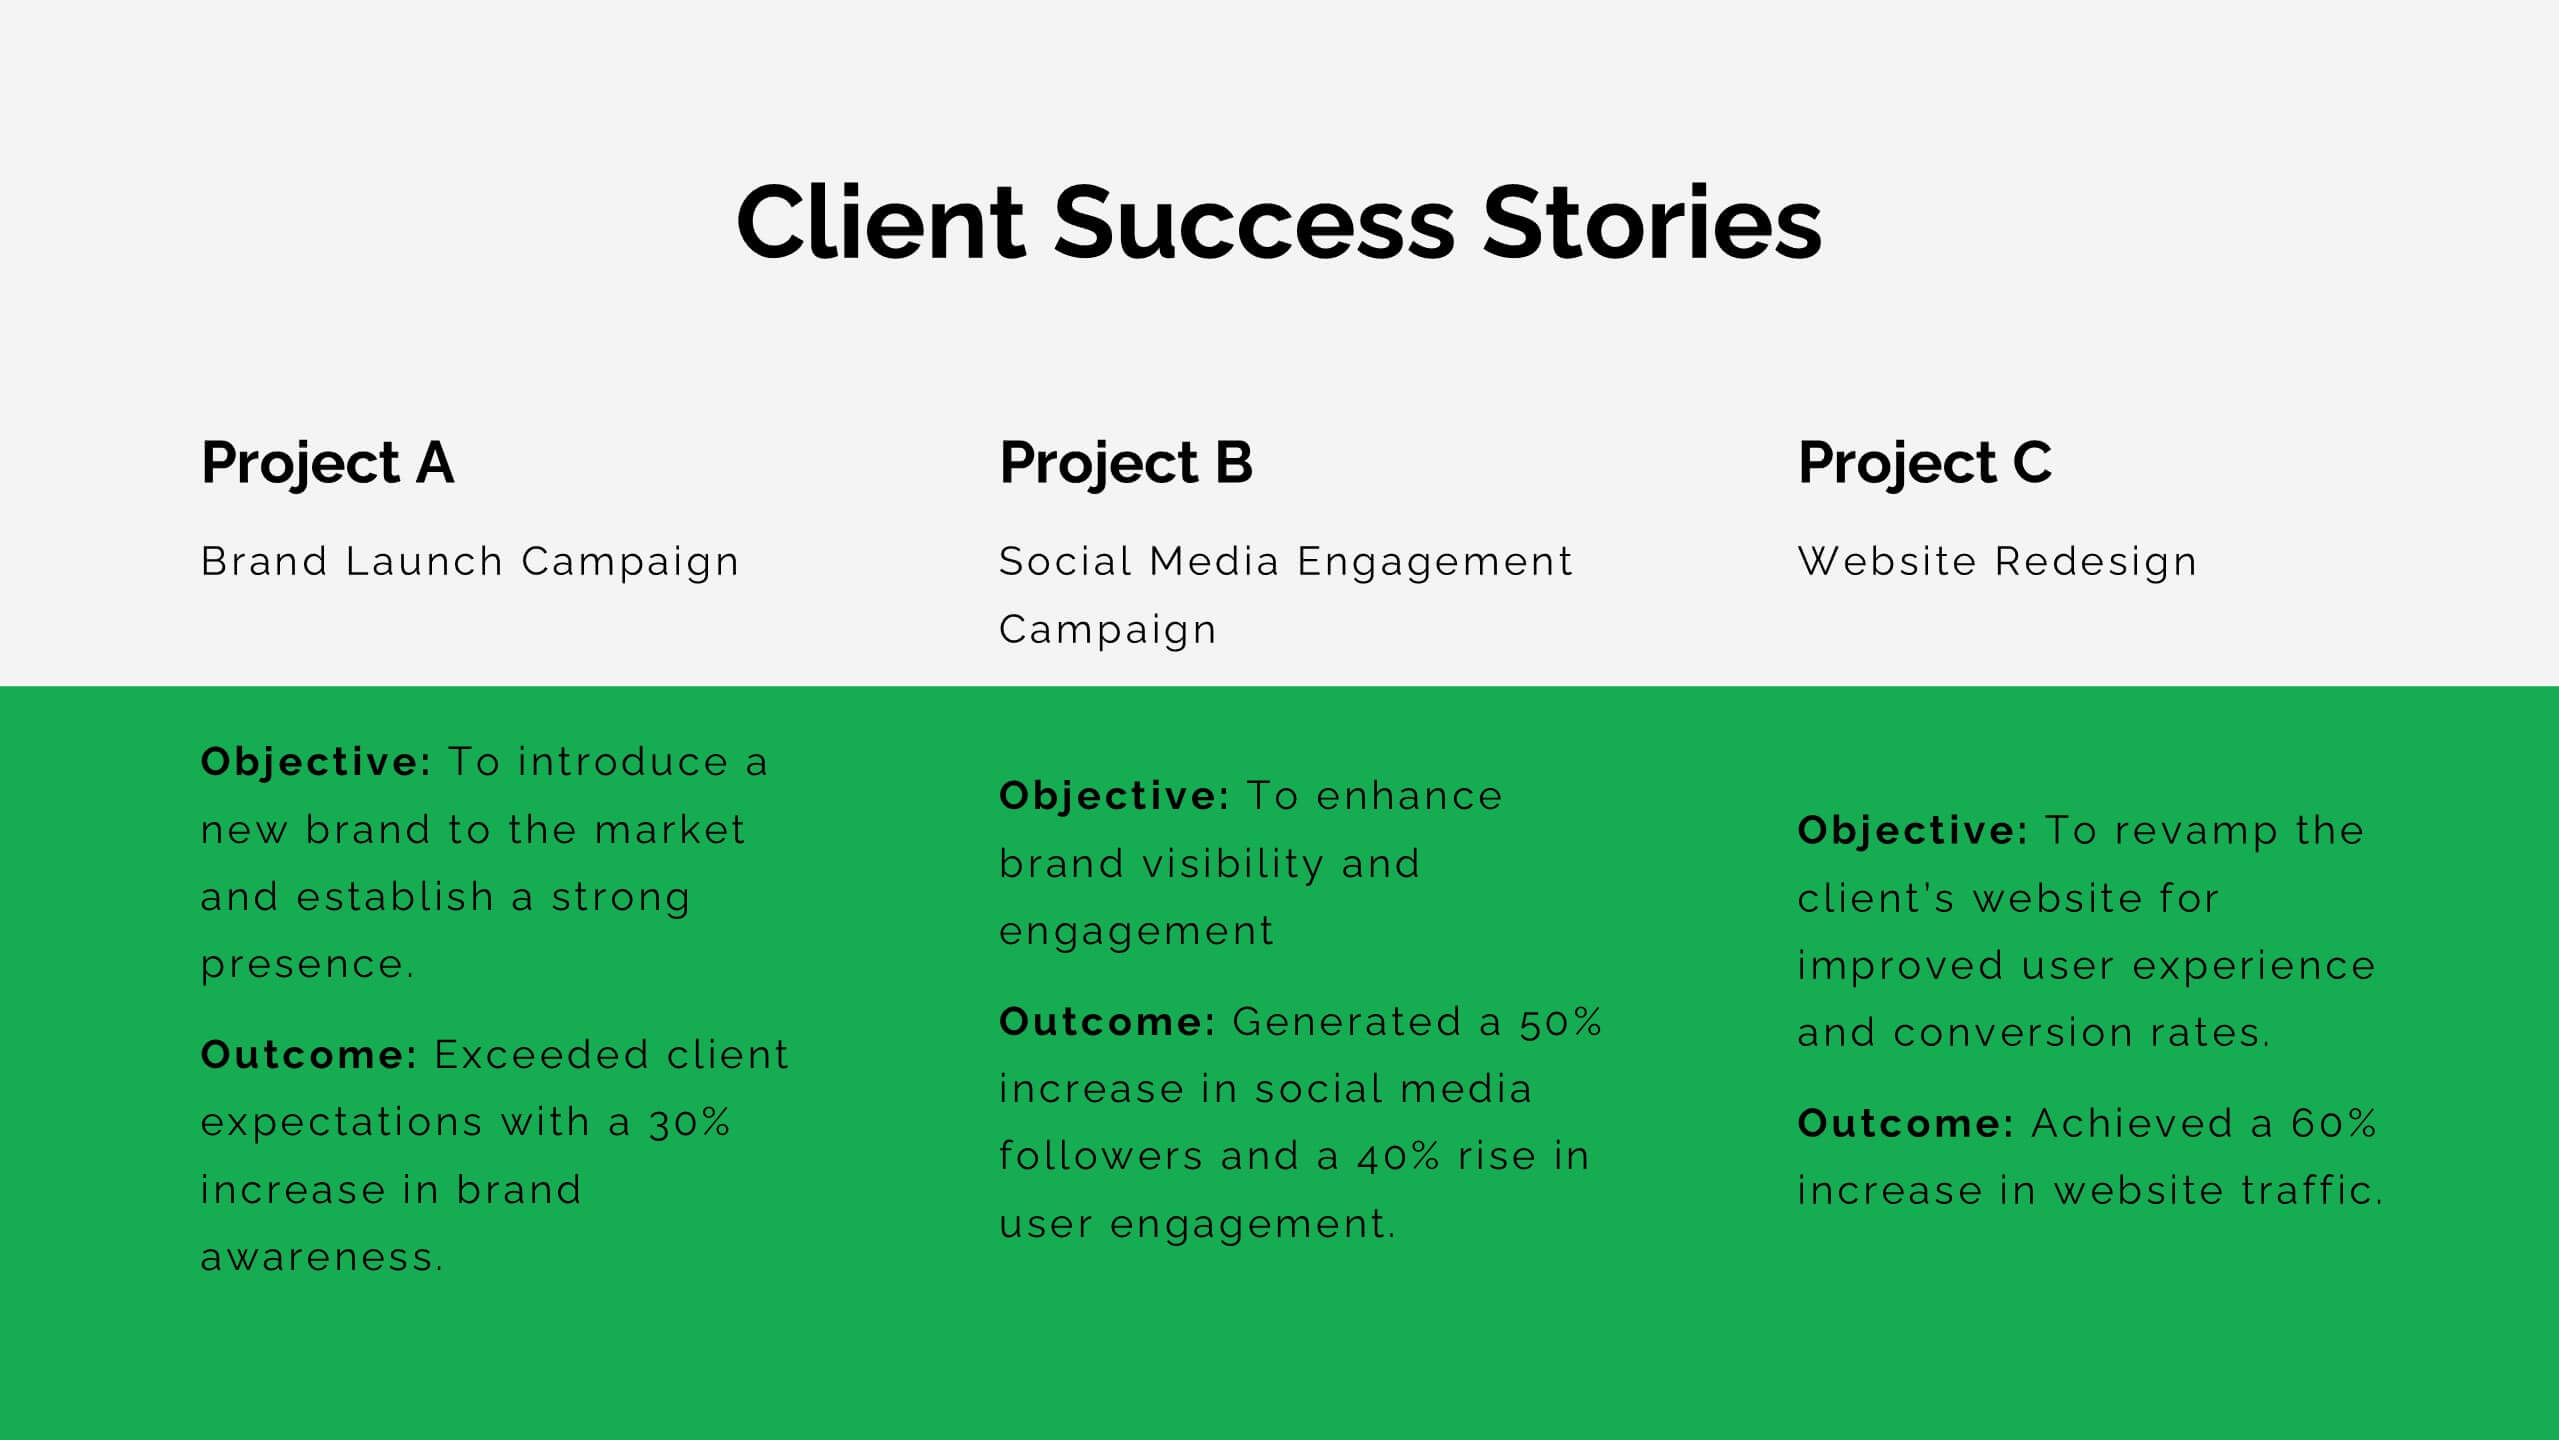
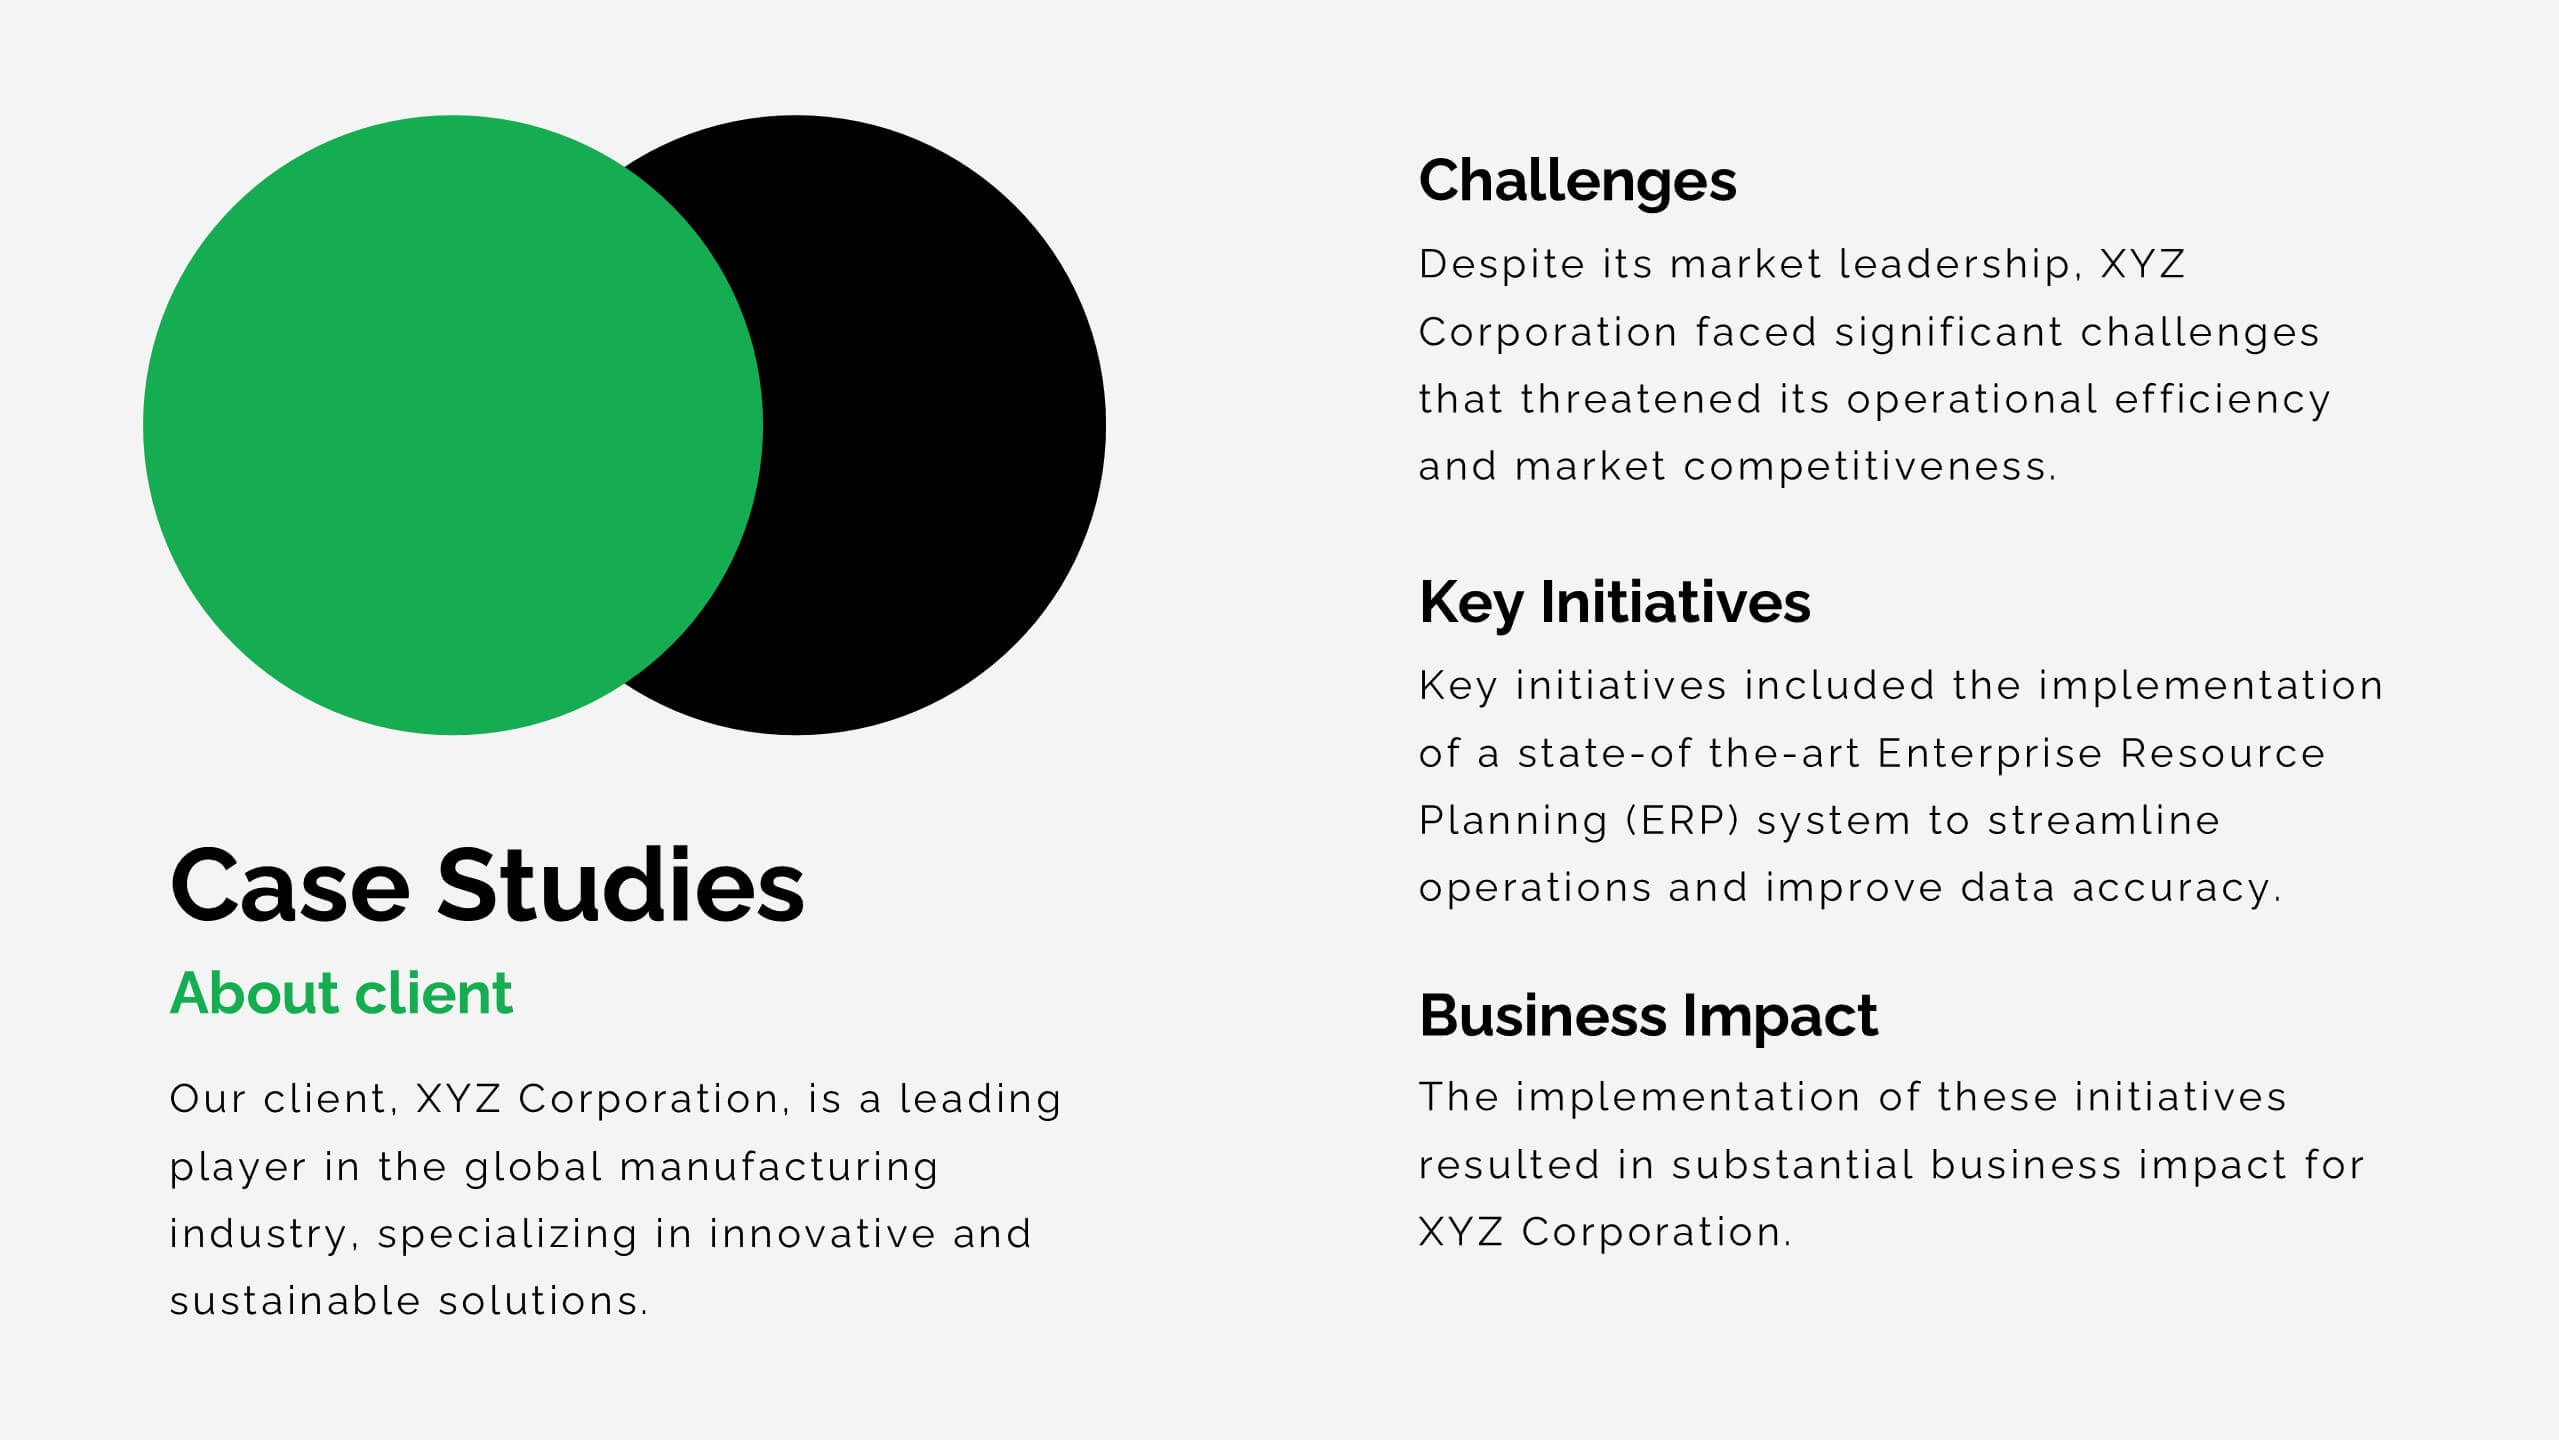
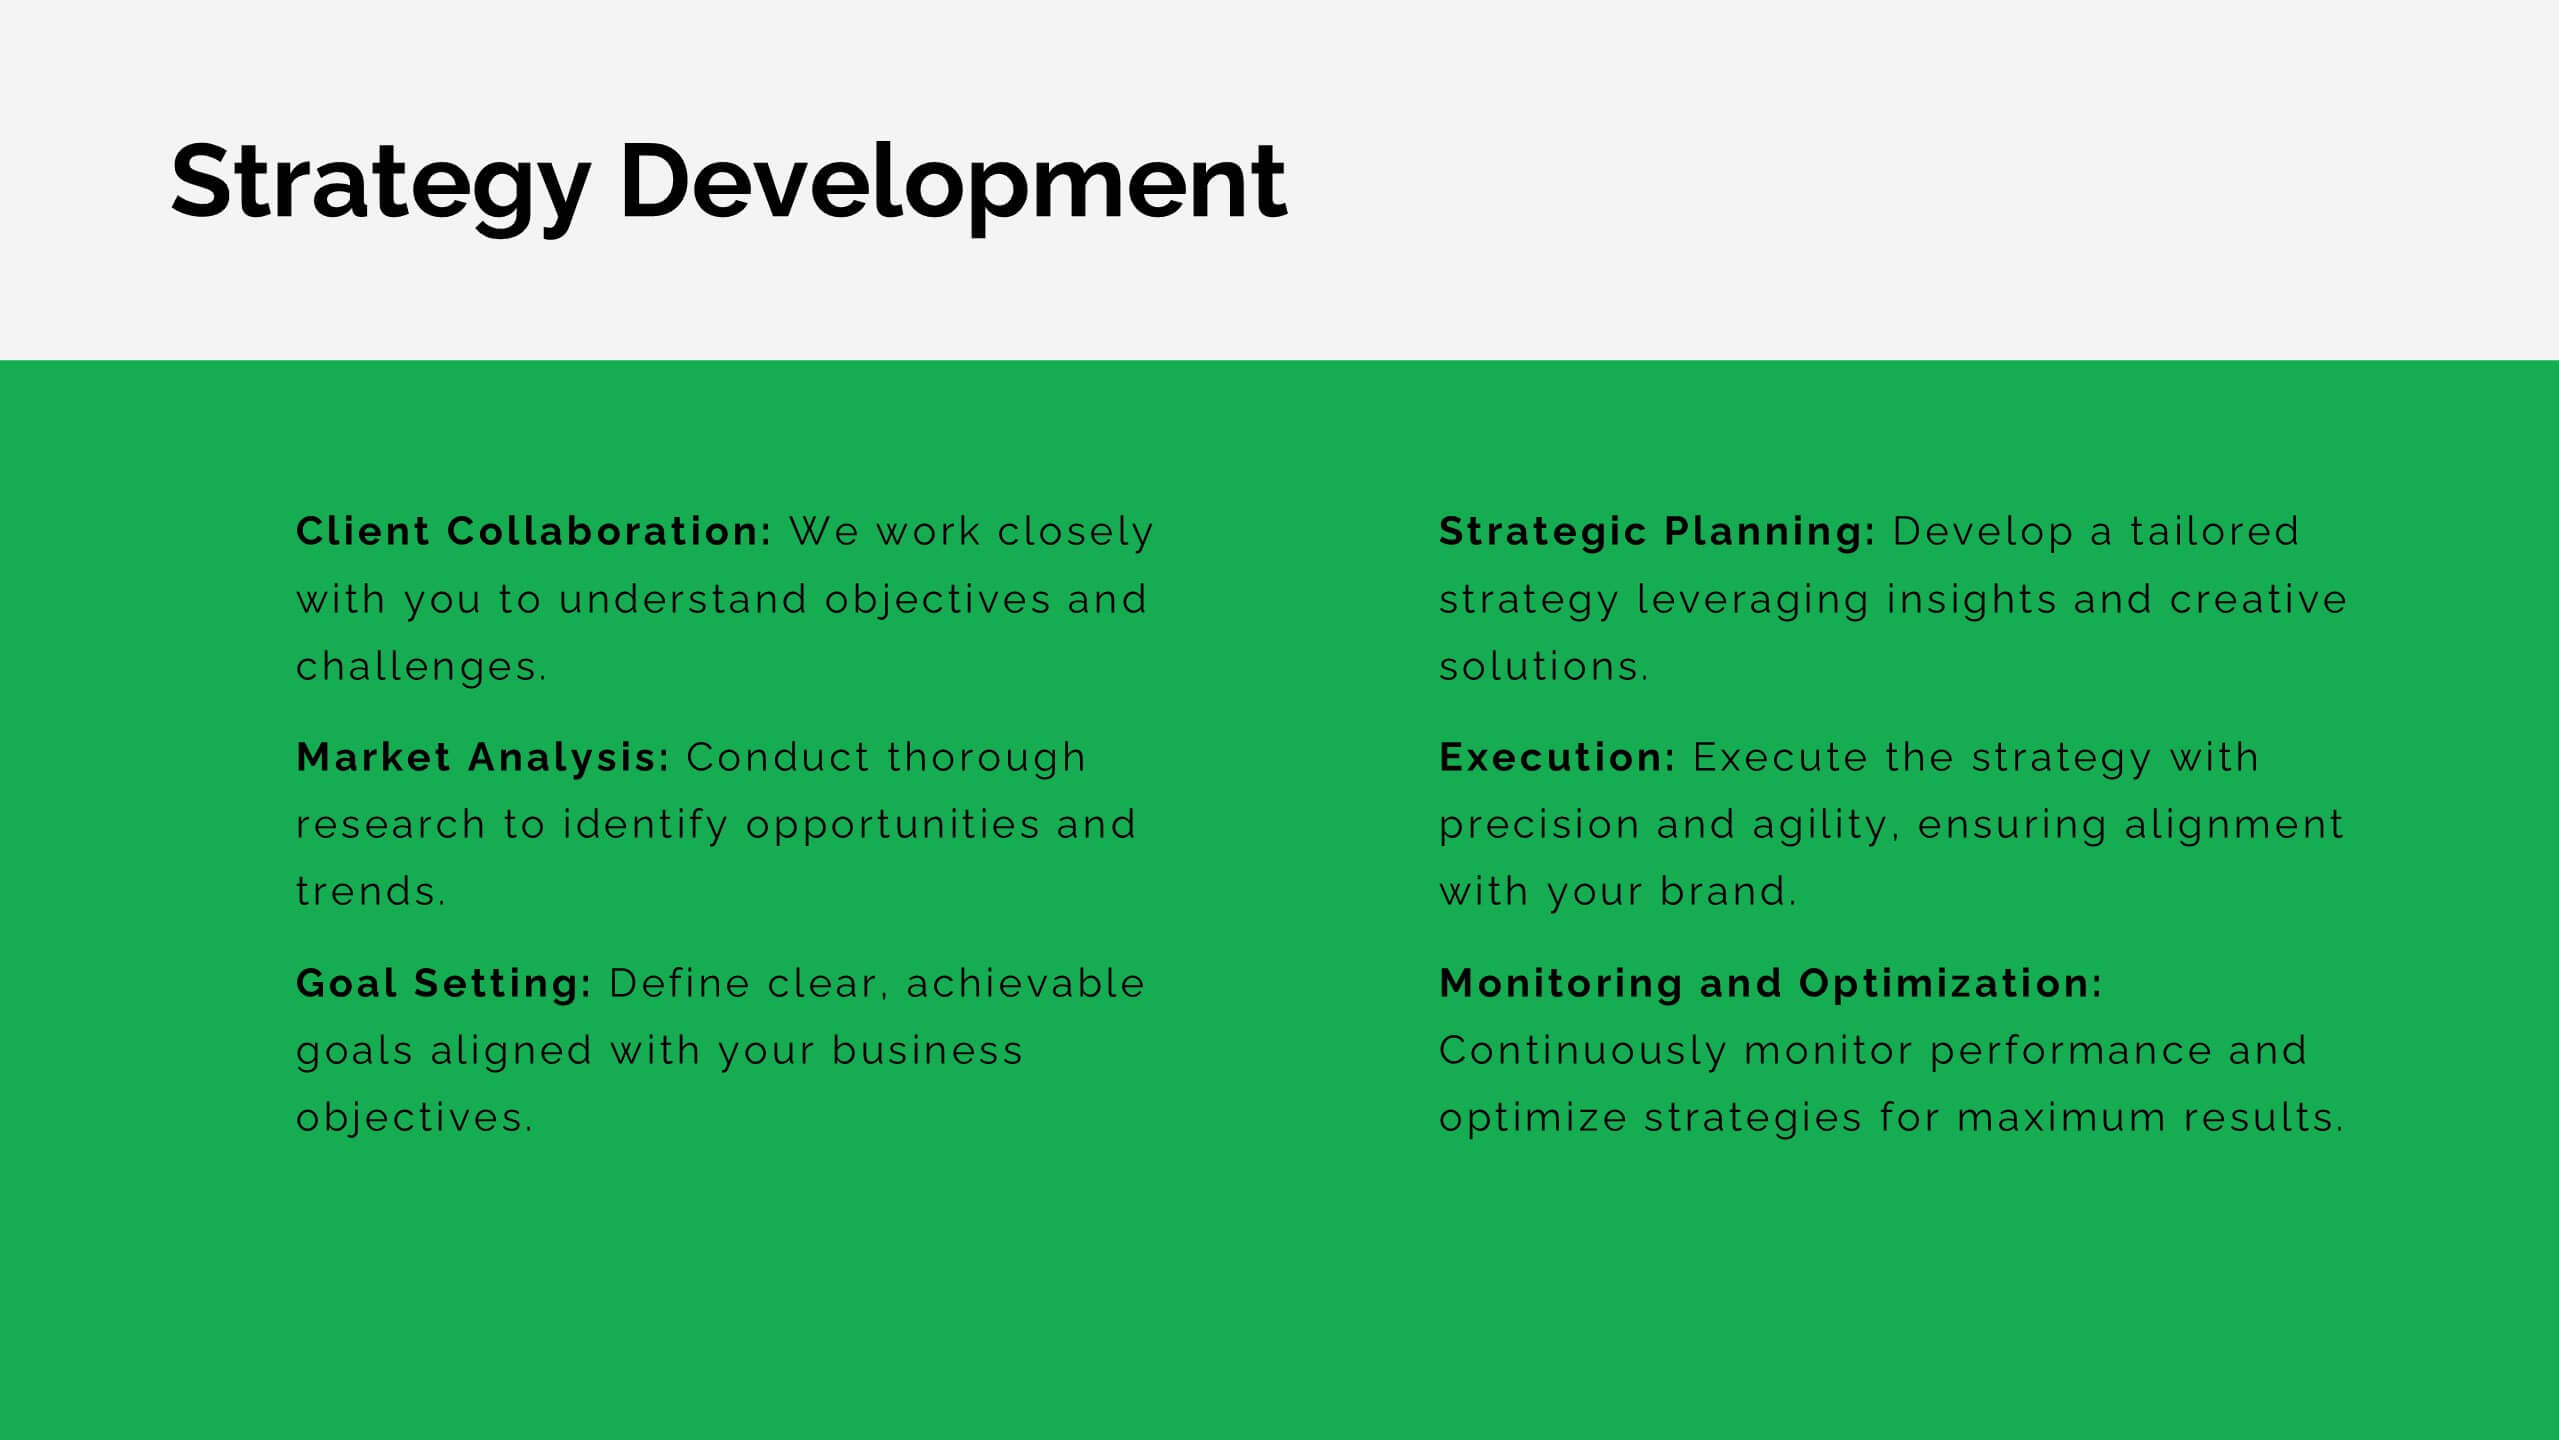
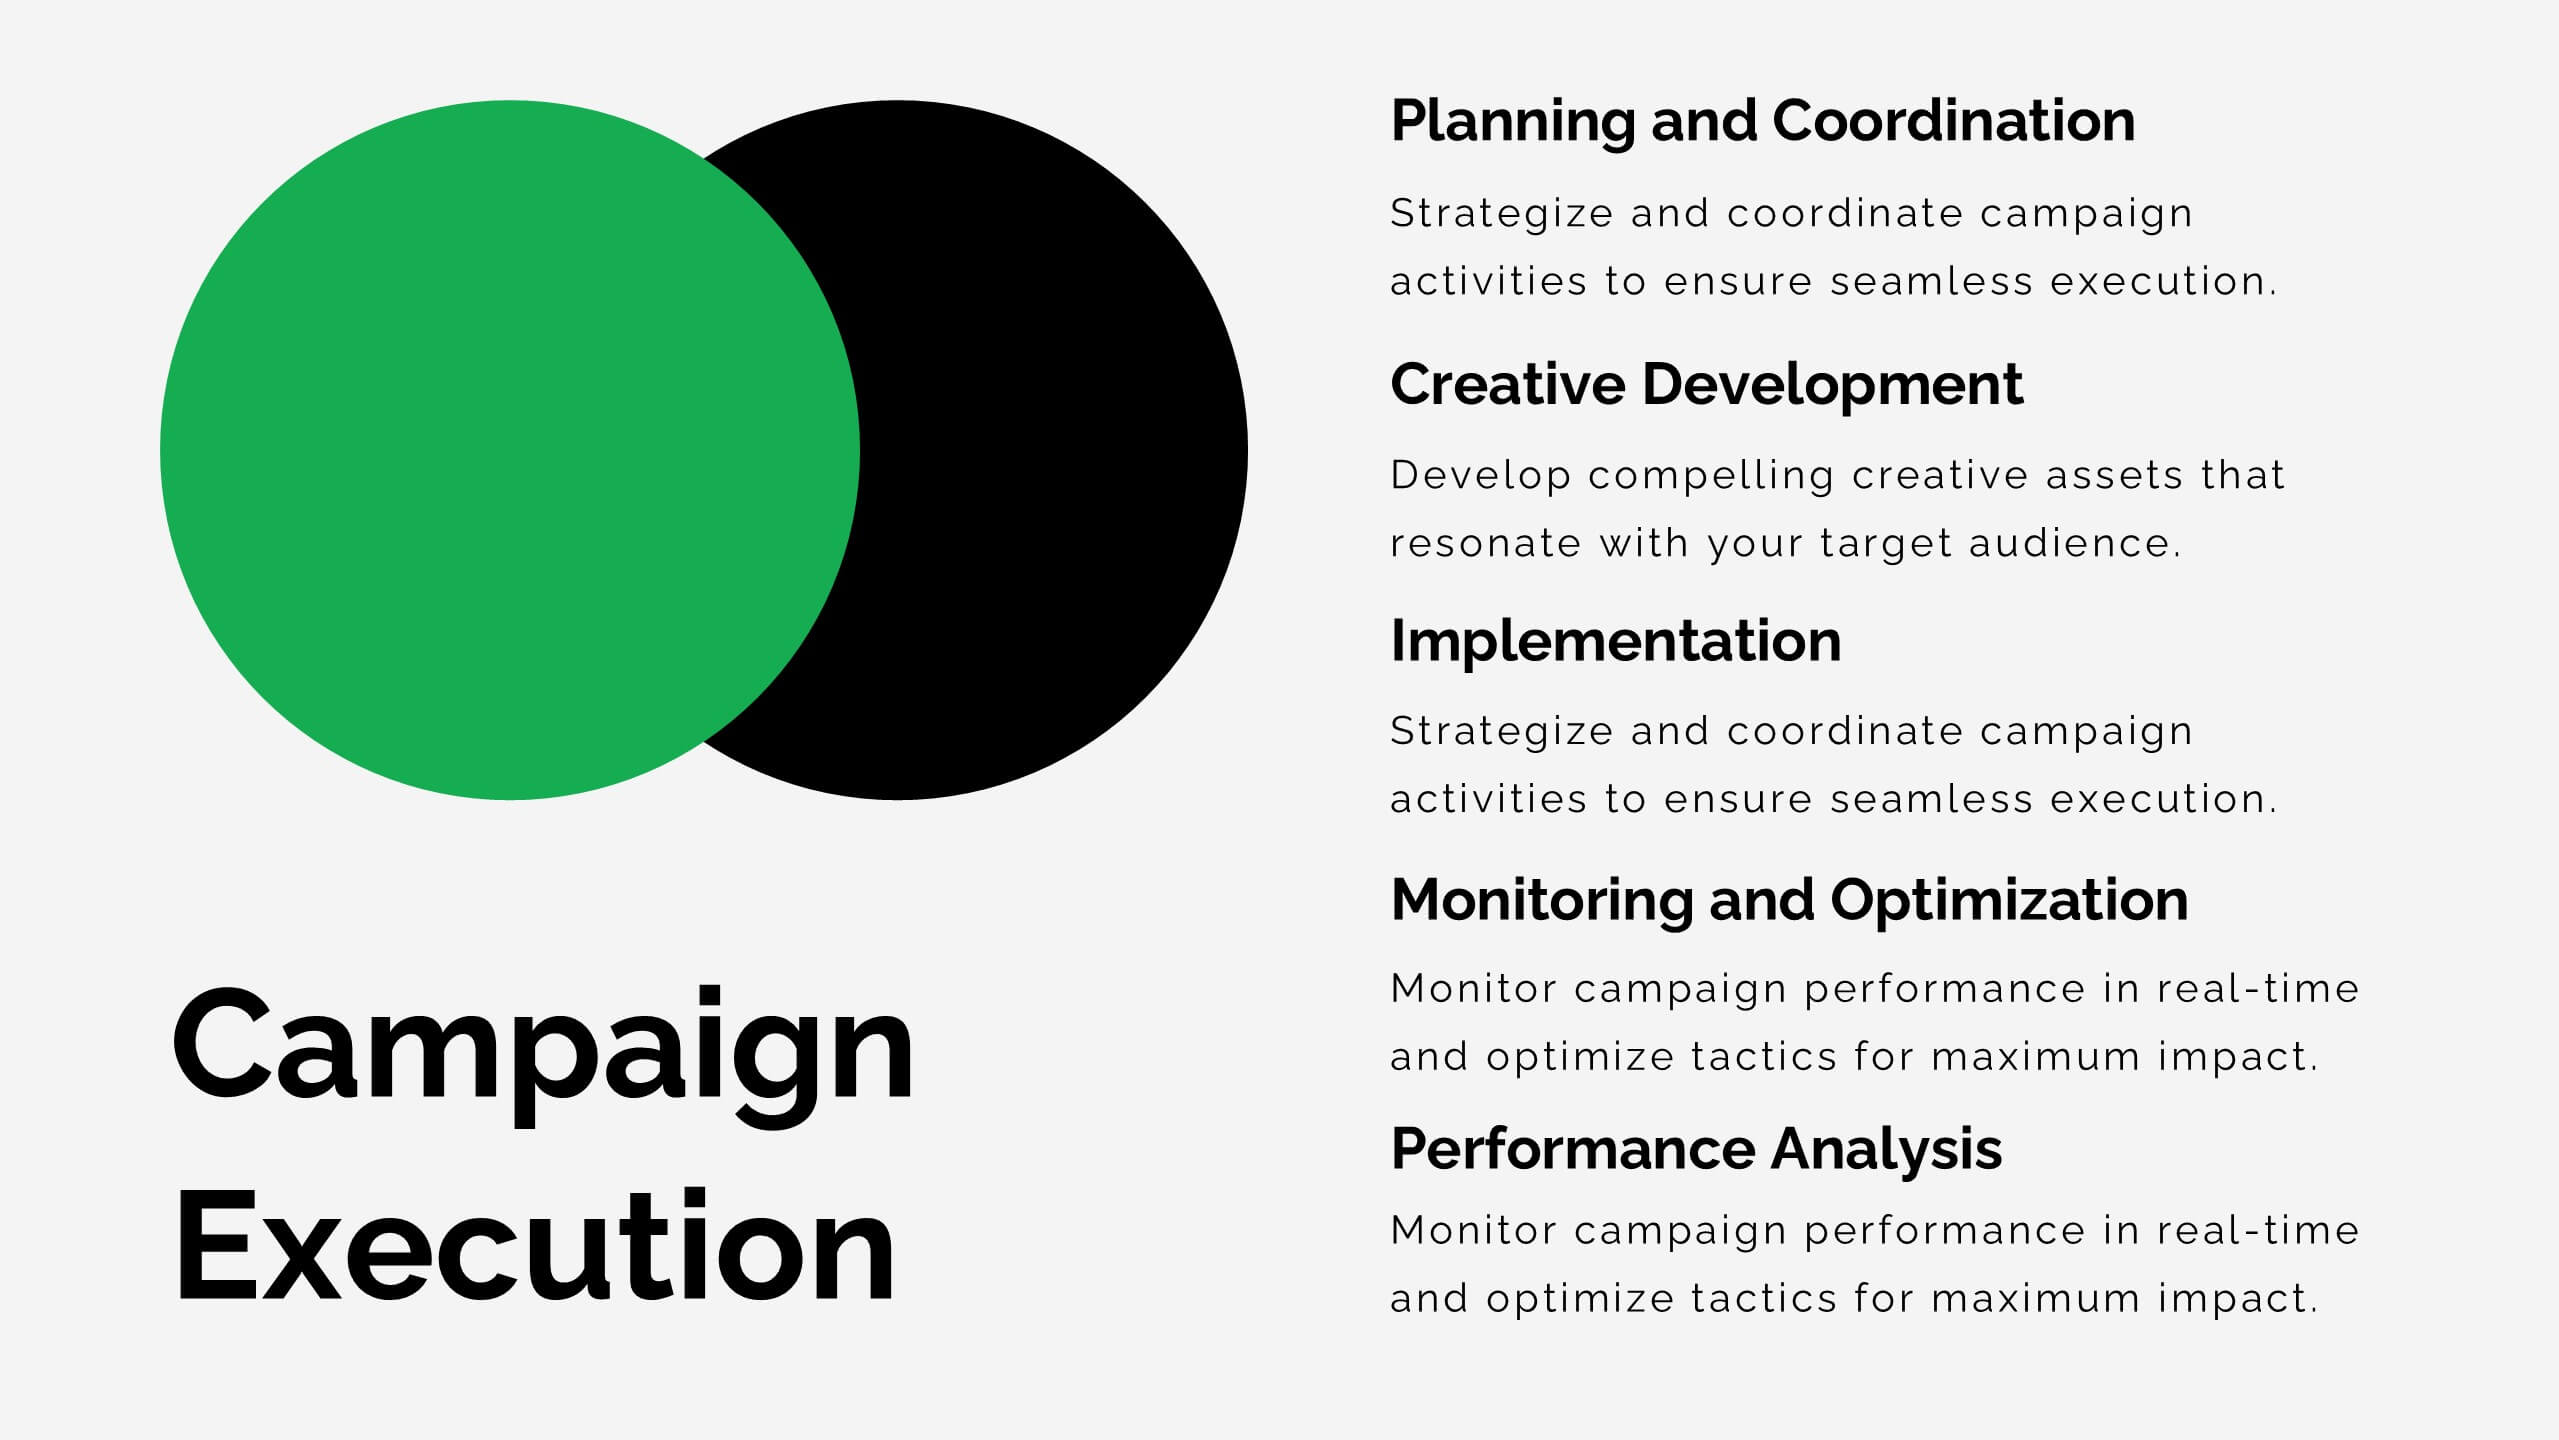
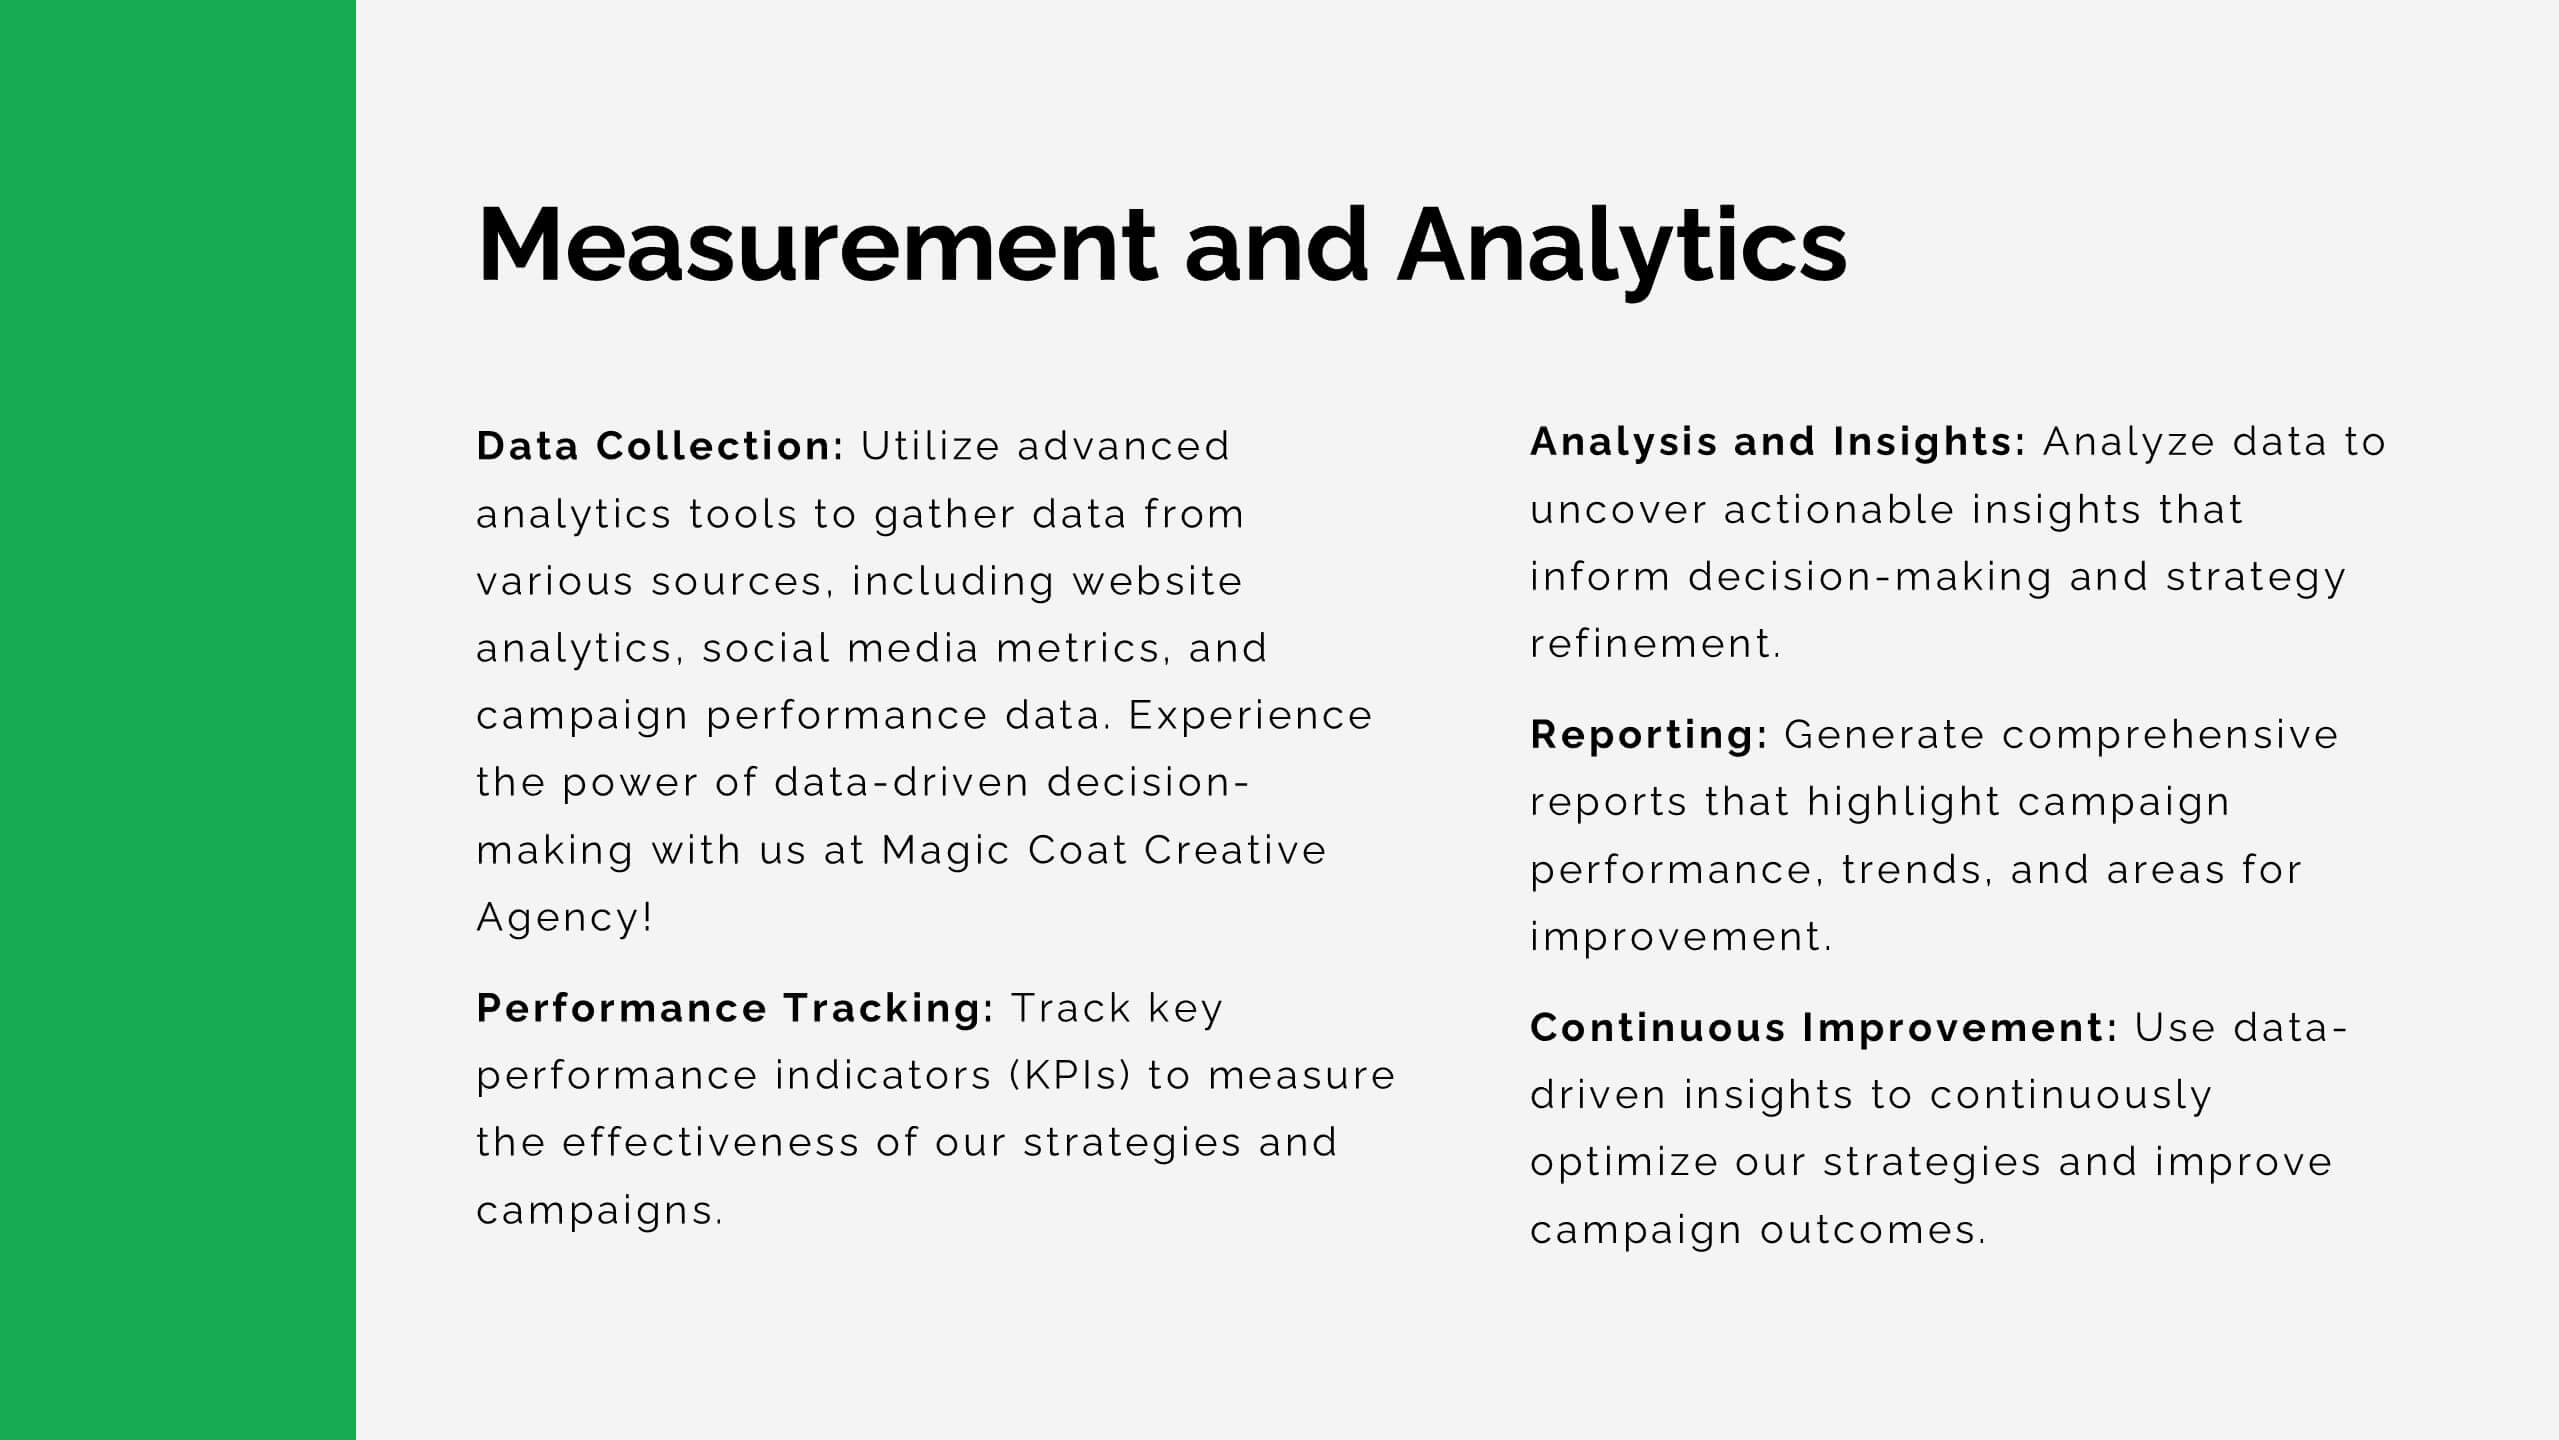
Lithium Advertising Agency Proposal Presentation
Elevate your advertising agency’s proposals with this sleek and modern template! It covers key areas like market analysis, case studies, client success stories, and campaign execution. Fully customizable, this template is perfect for presenting your agency’s services and strategies. Compatible with PowerPoint, Keynote, and Google Slides, it’s designed for impactful client presentations.


5 slides
Creative Problem Solving with Design Thinking Presentation
Bring your innovation process to life with the Creative Problem Solving with Design Thinking Presentation. This visual layout uses gear and bulb icons to highlight four essential stages in the design thinking approach. Perfect for brainstorming sessions, innovation pitches, and product development workshops. Easily editable in Canva, PowerPoint, Google Slides, and Keynote.
8 slides
OKR Strategy Tracker Presentation
Bring your goals to life with a dynamic, structured layout that tracks objectives, measures results, and keeps teams aligned from start to finish. Ideal for strategic planning, quarterly reviews, or business updates, this presentation makes performance tracking effortless. Compatible with PowerPoint, Keynote, and Google Slides for full customization.


21 slides
Sungrove Startup Strategy Presentation
Define and present your startup strategy with this sleek and dynamic template, tailored for showcasing innovative plans and competitive positioning. Dive into key slides like customer needs and market insights, business model breakdown, and unique value proposition to clearly outline your vision. Highlight target market analysis, financial forecasts, and growth projections to ensure stakeholders grasp the potential of your business. The template also includes sections for team introductions, infrastructure planning, and competitor landscape analysis to give a holistic overview of your strategy. Designed for customization and compatibility with PowerPoint, Google Slides, and Keynote, this template is perfect for entrepreneurs or startups aiming to deliver a compelling presentation.


4 slides
Task List and To-Do Management Presentation
Boost productivity with this engaging task management template. Designed for clear visualization, it helps organize priorities, track progress, and streamline workflows efficiently. Featuring a structured layout, it's perfect for professionals managing daily to-dos, project timelines, or business strategies. Fully compatible with PowerPoint, Keynote, and Google Slides for seamless use.