


Features
- 8 Unique slides
- Fully editable and easy to edit in Microsoft Powerpoint, Keynote and Google Slides
- 16:9 widescreen layout
- Clean and professional designs
- Export to JPG, PDF or send by email


Do you have any questions?
Recommend


7 slides
Time Management Strategies Infographic Presentation
Time management is the process of planning, organizing, and allocating time effectively to achieve specific goals and objectives. This simple and professional template shows you the basics of time management. It uses a combination of bullet points, tables and illustrations to give you the information you need in a practical form. Use this presentation as a step-by-step guide on how you can become more efficient at managing daily business tasks. This infographic template is designed to help you manage your time and prioritize your actions by highlighting the different aspects of a task.


4 slides
Country-Specific Data World Map Presentation
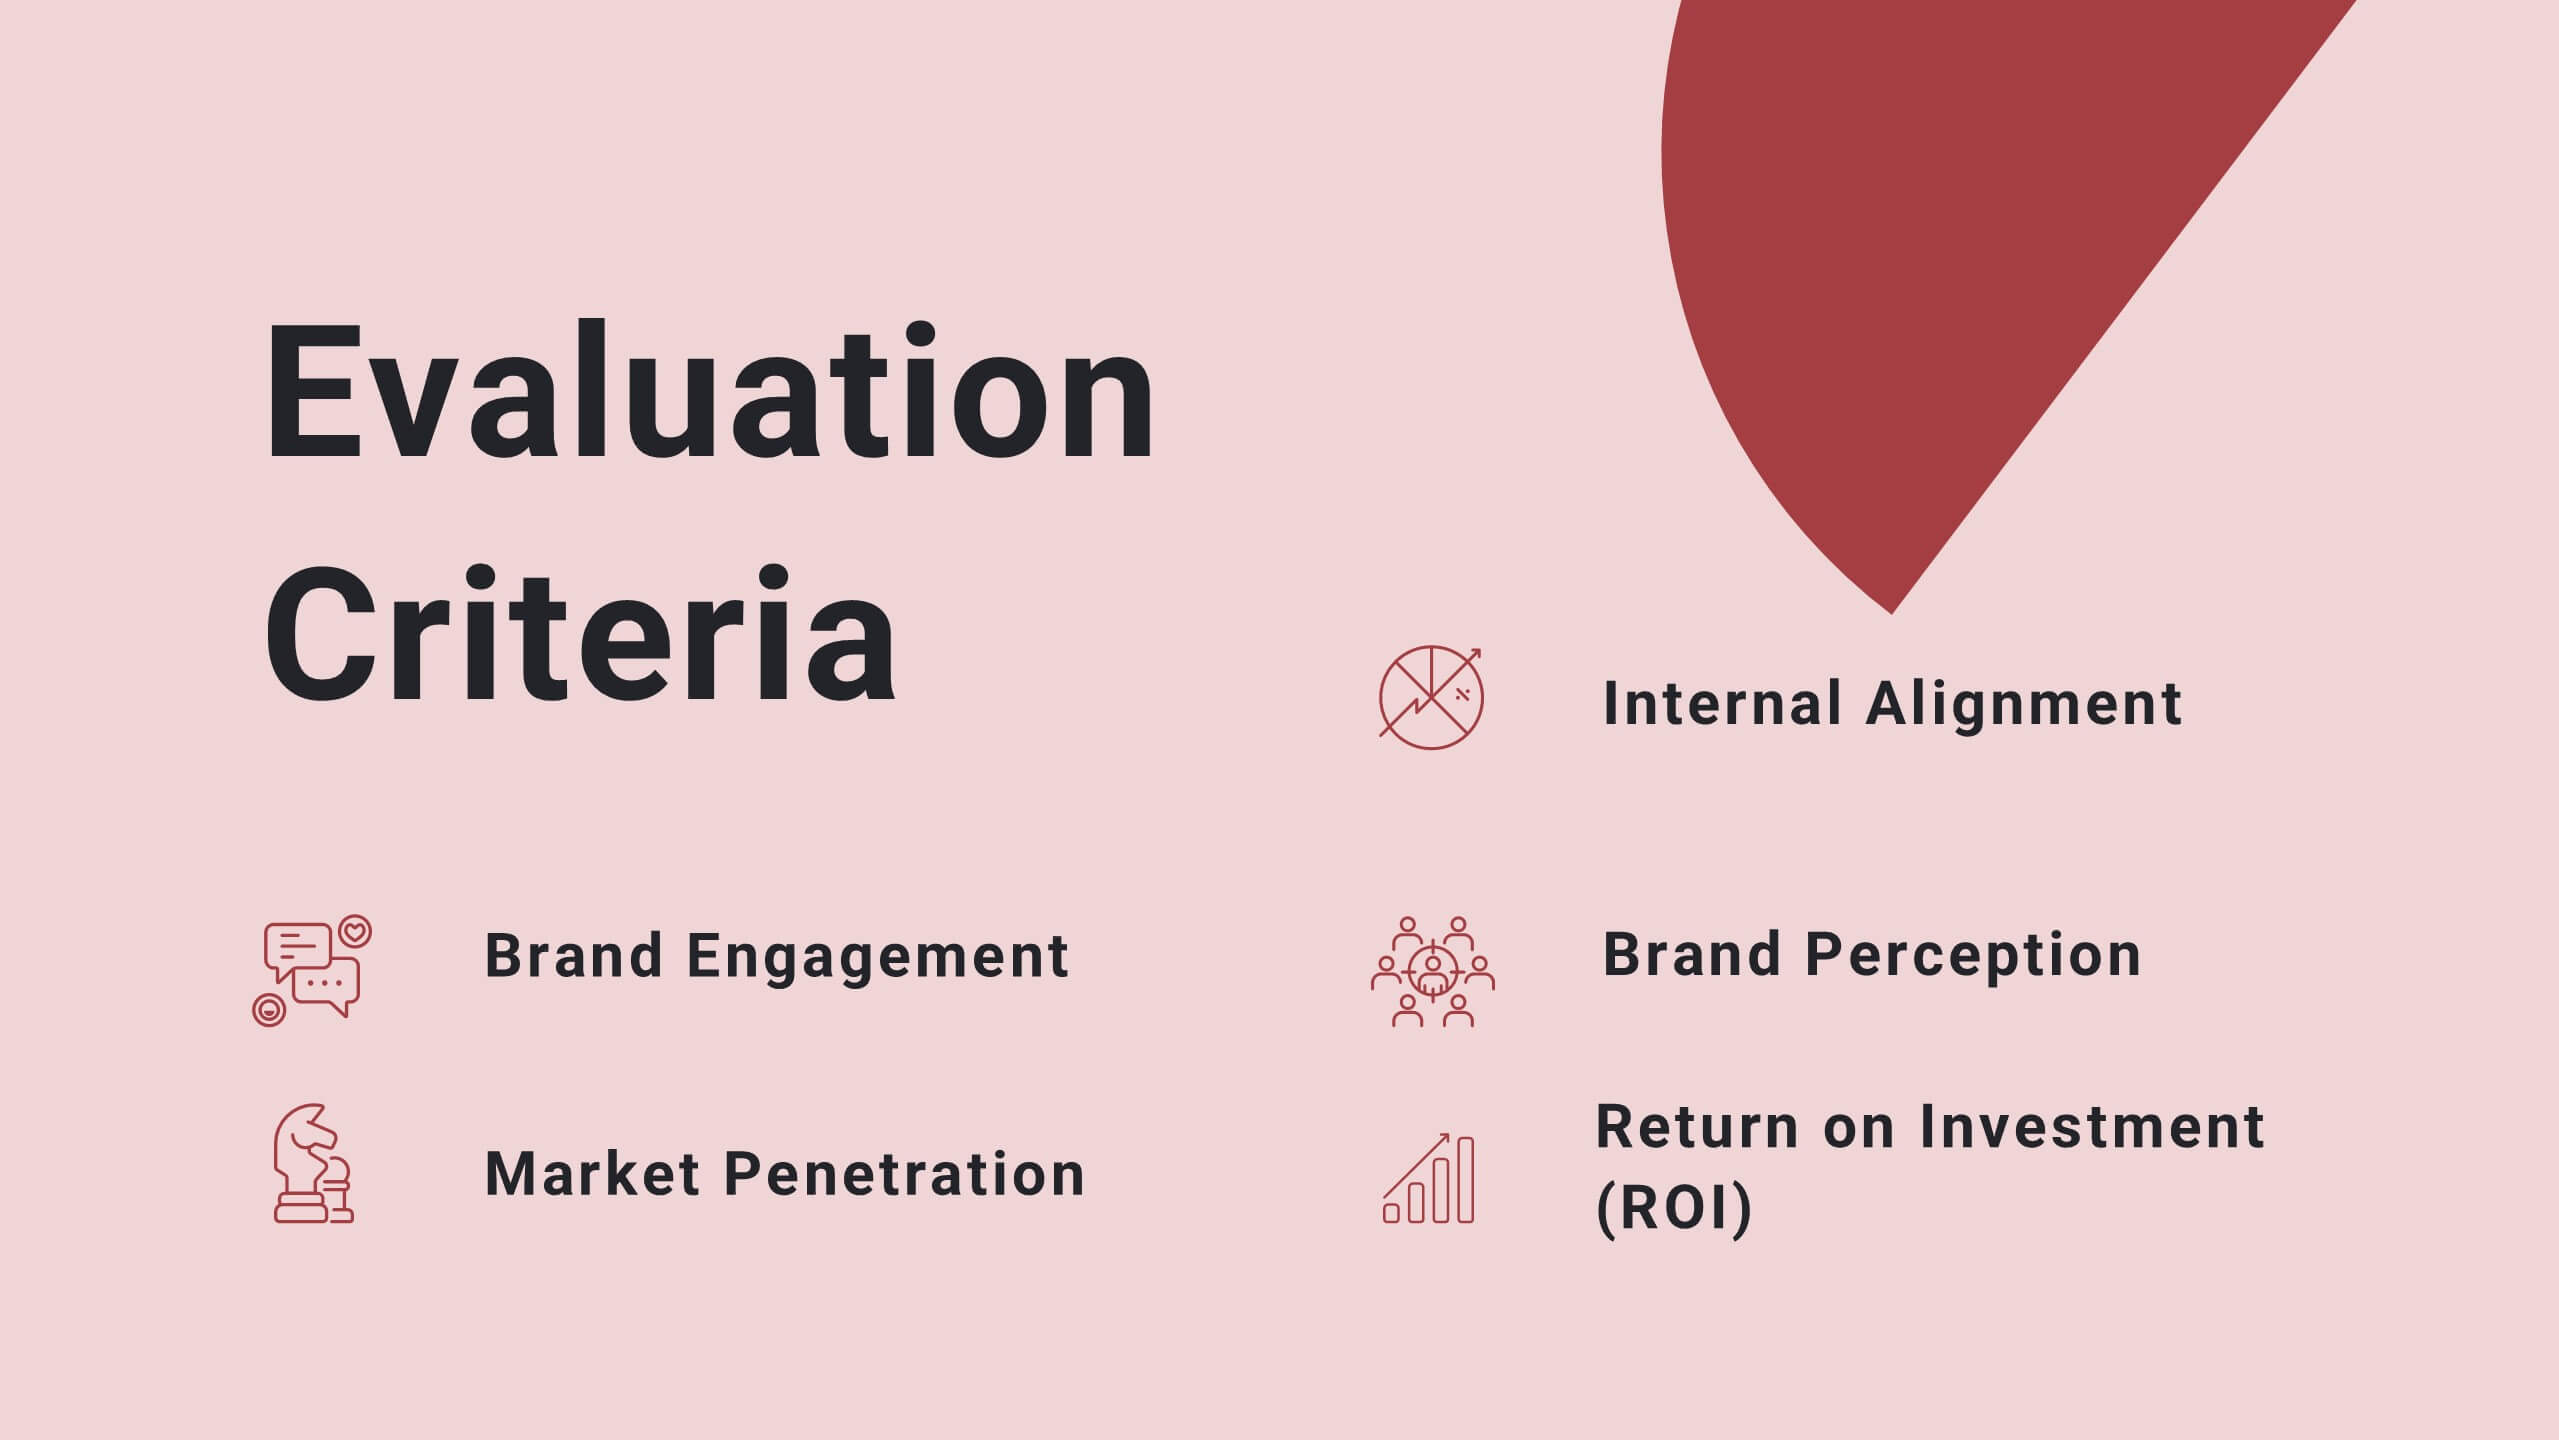
Visually highlight regional data insights with this sleek Country-Specific Data World Map slide. Designed for clarity and impact, this layout lets you present four key statistics or findings alongside a pinpointed global map. Each percentage and title is customizable—ideal for business growth, research, or market penetration analysis. Clean design ensures your message stands out. Fully editable and compatible with PowerPoint, Keynote, and Google Slides.


7 slides
North America Map Infographic Presentation Template
North America is a continent entirely within the Northern Hemisphere and almost all within the Western Hemisphere. It can also be considered a northern subcontinent of the Americas. North America is the third largest continent in the world, and home to some of the world's most iconic landmarks. This North America template is great for creating a simple and clean map. This easy-to-customize map includes icons in both light and dark color variations. This North America map template is great for presentations, reports and more. Add your data to create a professional presentation.


3 slides
Professional Introduction Slide
Introduce team members with clarity and style using this profile-focused slide. Designed to highlight key stats, roles, and responsibilities, it’s perfect for internal presentations, onboarding, or proposals. Easily customizable in PowerPoint, Keynote, and Google Slides.


10 slides
Project Responsibility Chart Presentation
Streamline your project management with our Project Responsibility Chart template. Designed to clarify roles and tasks across your team, this color-coded chart ensures transparency and efficiency. Ideal for project leads to assign duties clearly and effectively. The template supports PowerPoint, Keynote, and Google Slides, making it versatile for any team environment.


25 slides
Company Profile Presentation
Embark on a corporate expedition with a comprehensive view into the essence of our company, where every segment unfolds our identity, goals, and the values that steer our journey. Meet the dynamic team at the helm, diverse minds and talents crafting the future with innovation and dedication. Navigate through our strategic roadmap, from humble beginnings to ambitious horizons, spotlighting our customer-centric approach that underpins every achievement. Witness our milestones arrayed in a timeline that speaks volumes of progress and resilience, punctuated by major leaps and bounds in our industry. Grasp our ethos, 'Customer Satisfaction is our Top Priority,' a mantra evident in each service we render and product we craft. Within these slides lies a story of growth, learning, and unyielding commitment to excellence. As we project the chart of our achievements, a pattern of steady ascension emerges, painting a picture of a company that not only dreams big but also acts with precision to materialize those dreams. This profile is more than a showcase—it's an invitation to explore the depths of our corporate narrative, and a thank you to all who join us on this remarkable venture.


12 slides
Effective Decision-Making with RAPID Presentation
Unlock streamlined decision-making with the Effective Decision-Making with RAPID template, a comprehensive guide designed to help organizations enhance and clarify their decision-making processes. Covering the key phases: Recommend, Agree, Perform, Input, and Decide, this template is essential for teams looking to optimize operational efficiency. Ideal for a variety of business environments, it is compatible with PowerPoint, Keynote, and Google Slides, offering versatility and ease of use for professionals.


7 slides
Artificial Intelligence Uses Infographic
Artificial Intelligence (AI) is no longer just a concept of sci-fi narratives but an integral part of our daily lives. Our compelling infographic, set against a clean white backdrop with contrasting hues of blue, provides a captivating look into the myriad uses of AI. From healthcare innovations to smart home solutions, our visually engaging template breaks down complex AI applications into digestible information bites. Ideal for educators, tech enthusiasts, and businesses, it's a versatile tool designed for multiple presentation platforms, including PowerPoint, Keynote, and Google Slides.


5 slides
Enterprise Risk Management Framework Presentation
Visualize your organization’s risk strategy with the Enterprise Risk Management Framework Presentation. This slide outlines four core steps—Set Objective, Identify Risks, Assess Risks, and Risk Response—using a clear, directional design. Perfect for risk assessments, board updates, or audit reviews. Fully editable in PowerPoint, Google Slides, and Canva.


10 slides
Corporate Growth Strategy Presentation
Elevate your corporate presentations with our "Corporate Growth Strategy Presentation" template. Designed to visually represent key growth strategies, this infographic uses a wrench graphic to symbolize the tools necessary for business expansion. Each segment of the wrench is color-coded, highlighting different strategic elements clearly and effectively. This format aids in discussing business objectives systematically, from foundational practices to advanced goals. Ideal for executives, strategists, and business analysts, this template ensures professional and coherent delivery of complex strategies. Compatible with PowerPoint, Keynote, and Google Slides, it is an indispensable tool for articulating and presenting sophisticated corporate strategies.


8 slides
Vision-Oriented Goal Roadmap Presentation
Achieve alignment with the Vision-Oriented Goal Roadmap Presentation. Featuring a clear bullseye target and directional arrows, this layout highlights priority goals and action steps. Perfect for strategic planning, leadership briefings, or team objectives. Easily editable in PowerPoint, Keynote, and Google Slides to match your brand and vision.


6 slides
Trip Planning Framework and Schedule Presentation
Plan every detail of your journey with ease using this Trip Planning Framework and Schedule Presentation. This template includes dedicated sections for dates, destinations, transportation, to-do lists, and shopping needs, all structured in a clean and colorful layout. Ideal for travel agents, personal planners, and group trip organizers. Fully editable in PowerPoint, Keynote, and Google Slides.


21 slides
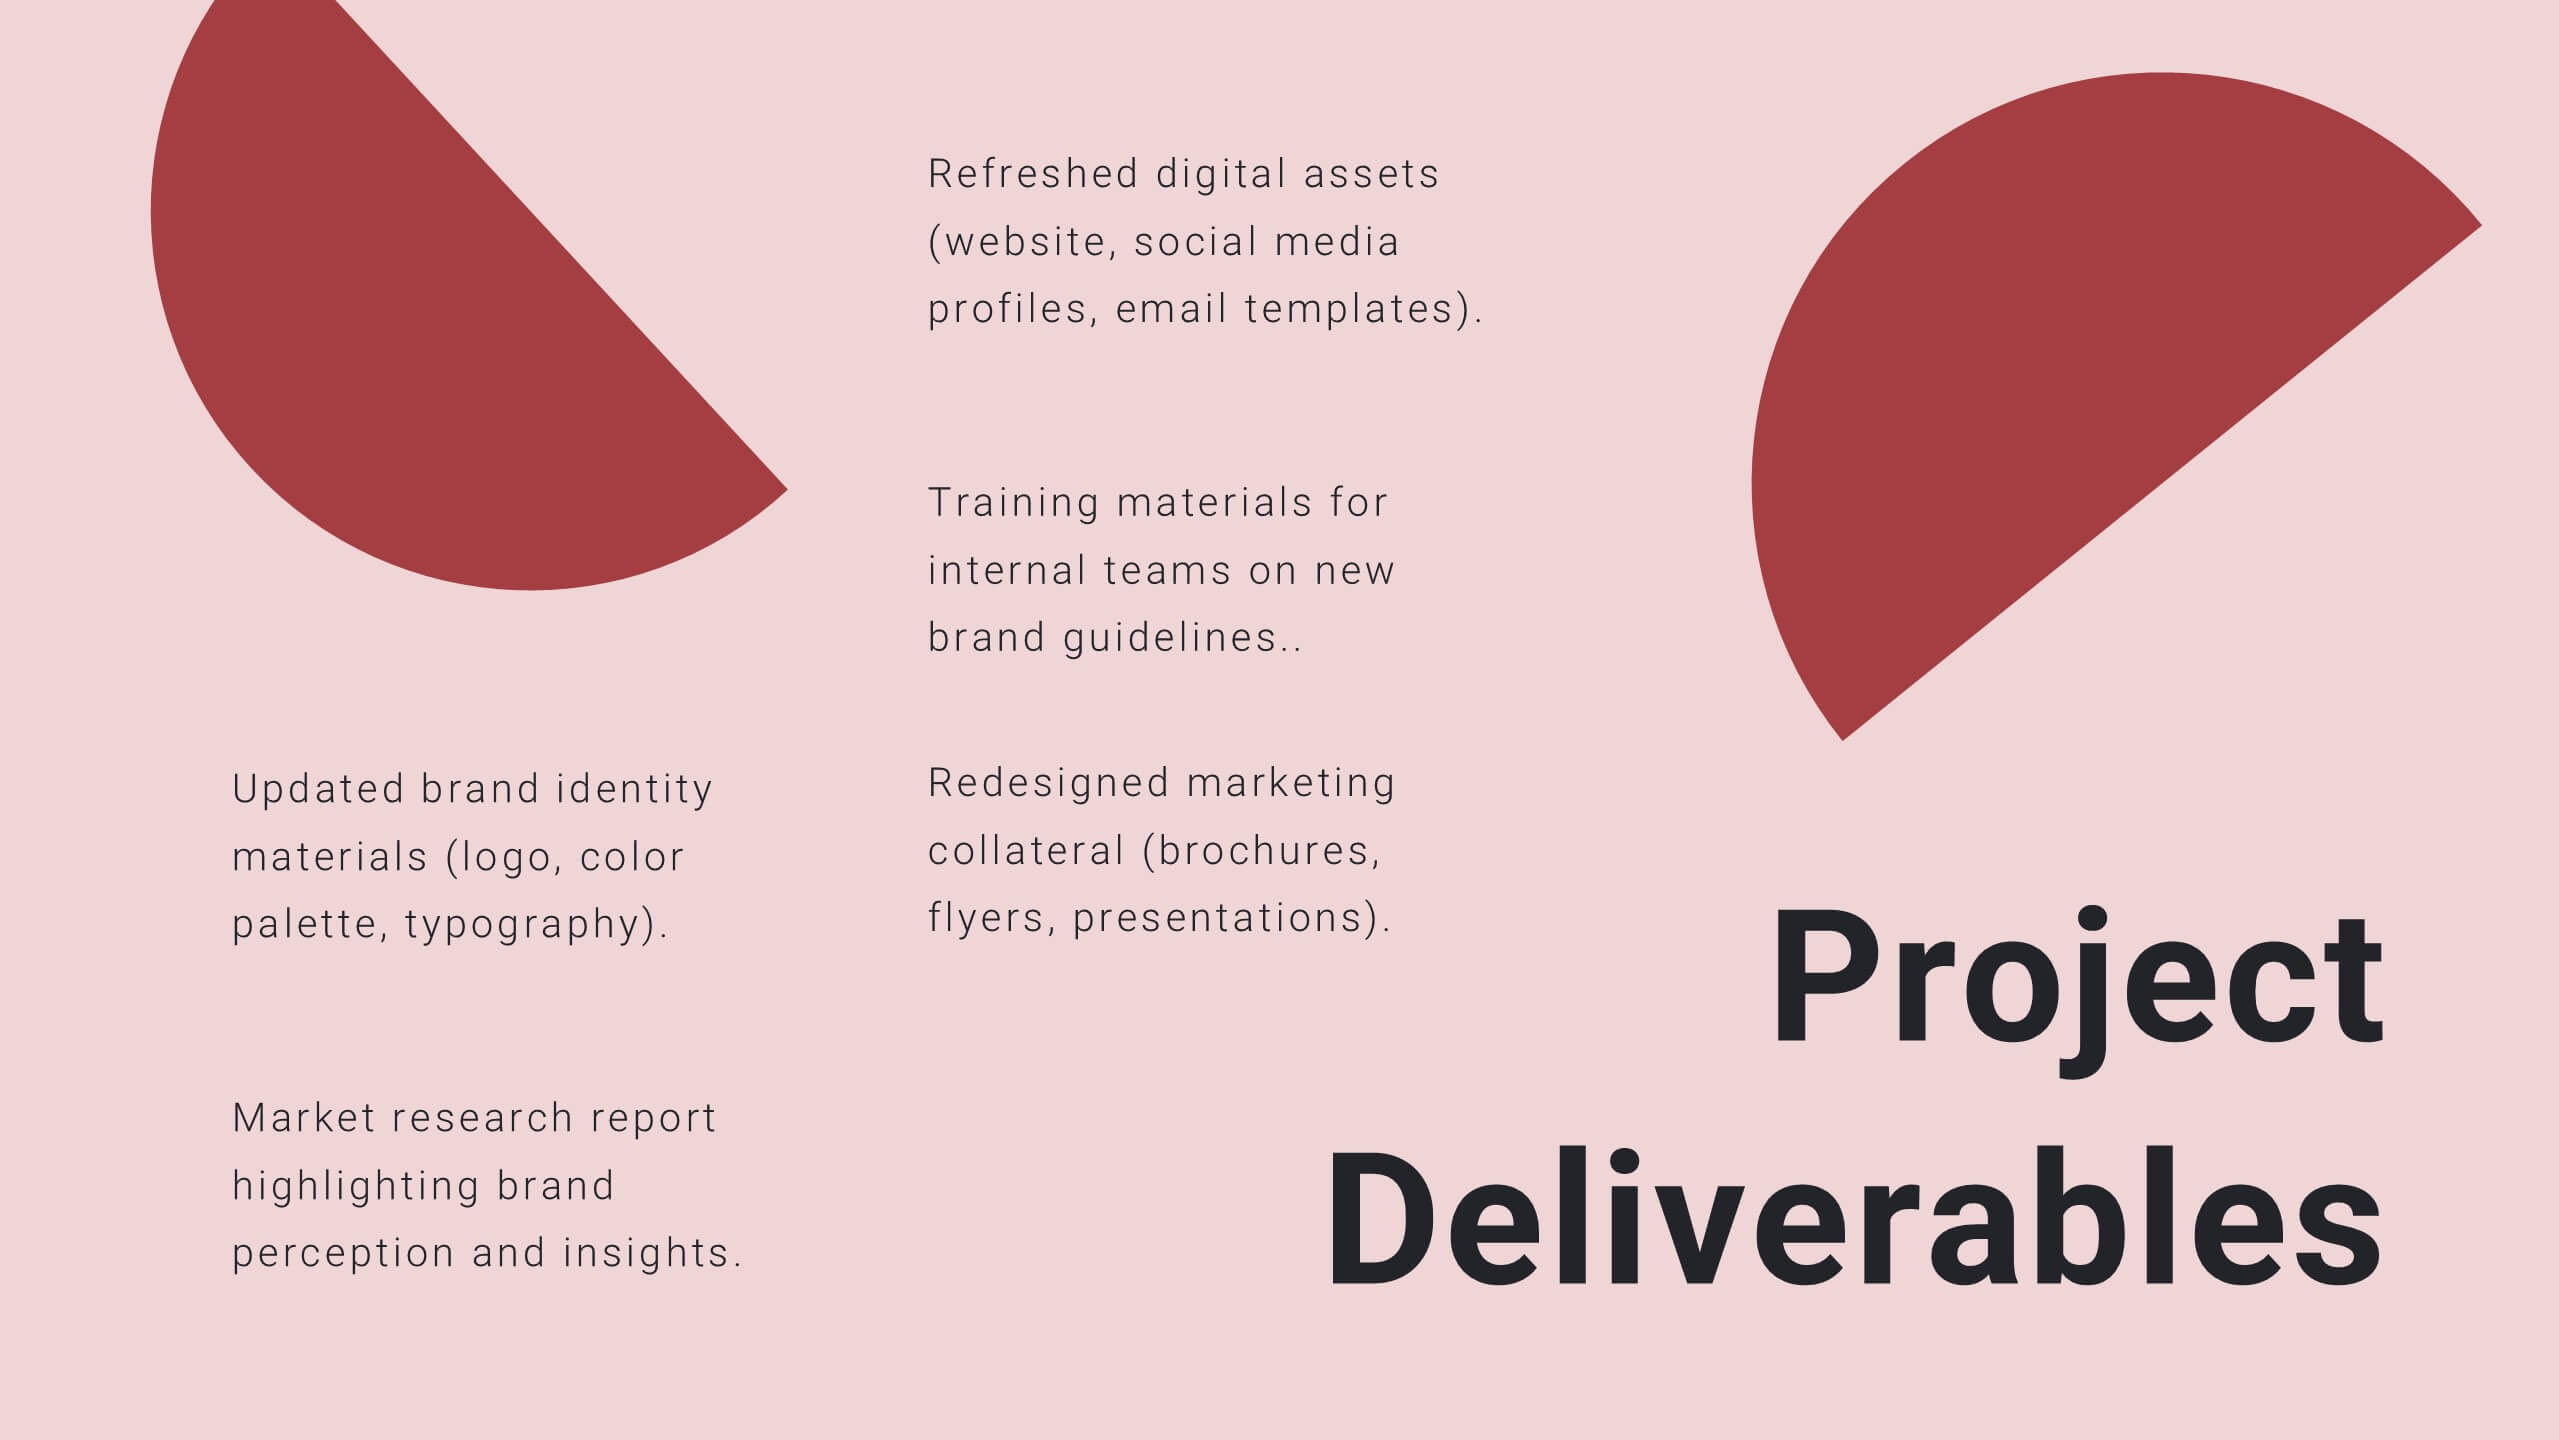
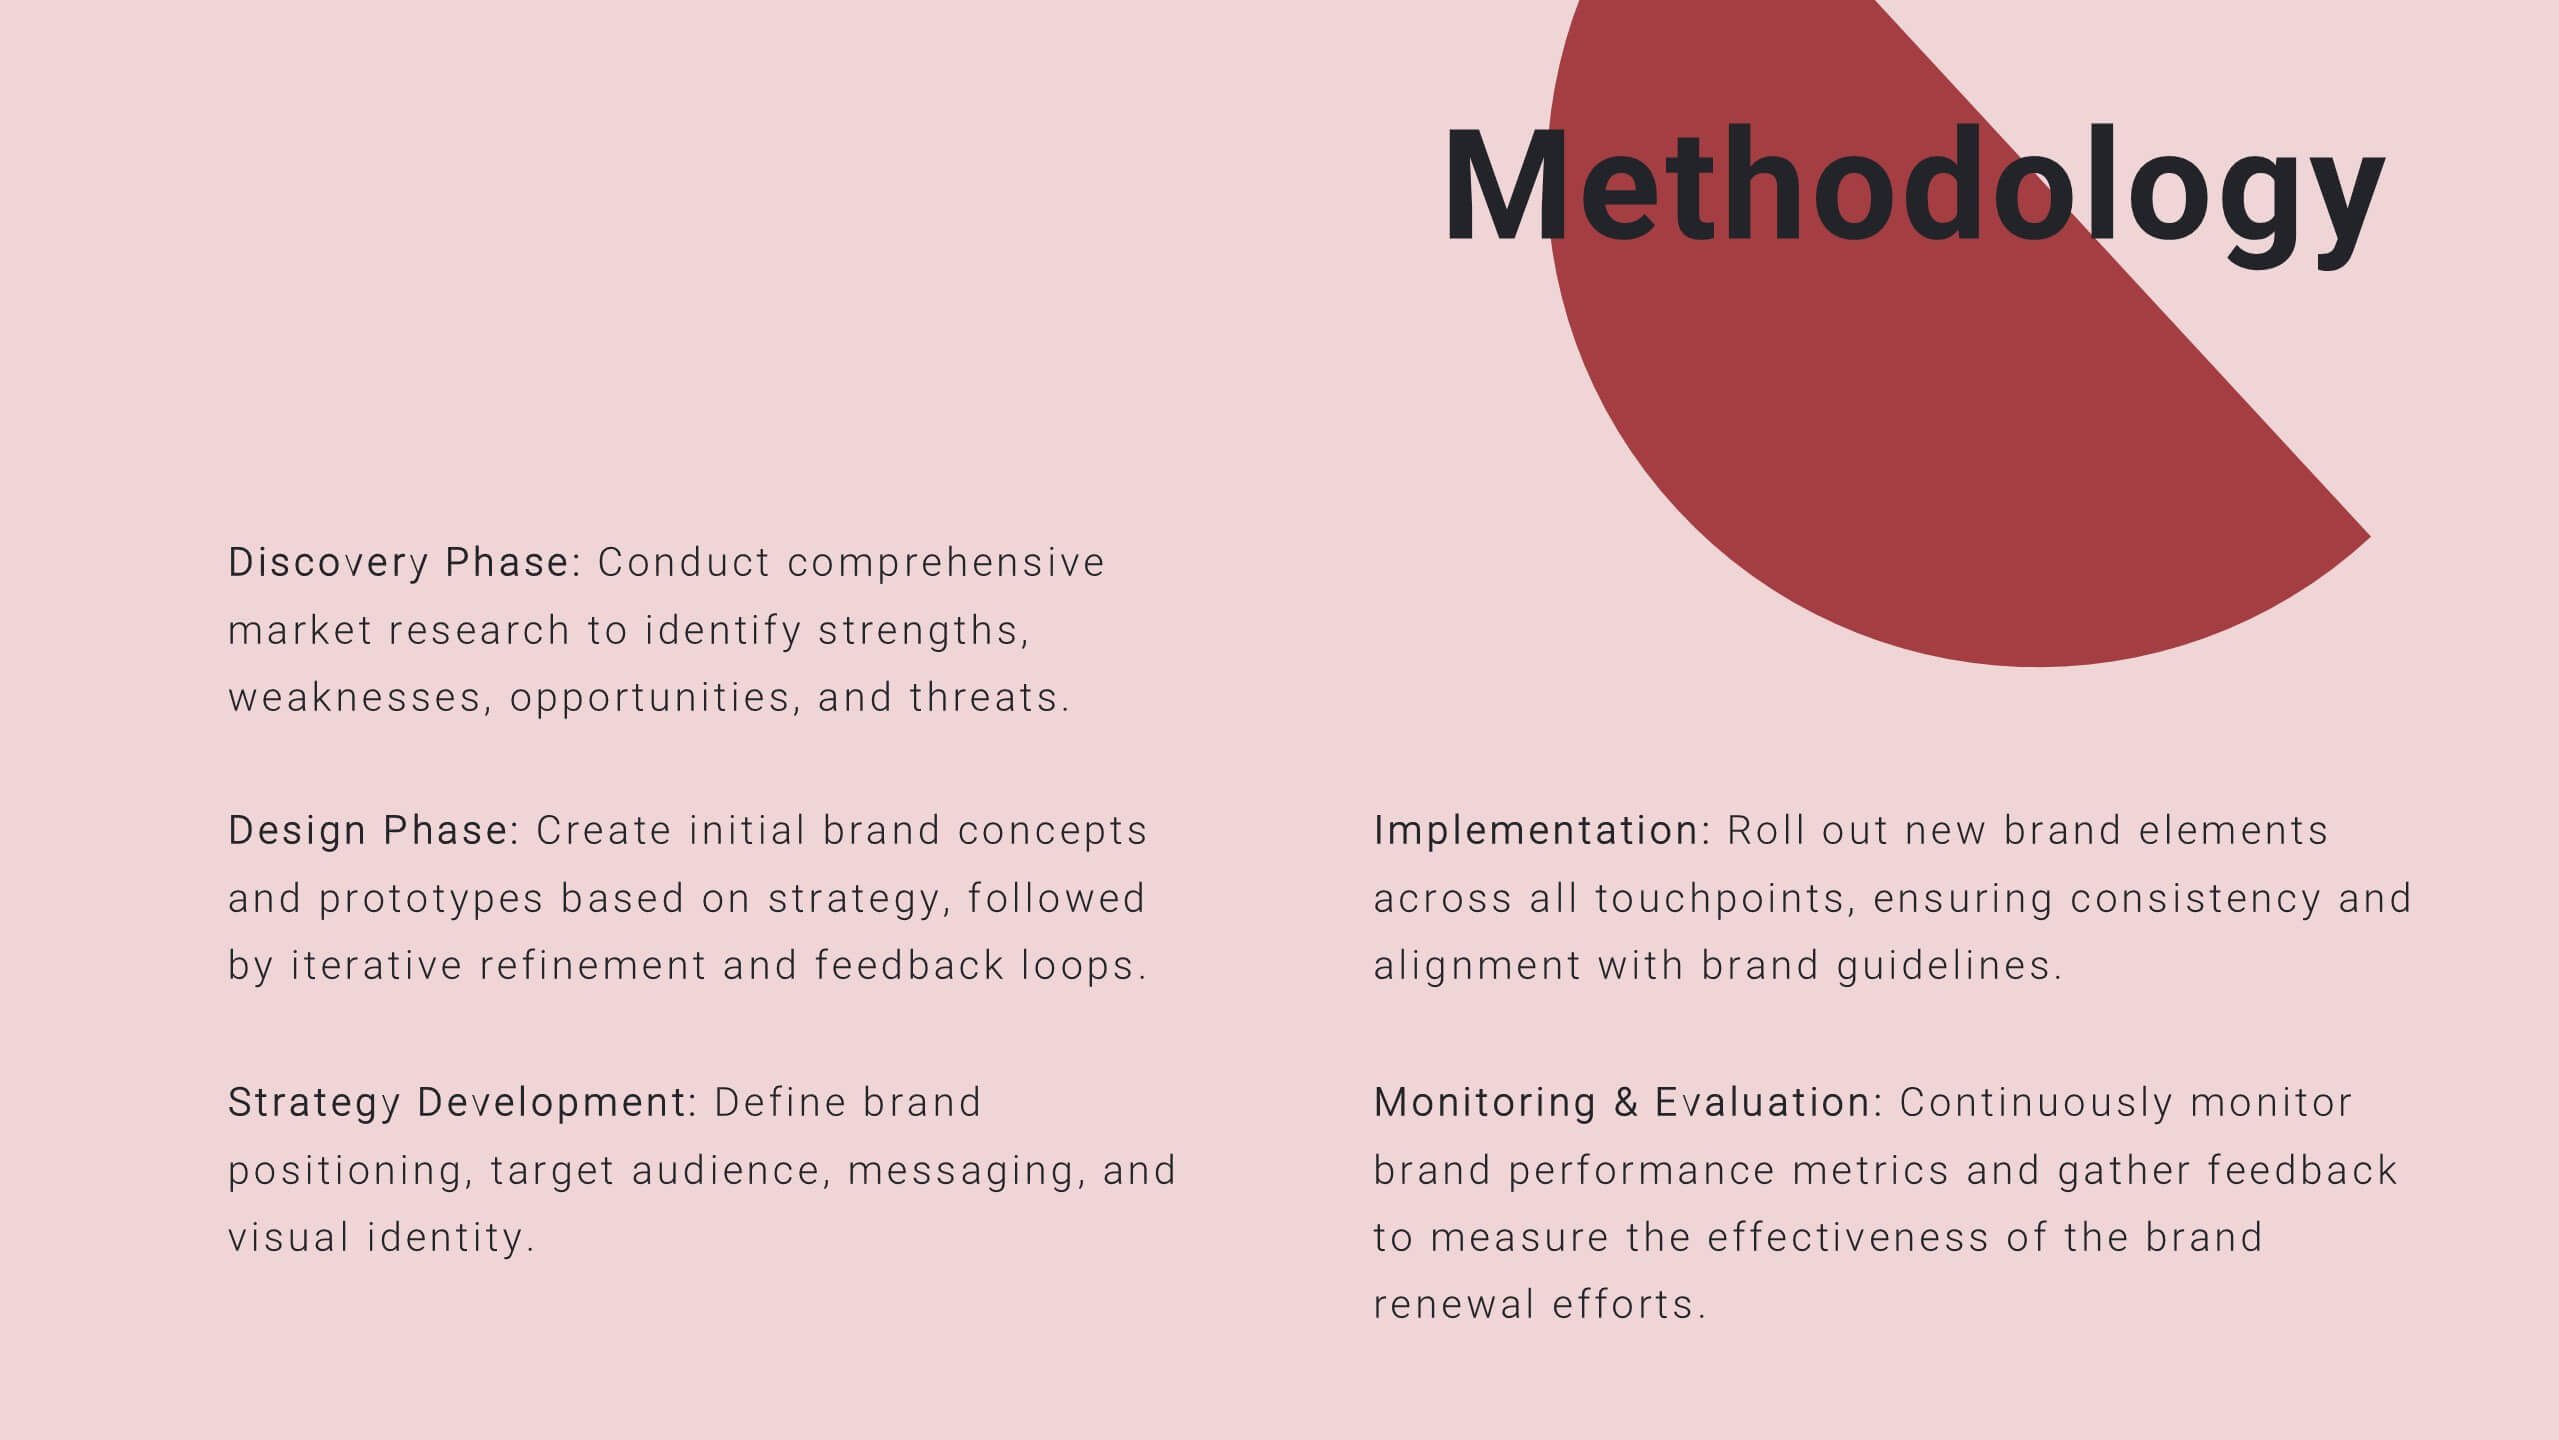
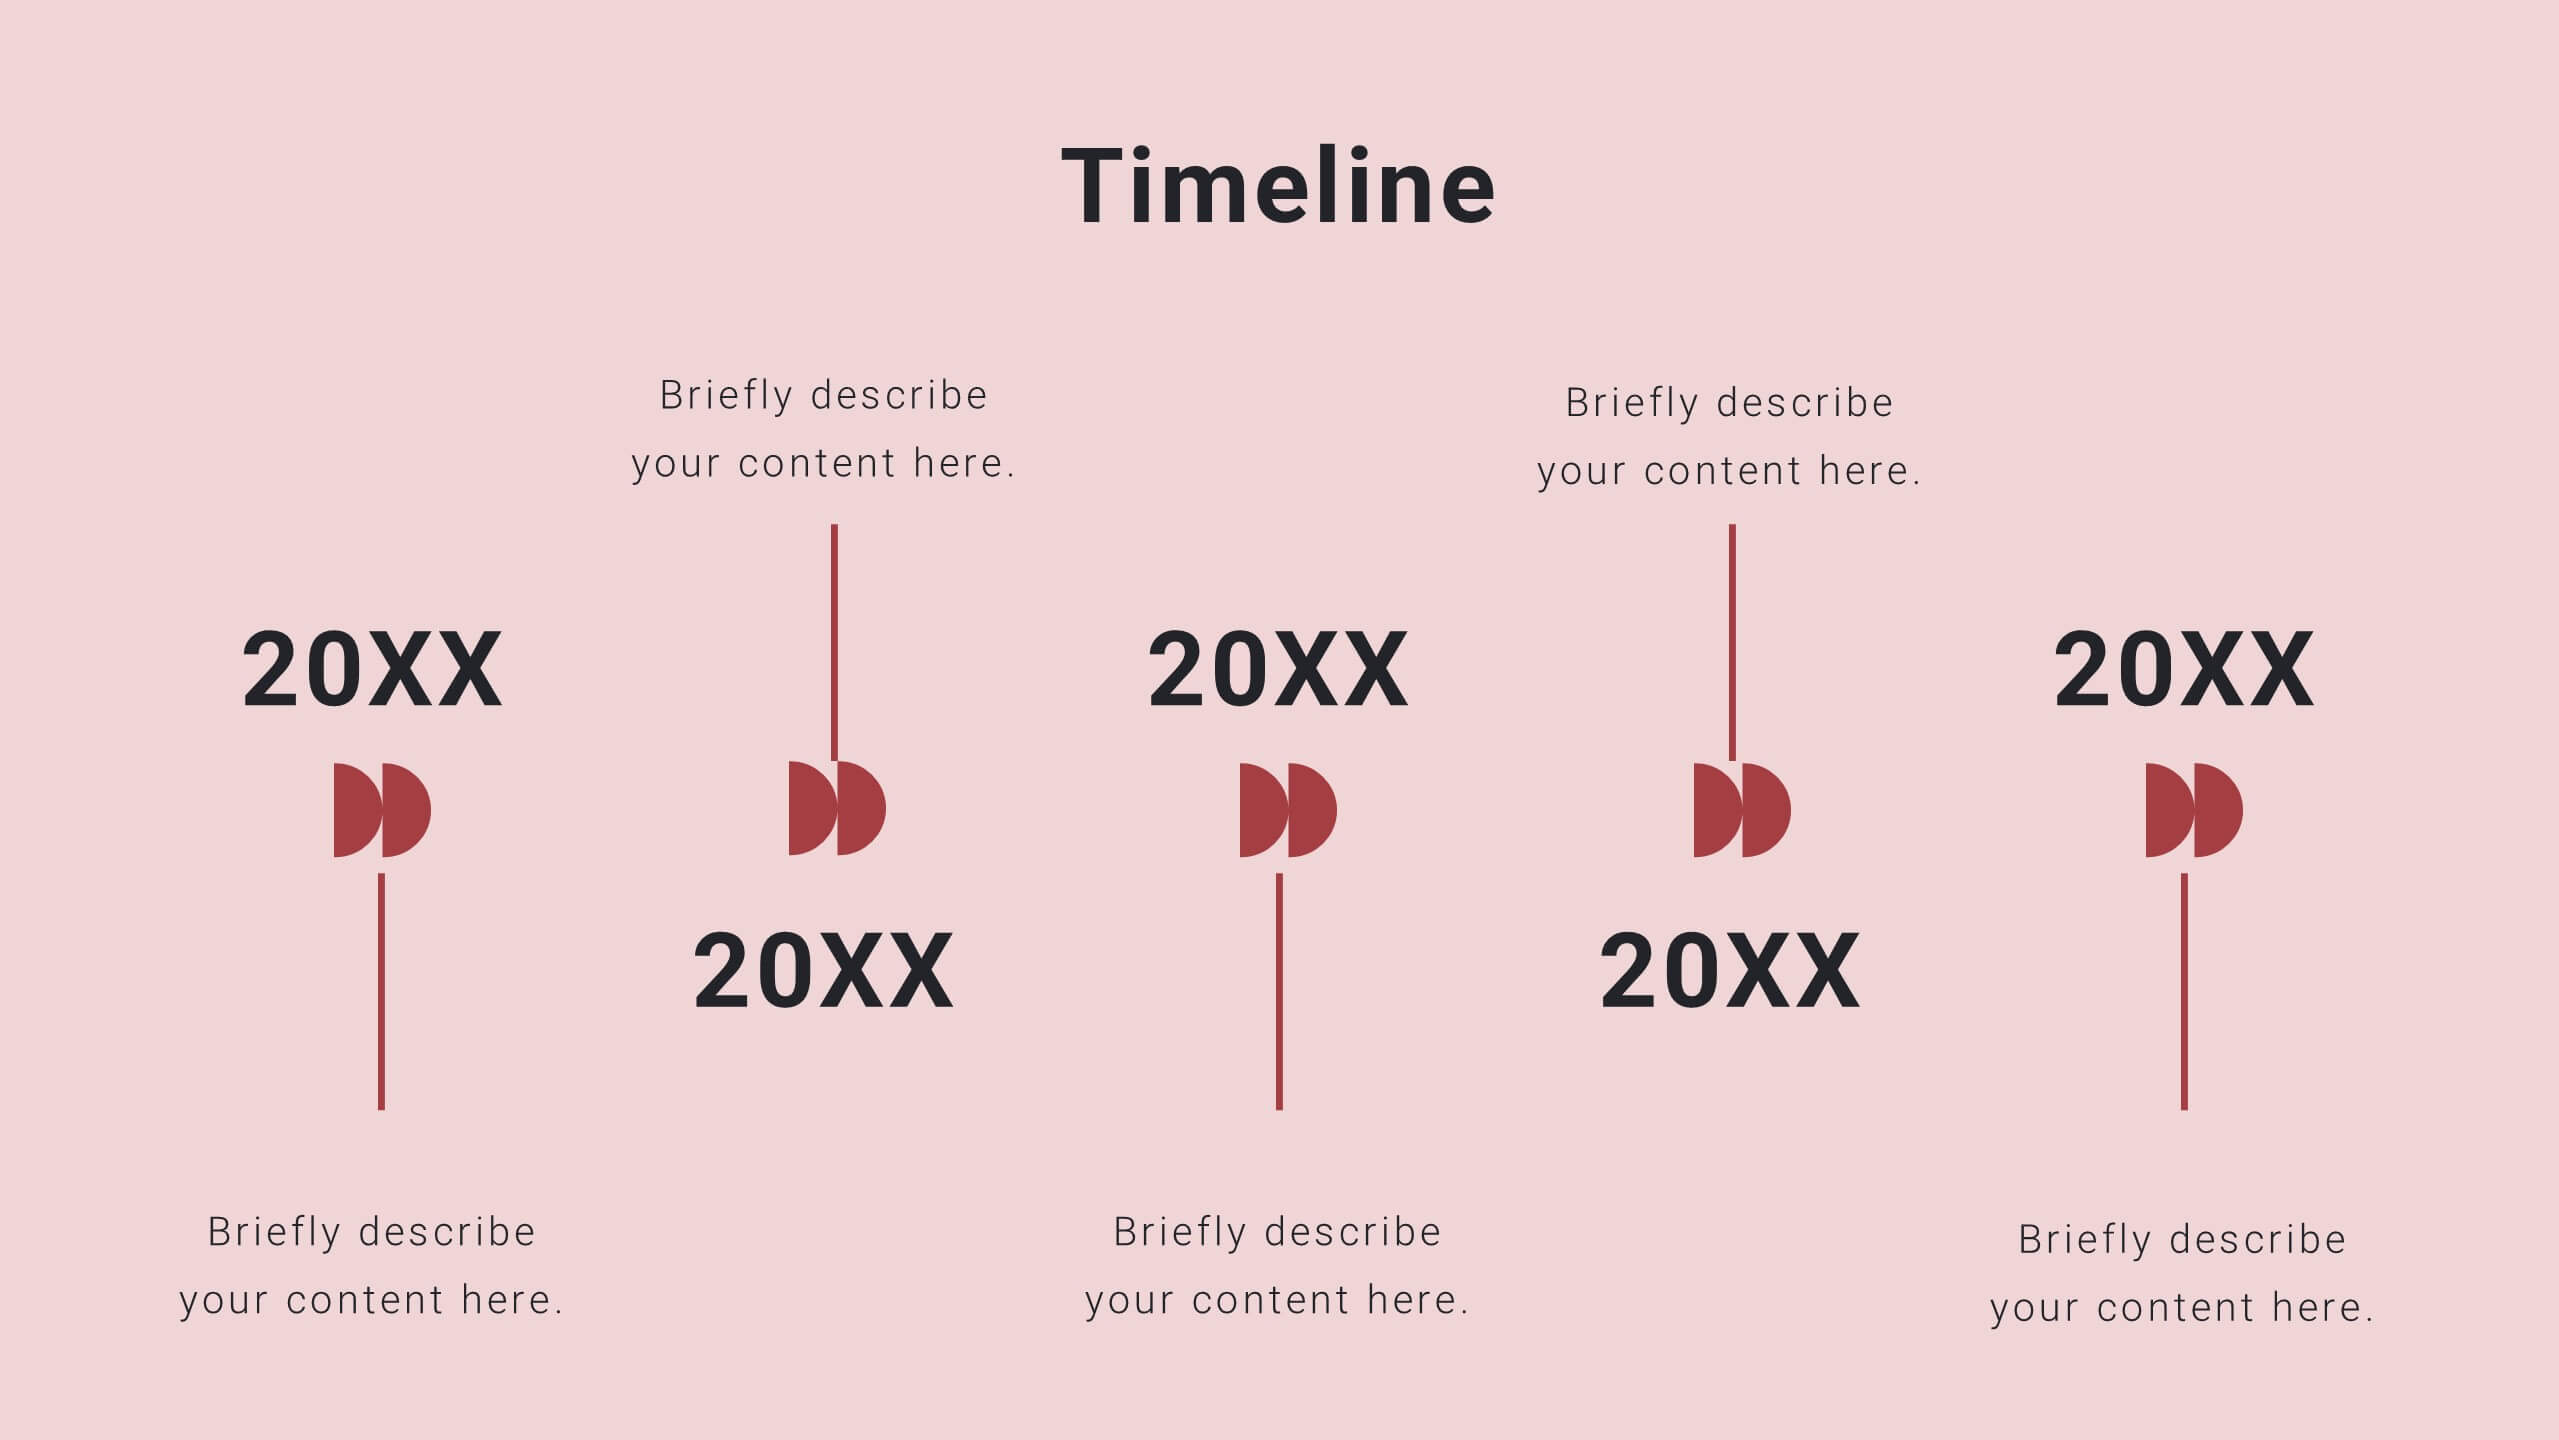
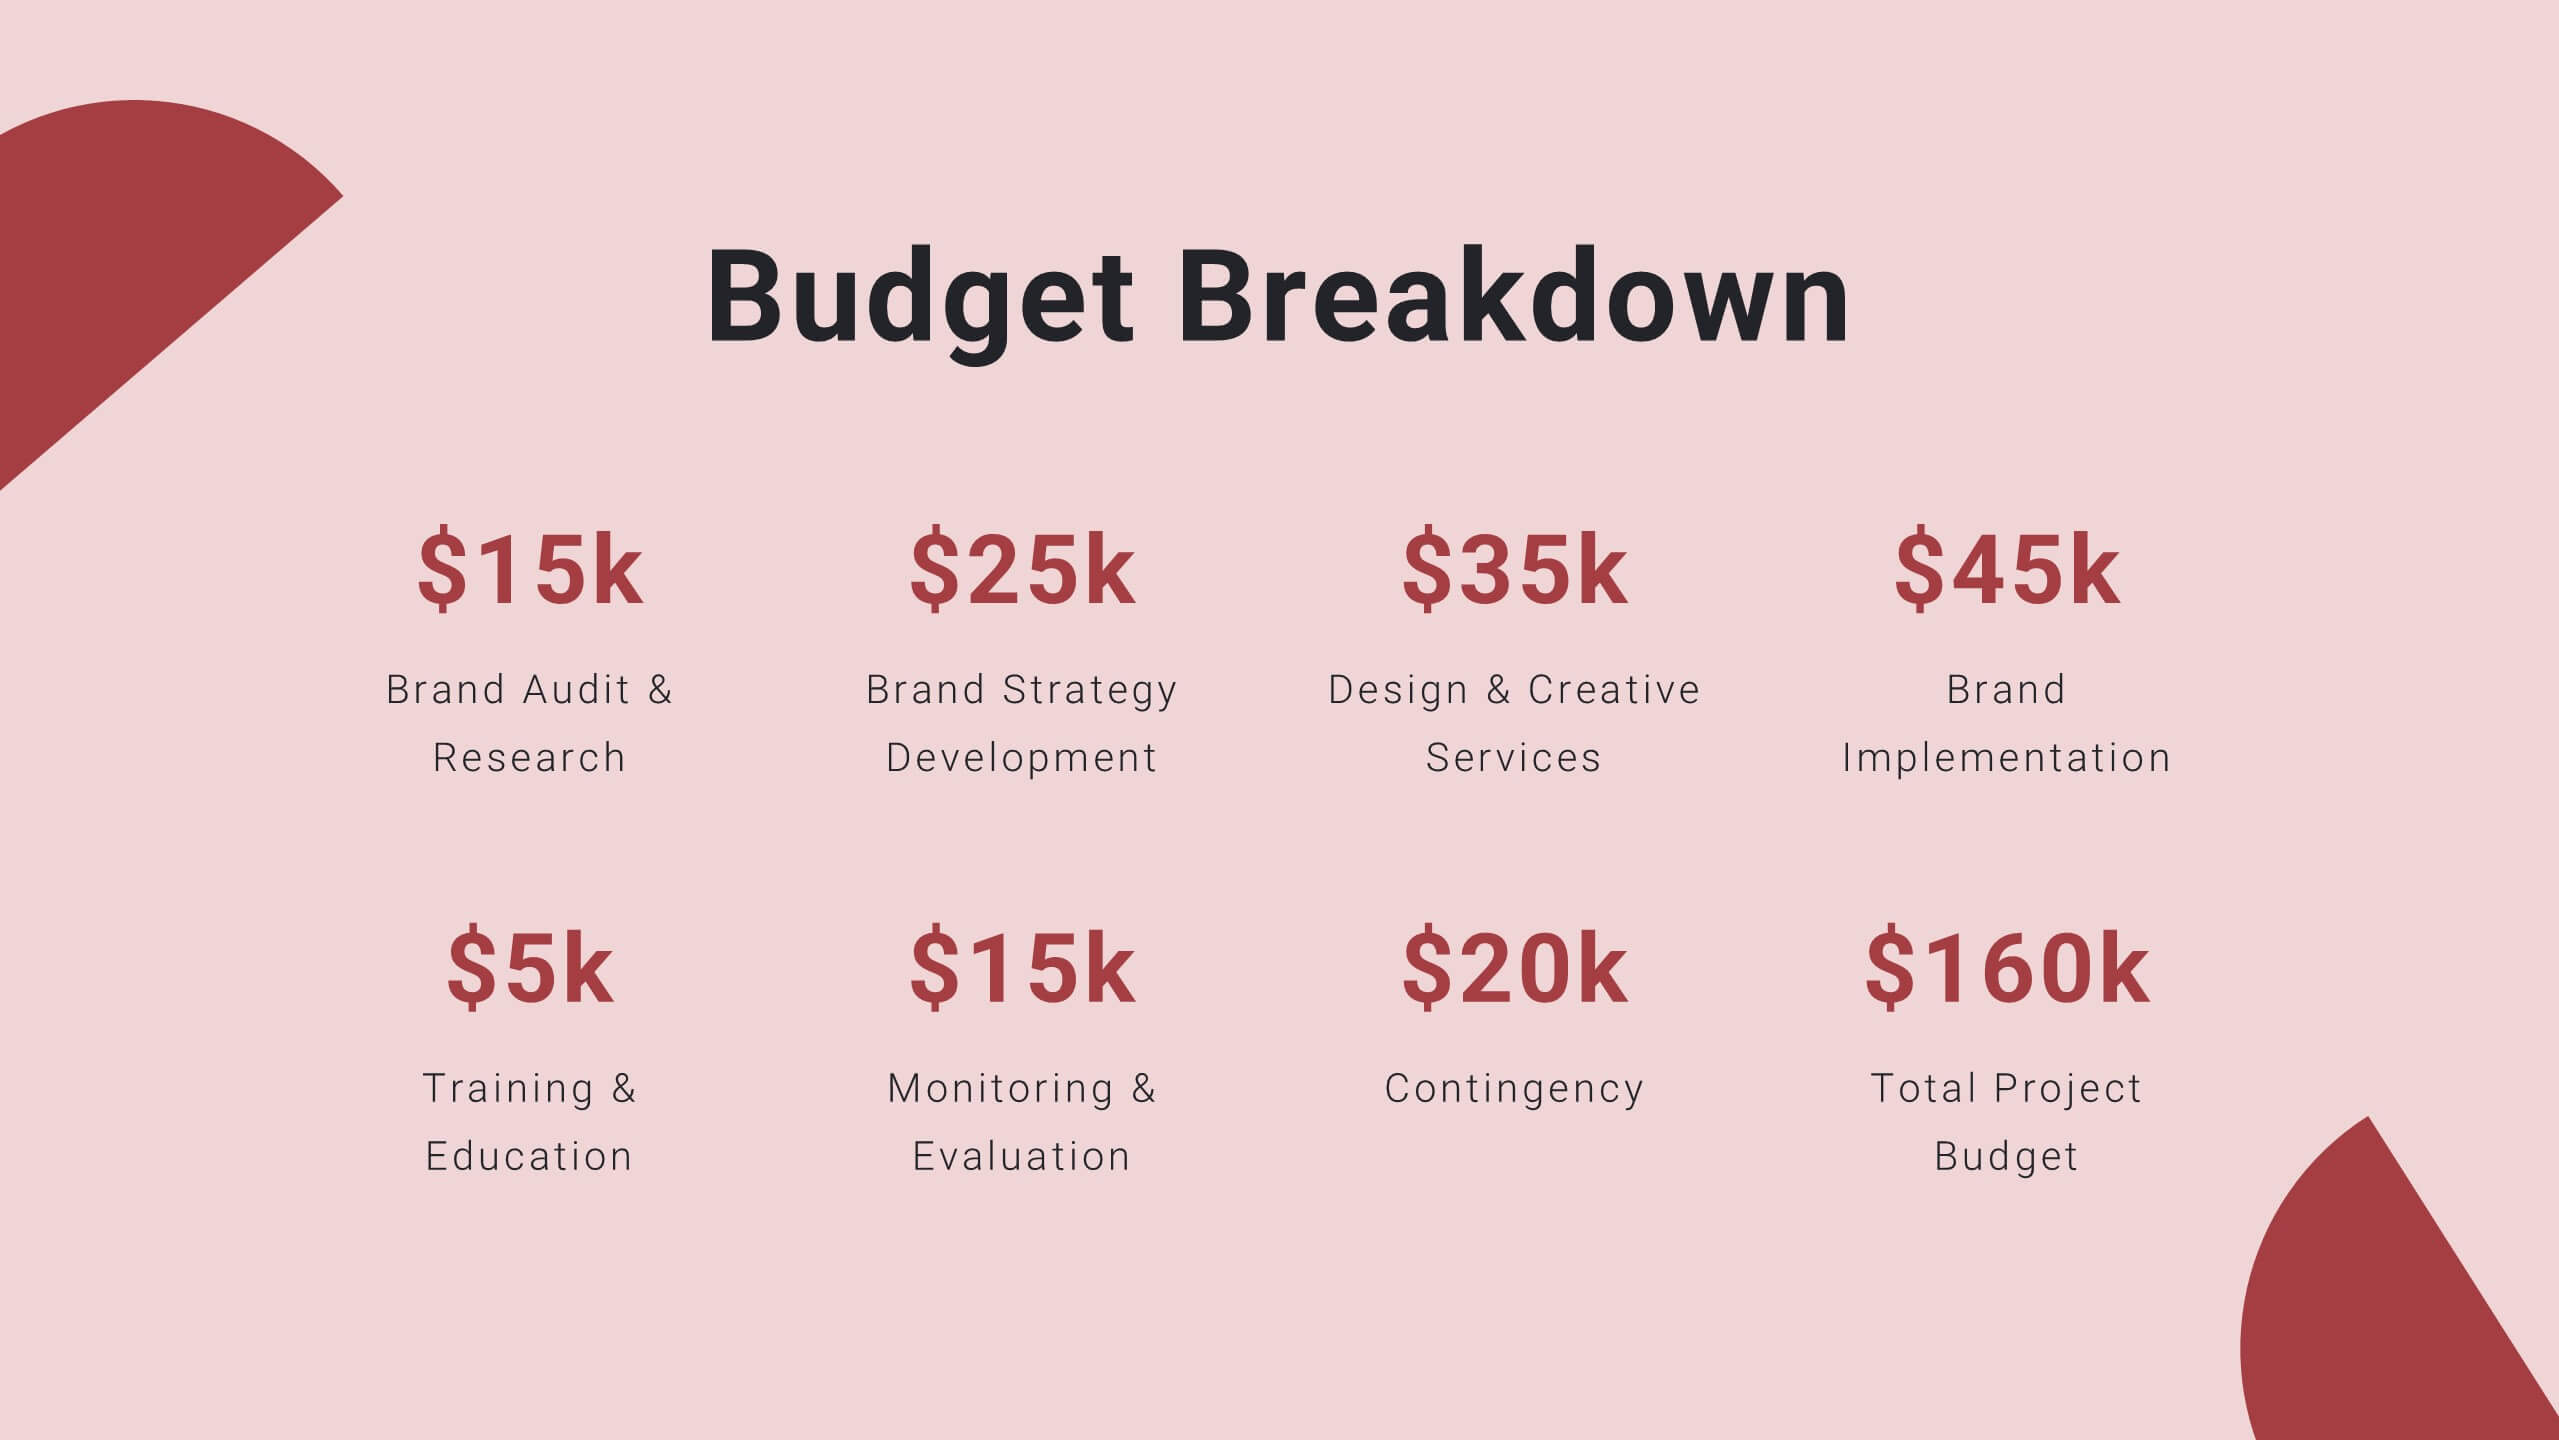
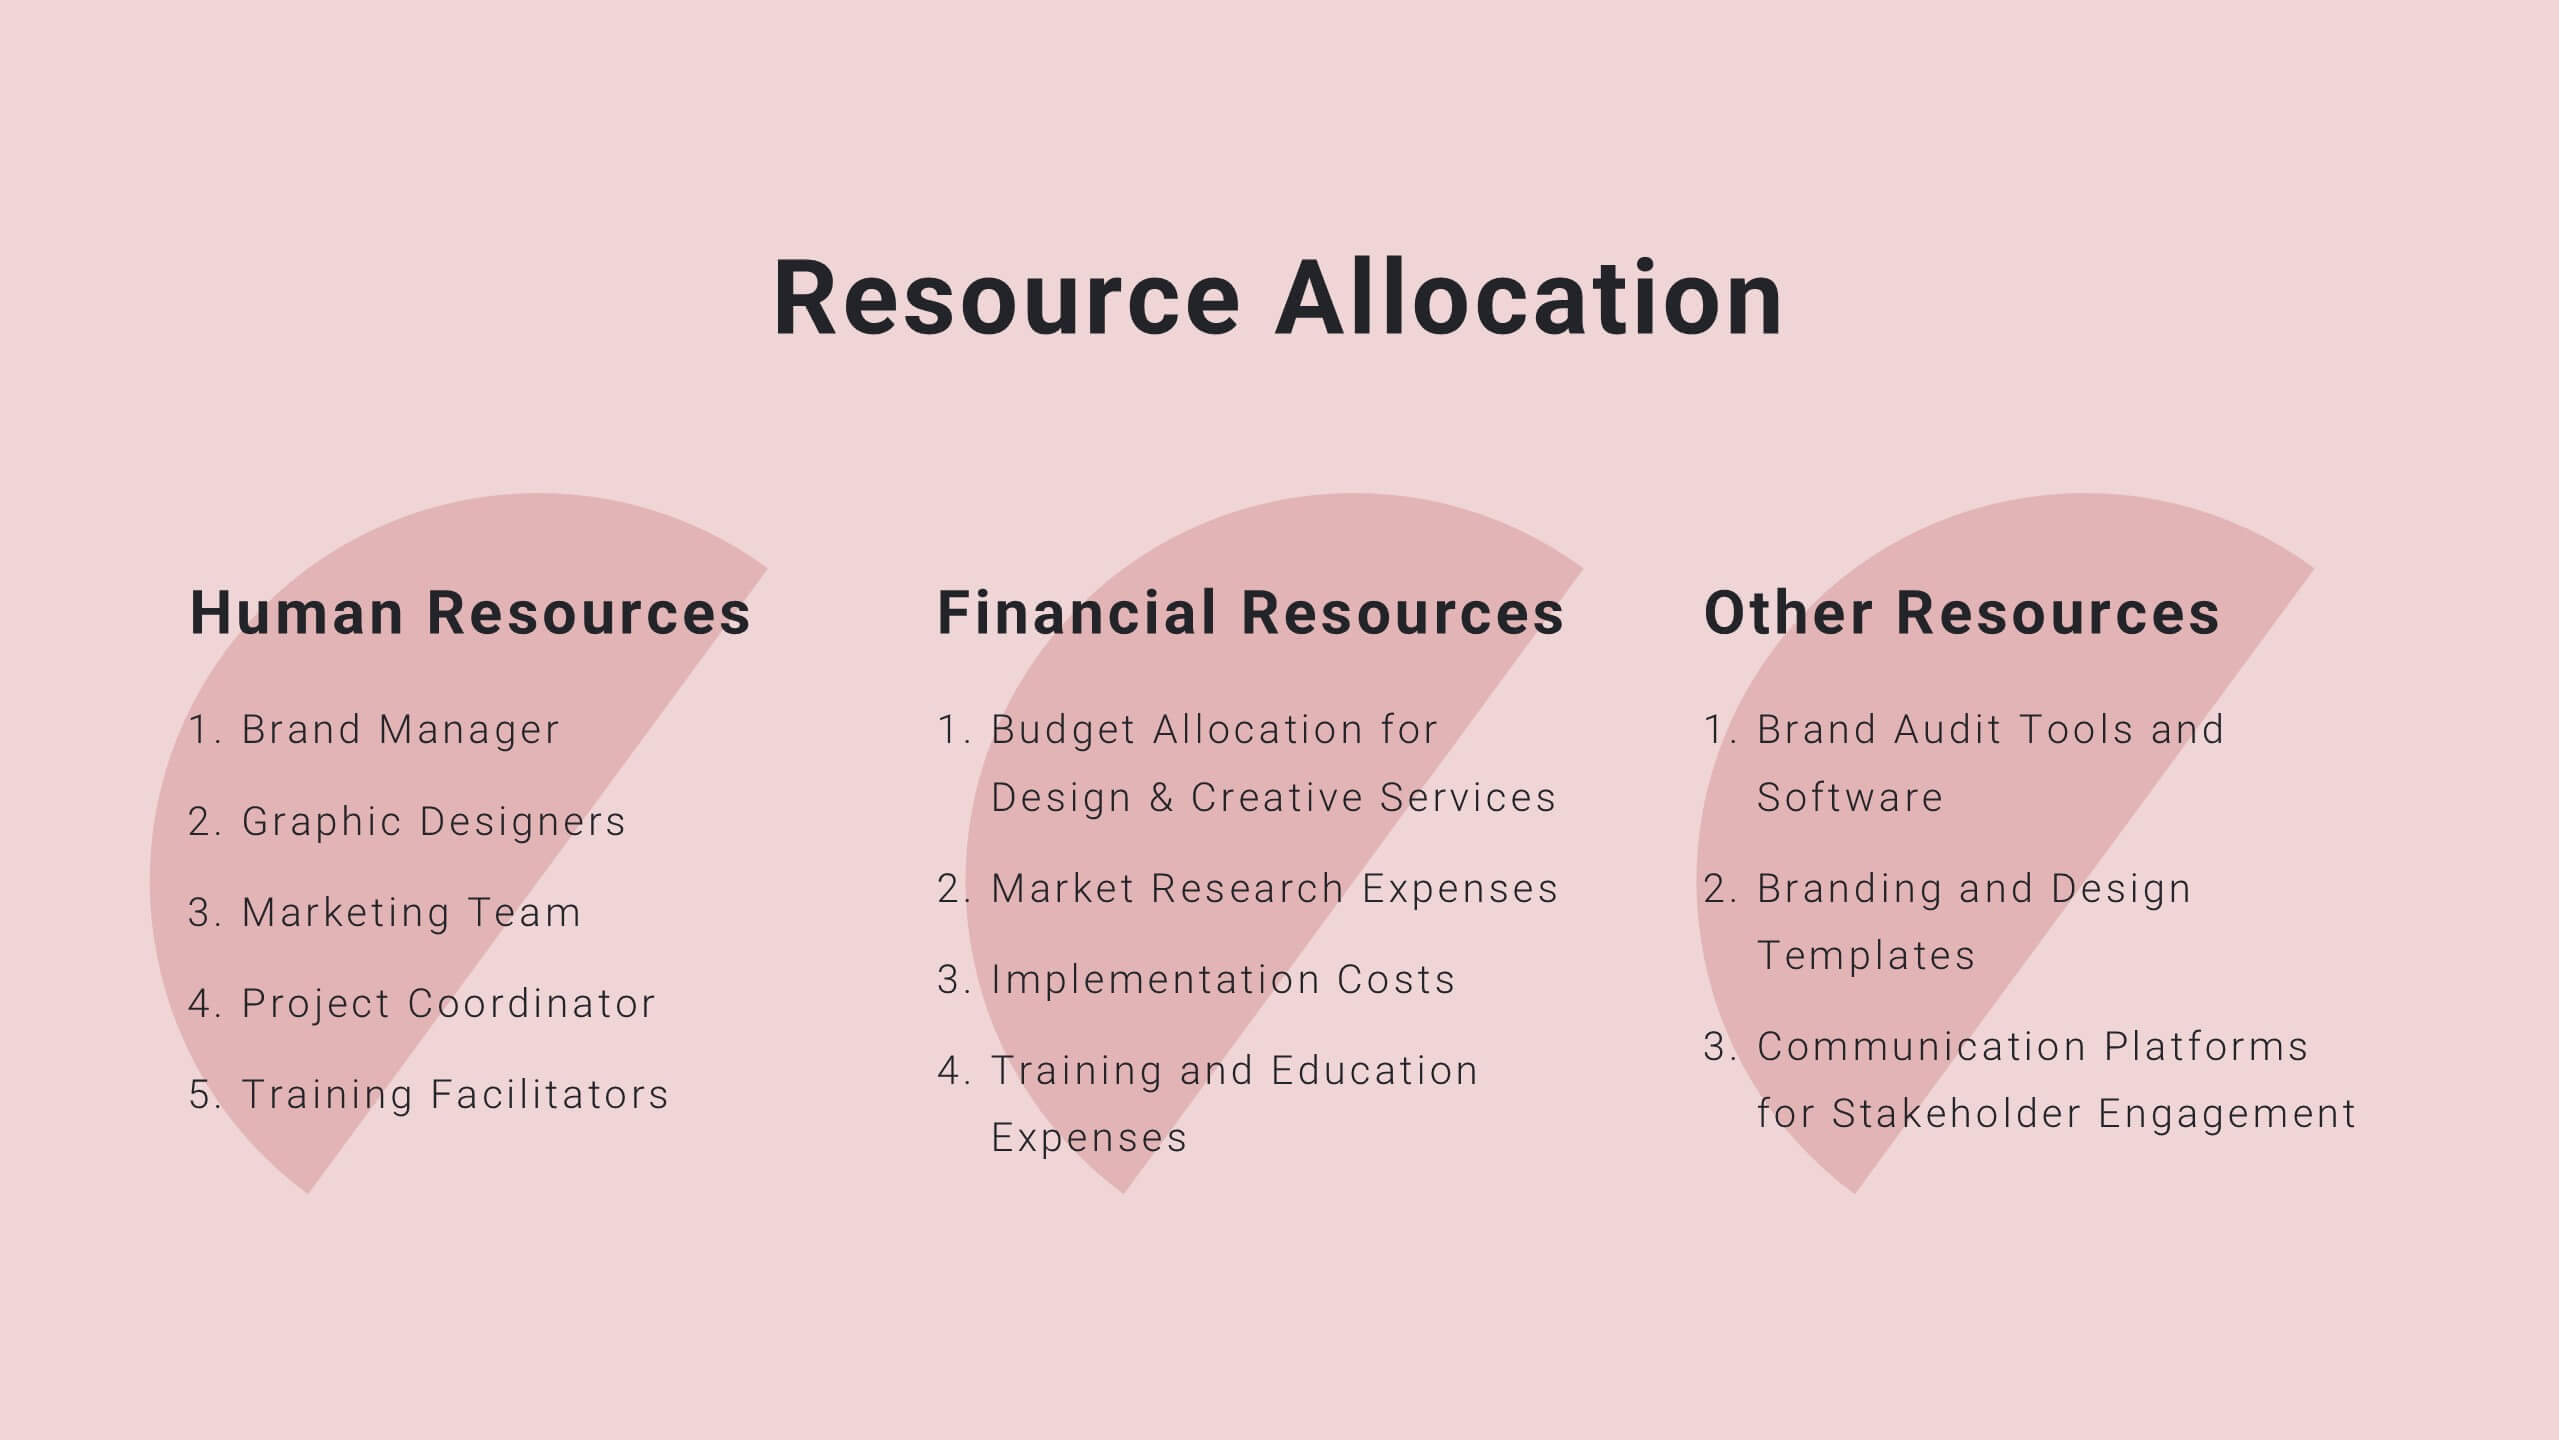
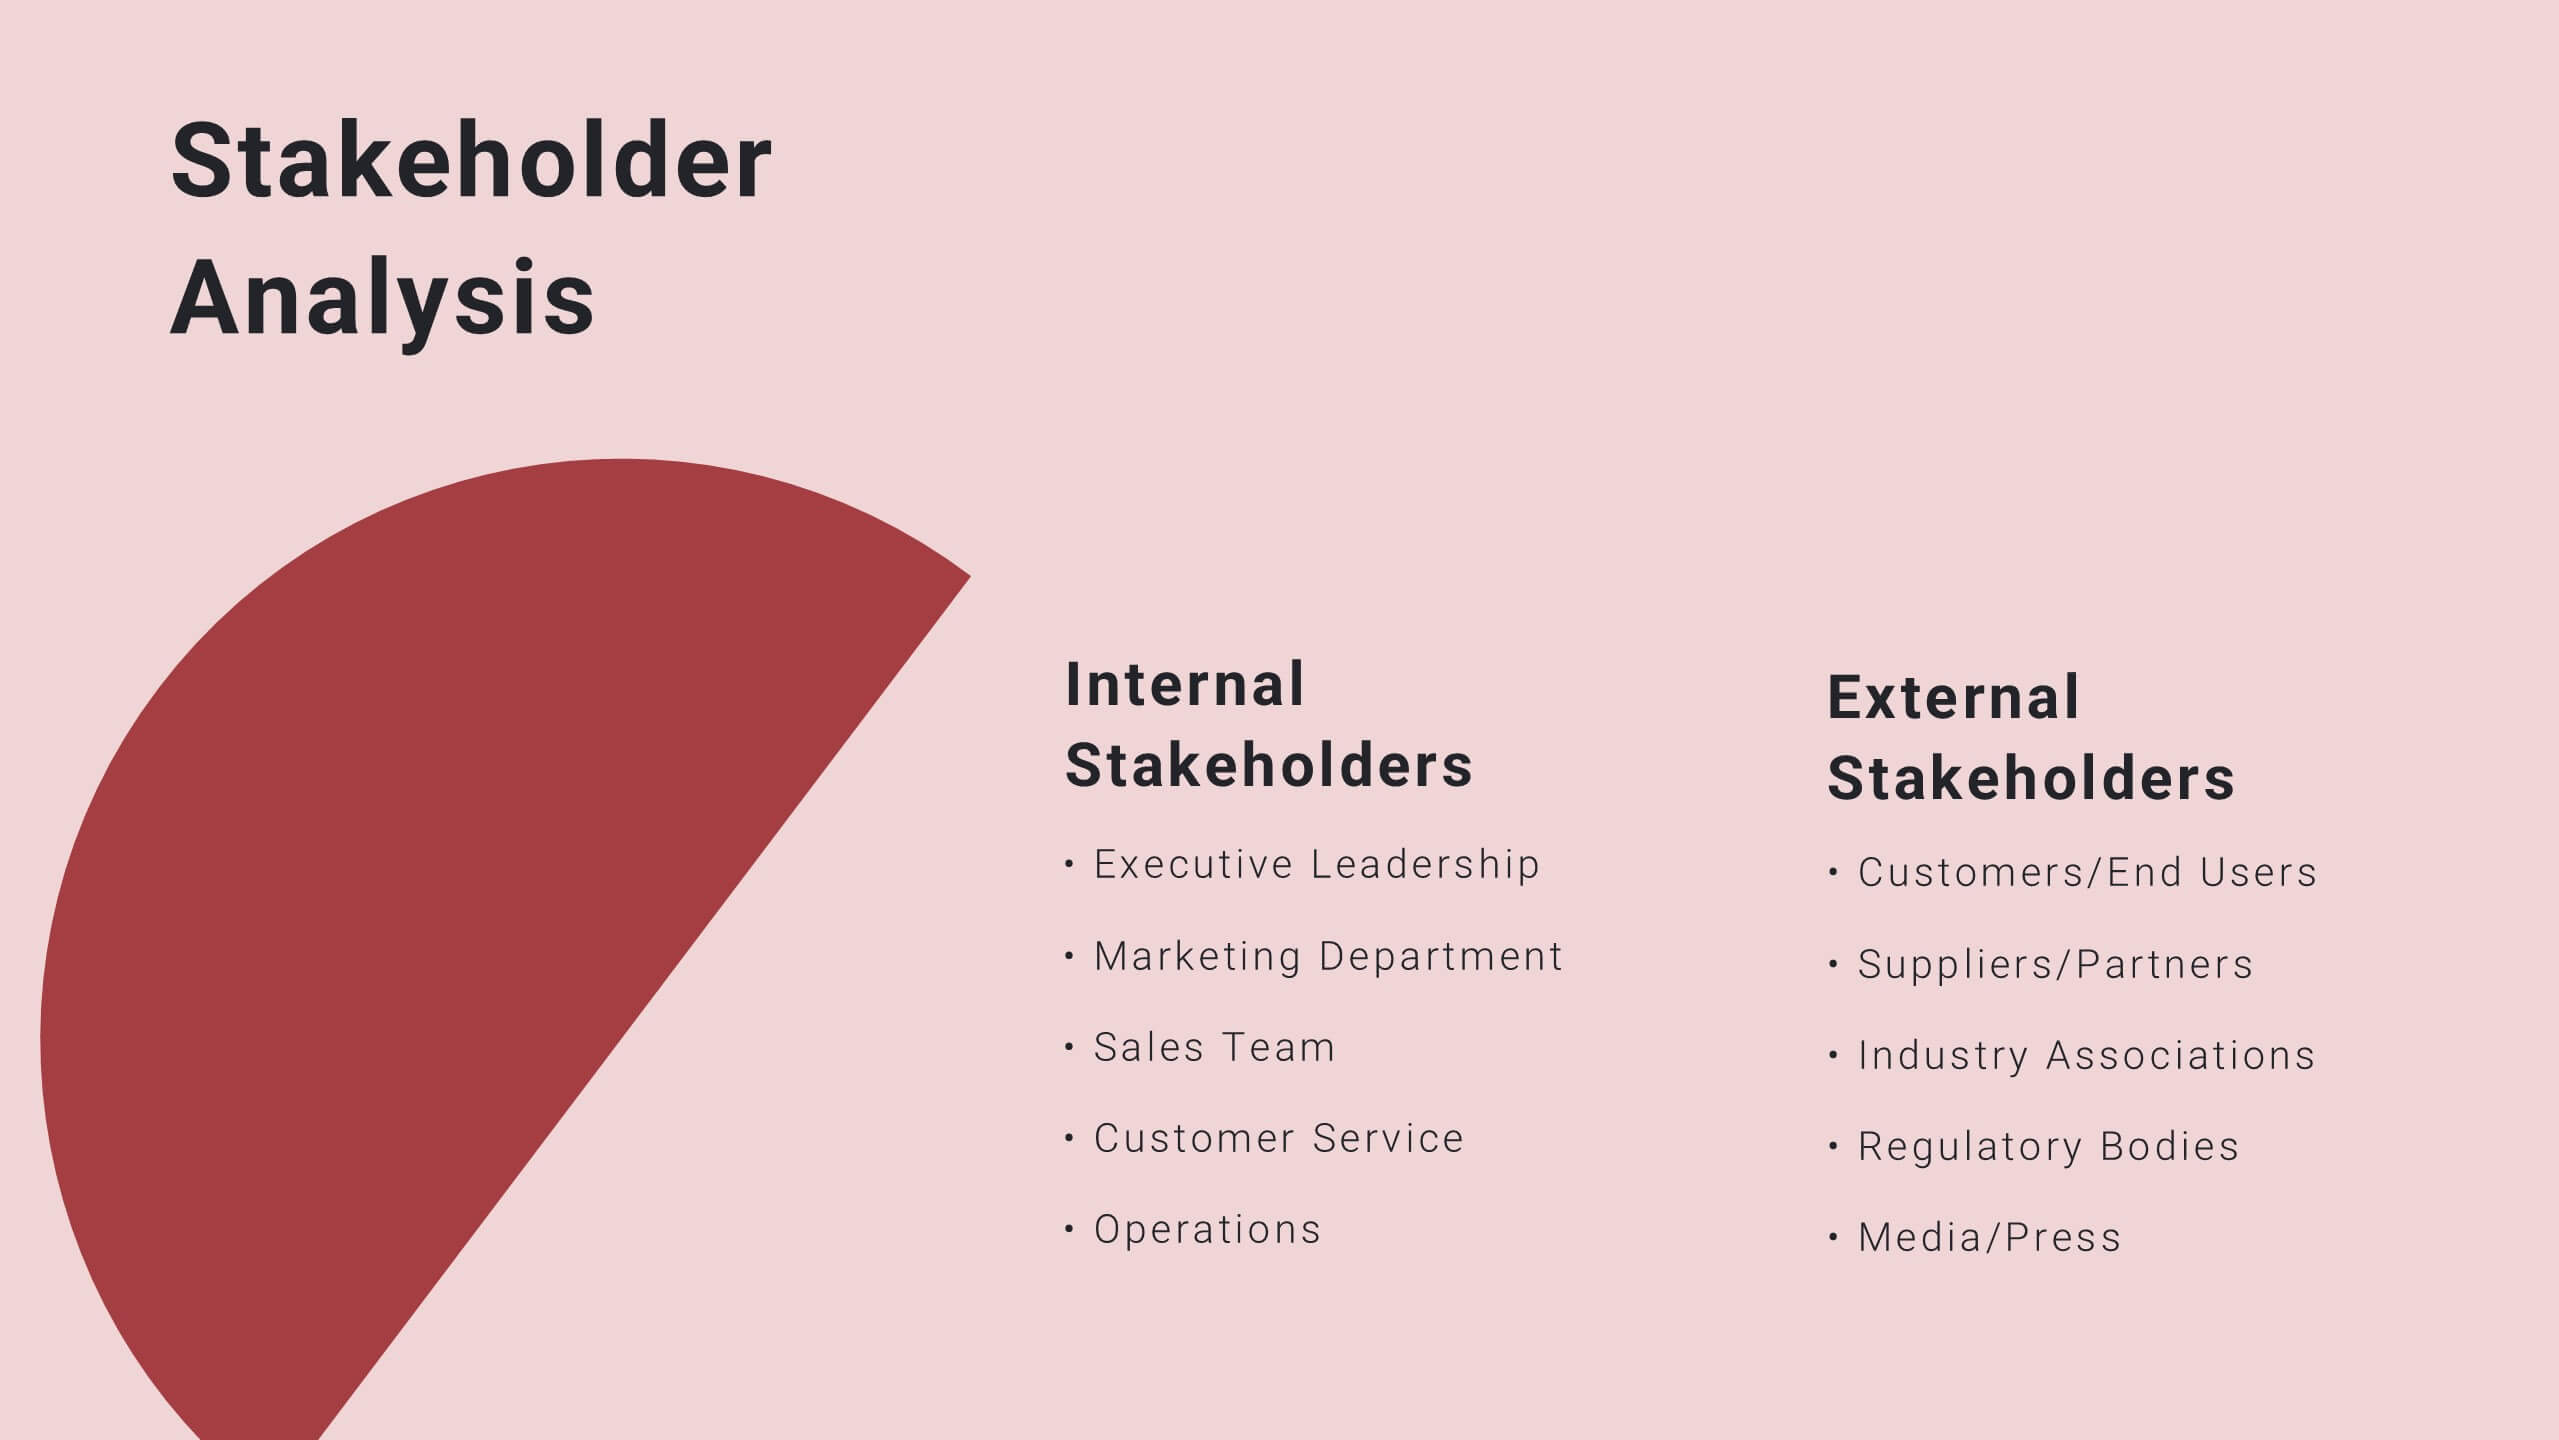
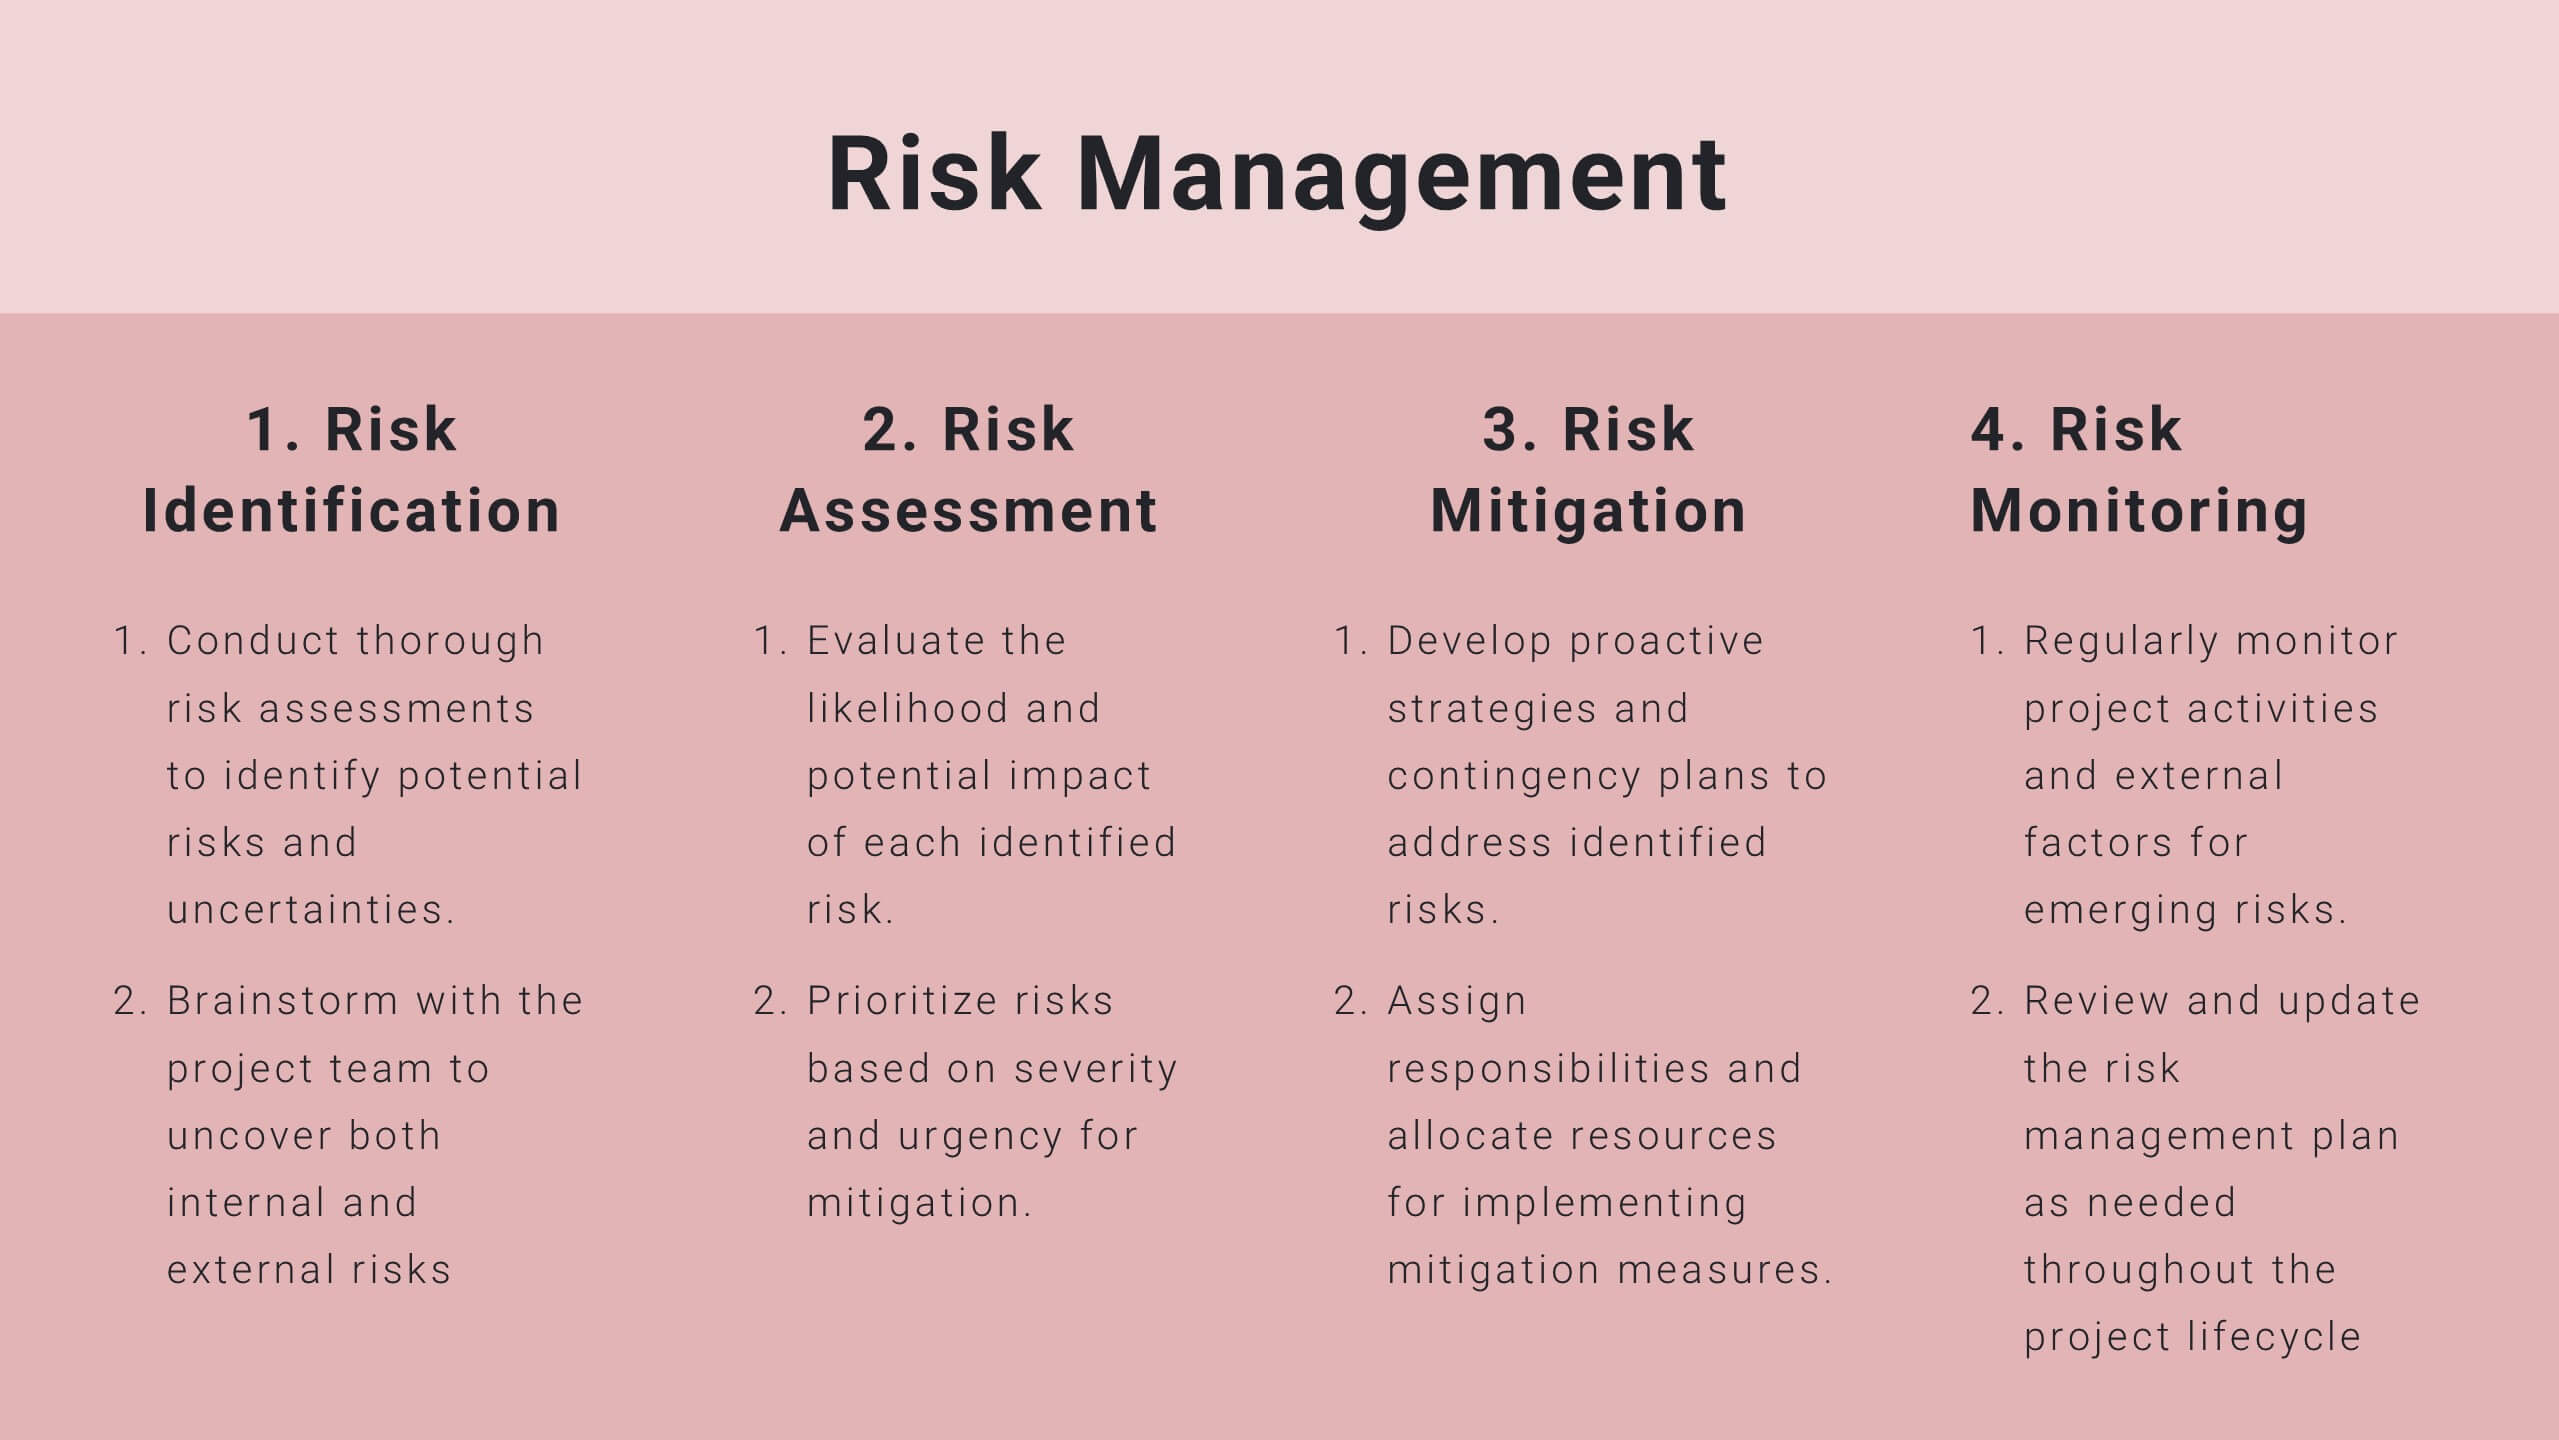
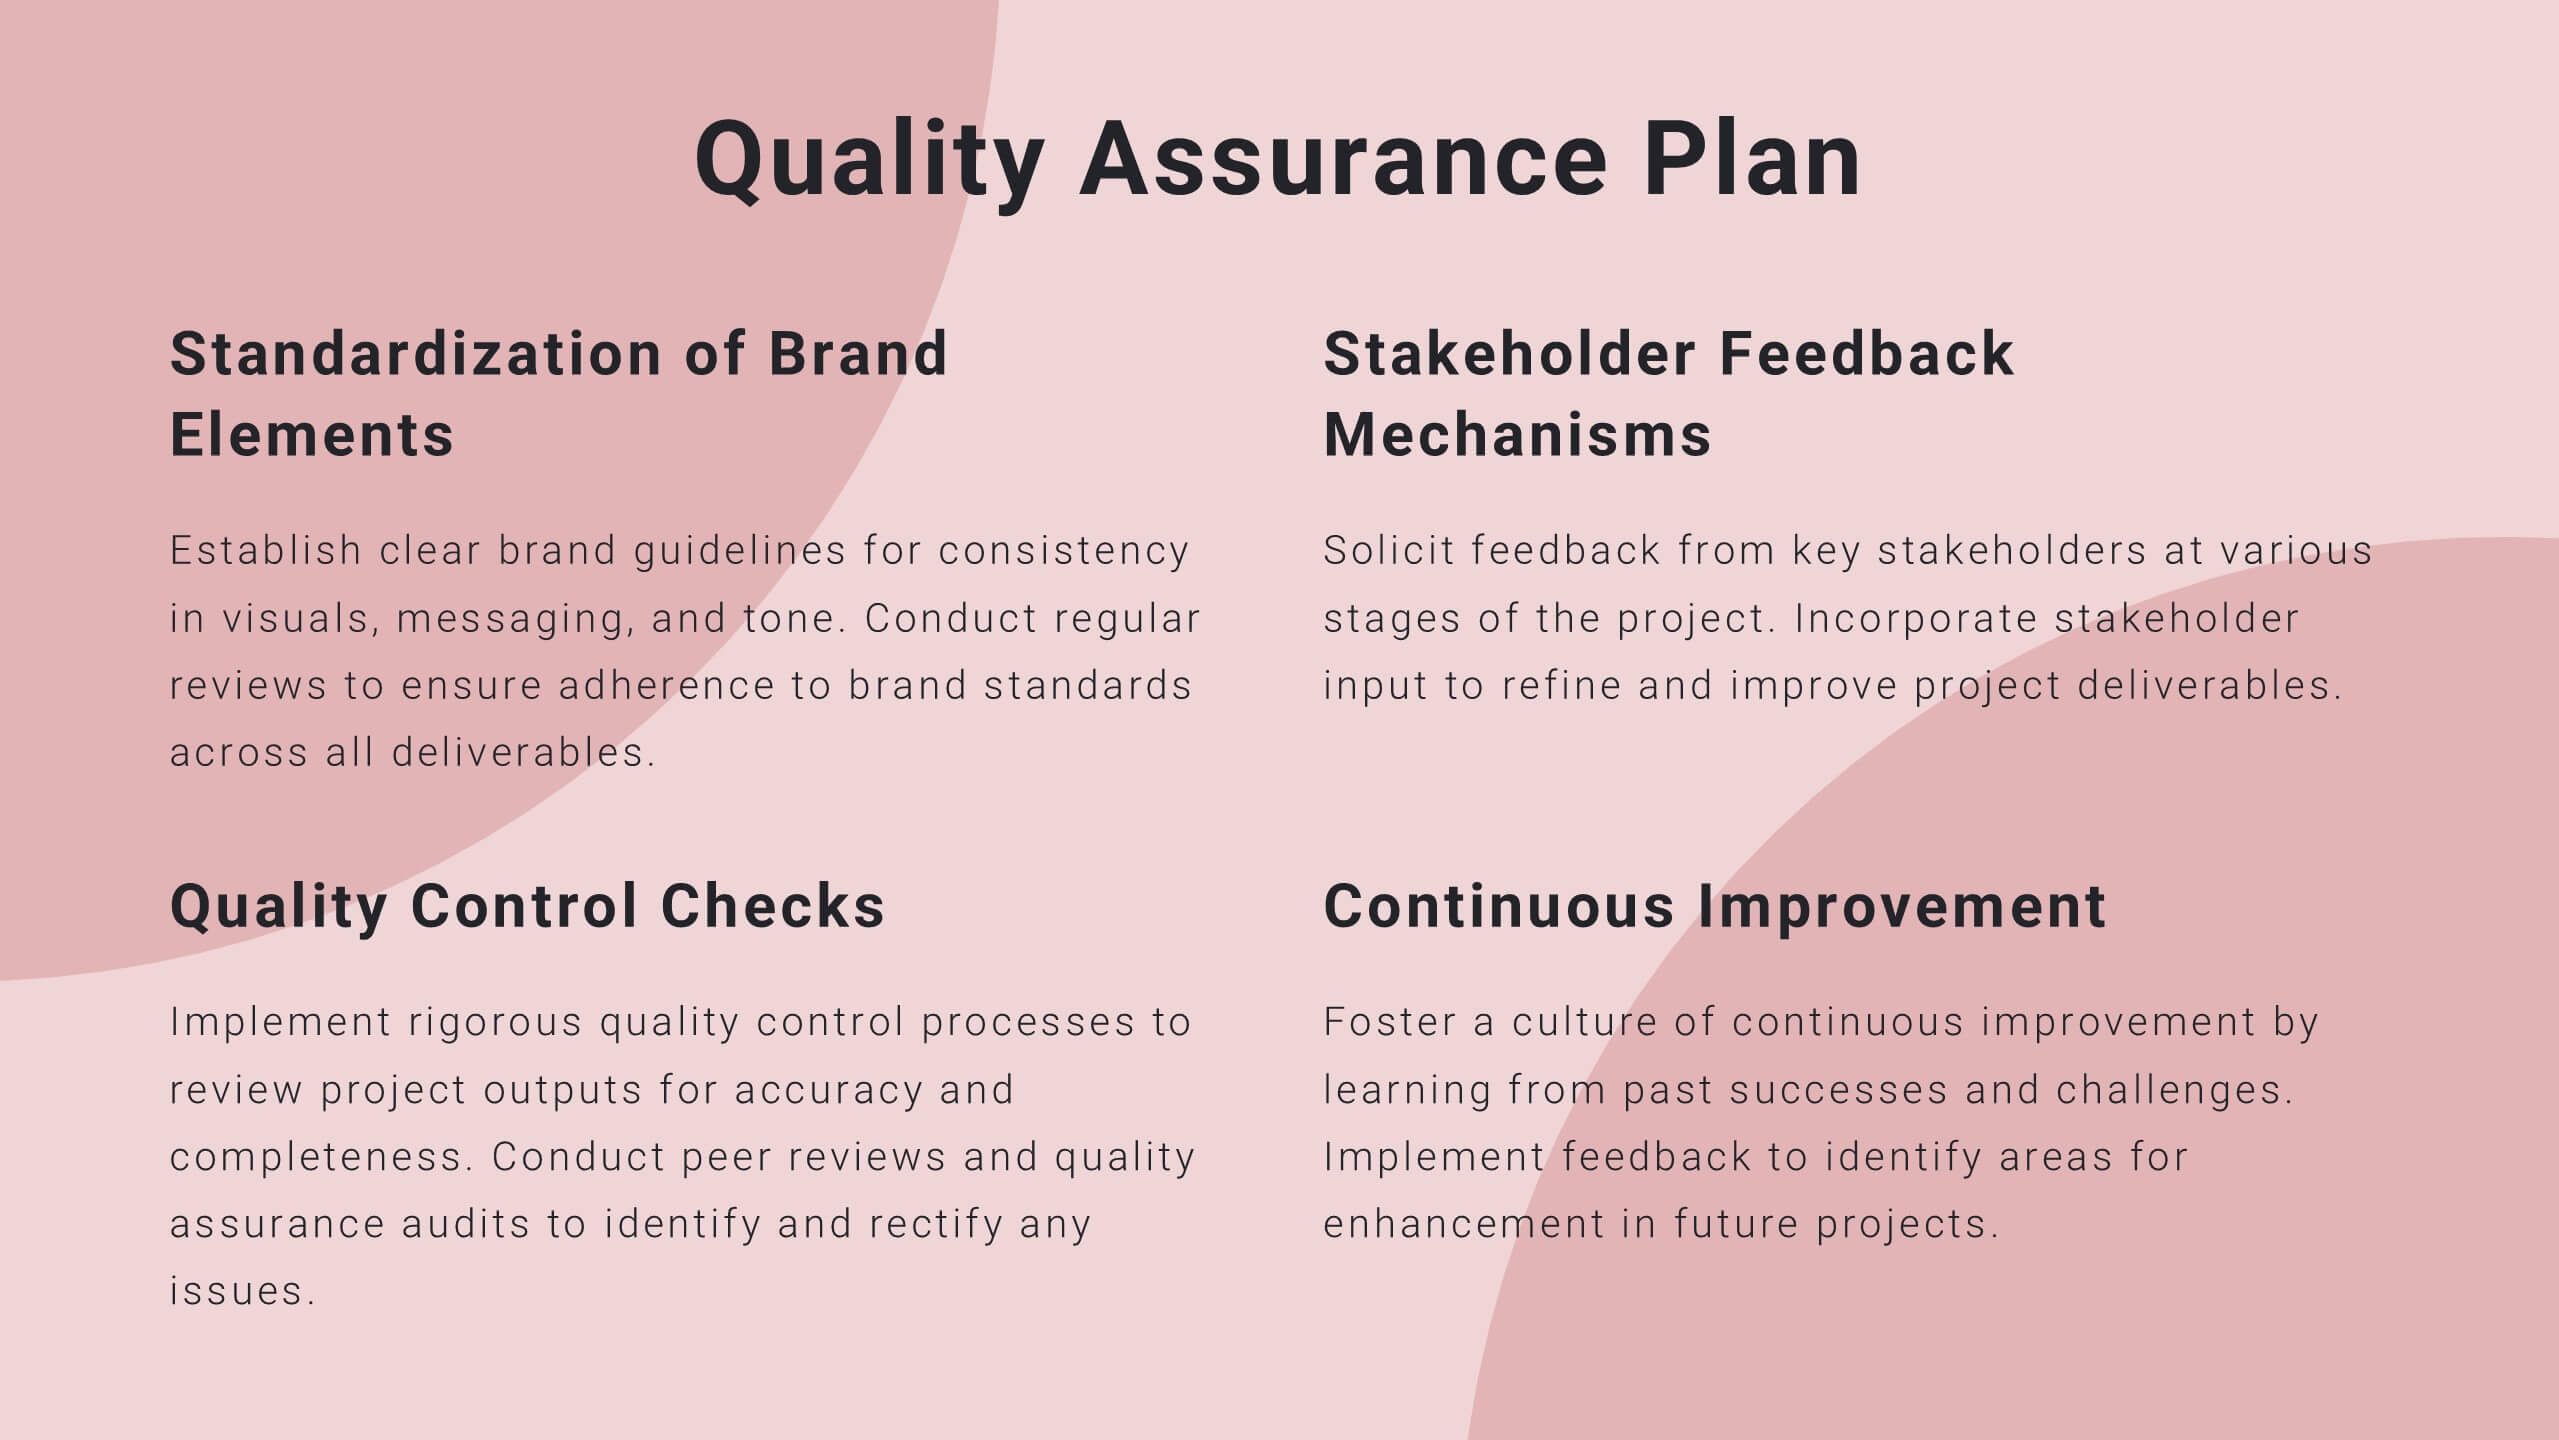
Twilight Project Milestones Report Presentation
Present your project milestones and plan with clarity using this sleek project proposal template! It includes sections for objectives, timelines, budget breakdowns, and risk management. Perfect for organizing and presenting complex project plans, it’s fully customizable and compatible with PowerPoint, Keynote, and Google Slides, ensuring a professional presentation every time.


5 slides
E-Learning and Digital Education Trends Presentation
Stay ahead in the digital learning space with the E-Learning and Digital Education Trends Presentation template. Designed for educators, trainers, and e-learning professionals, this modern and insightful layout highlights key trends, innovative tools, and strategies in online education. With fully customizable elements, you can tailor the slides to your audience’s needs. Compatible with PowerPoint, Keynote, and Google Slides for a seamless presentation experience.


5 slides
Behavioral Psychology Insights Presentation
Dive deep into the human mind with our 'Behavioral Psychology Insights' presentation template. Perfect for educators and professionals, this template offers a structured way to present complex psychological concepts visually. Ideal for delivering engaging presentations on human behavior, it is compatible with PowerPoint, Keynote, and Google Slides.


4 slides
Pillar Strategy Framework Presentation
Turn complex strategies into clear, structured visuals with this elegant infographic design. Ideal for showcasing key principles, organizational foundations, or business frameworks, it helps communicate ideas with precision and balance. Fully customizable and compatible with PowerPoint, Keynote, and Google Slides for effortless editing and professional results.


6 slides
Social Media Advertising Infographic
Boost your online presence with our Social Media Advertising Infographic, compatible with PowerPoint, Google Slides, and Keynote. This dynamic template is crafted for marketers and businesses to showcase their social media strategies and ad campaigns. It includes diverse slide layouts to detail different aspects such as audience targeting, platform choice, content planning, and budget allocation. Each slide provides a clear structure to display comparative analyses, timelines, and the impact of your social media efforts. It's an ideal tool for presenting to teams, clients, or during workshops to explain the intricacies of social media marketing effectively.