


Features
- 5 Unique slides
- Fully editable and easy to edit in Microsoft Powerpoint, Keynote and Google Slides
- 16:9 widescreen layout
- Clean and professional designs
- Export to JPG, PDF or send by email


Do you have any questions?
Recommend


7 slides
Industrial Safety Infographic
Industrial safety, also known as occupational safety, pertains to the management of processes and conditions within industrial settings to ensure the safety, health, and well-being of workers and the general public. This impactful infographic template encapsulates the essentials for fostering a secure and hazard-free industrial environment. Compatible with Powerpoint, Keynote, and Google Slides. The customizable set of icons represents emergency response actions, underlining the need for rapid and efficient responses in critical situations. Build a foundation of safety that fosters a secure and thriving work environment.


20 slides
Elysium Product Launch Presentation
Launch your new skincare product with this stylish presentation template. Highlight key features, target market, pain points, and unique selling propositions. Perfect for marketing strategies and production processes. Fully compatible with PowerPoint, Keynote, and Google Slides.


10 slides
4-Quadrant Responsibility Chart Presentation
Bring your message to life with a slide that feels bold, modern, and instantly engaging. This presentation helps you outline four key responsibilities or categories in a clean quadrant layout, making complex information easy to follow and visually compelling. It’s perfect for strategy, workflow, or team-based insights. Fully compatible with PowerPoint, Keynote, and Google Slides.


7 slides
Business Concept Mind Map Presentation
Visualize strategic thinking with the Business Concept Mind Map Presentation. This clear, central-diagram layout helps organize six core ideas around a business theme, making complex concepts easy to grasp. Ideal for planning, brainstorming, or presentations. Fully editable and compatible with PowerPoint, Keynote, and Google Slides for maximum flexibility.


8 slides
Credit Card Comparison Presentation
The "Credit Card Comparison" presentation template visualizes the differences between credit and debit card options in a straightforward and engaging way. Featuring side-by-side comparisons, the template allows for easy insertion of key points such as fees, benefits, and suitability for different user profiles, making it an excellent tool for financial educators, advisors, and banking professionals. The template’s design ensures that the content is accessible and relatable, making complex financial concepts easier to grasp for the audience. This makes it ideal for presentations aimed at educating consumers about financial choices or for internal training within financial institutions.


5 slides
Online Video Games Infographics
Dive into the digital realm with our online video games infographics template, tailored in striking shades of purple, blue, pink, and black that echo the electric ambiance of the gaming world. This dynamic ensemble, perfect for game developers, and gaming communities, brings to life the universe of online gaming. Compatible with Powerpoint, Keynote, and Google Slides. It features creative graphics and gaming icons, capturing everything from player statistics to game mechanics. Whether you're spotlighting trends or unveiling a revolutionary game, this template levels up your presentation, engaging your audience right from the start screen.


7 slides
Brain Balance Infographic
Introducing our brain infographic template, it's a colorful, engaging and professional brain diagram. This template is designed for a wide range of applications such as education, blogging, social media, marketing, presentations and other types of projects. This infographic is very easy to edit and customize. Fully customizable and compatible with Powerpoint, Keynote, and Google Slides, you can change text, colors and shapes with just one click. This infographic is perfect for any company that wants to show off their colorful personality. Create an infographic that will get people excited about your brand filled with facts and important information!


5 slides
Value Chain Business Model Presentation
Spark fresh insight into how your organization creates value with this clean, arrow-based layout that makes every step feel intuitive and action-ready. This presentation breaks down key activities, support processes, and improvement opportunities in a clear visual flow perfect for strategy discussions. Fully compatible with PowerPoint, Keynote, and Google Slides.


5 slides
Breast Cancer Prevention Infographics
Breast Cancer is a serious disease that affects millions of people worldwide. These infographics are visual representations of information that provide tips and strategies to help prevent breast cancer. These infographics include statistics about breast cancer, risk factors, and preventative measures that can be taken to reduce the risk of developing the disease. You can also use these to provide information on screening and early detection, such as mammograms and self-exams. The visuals in these infographics may include icons, images, graphs, and charts to make the information easy to understand.


6 slides
Business Growth with TAM SAM SOM Framework
Fuel your next big idea with a clear, structured breakdown of market potential. This easy-to-follow visual helps explain the TAM, SAM, and SOM layers of business growth—ideal for investors, strategy teams, or product managers. Fully editable in PowerPoint, Keynote, and Google Slides for fast, seamless presentation design.


21 slides
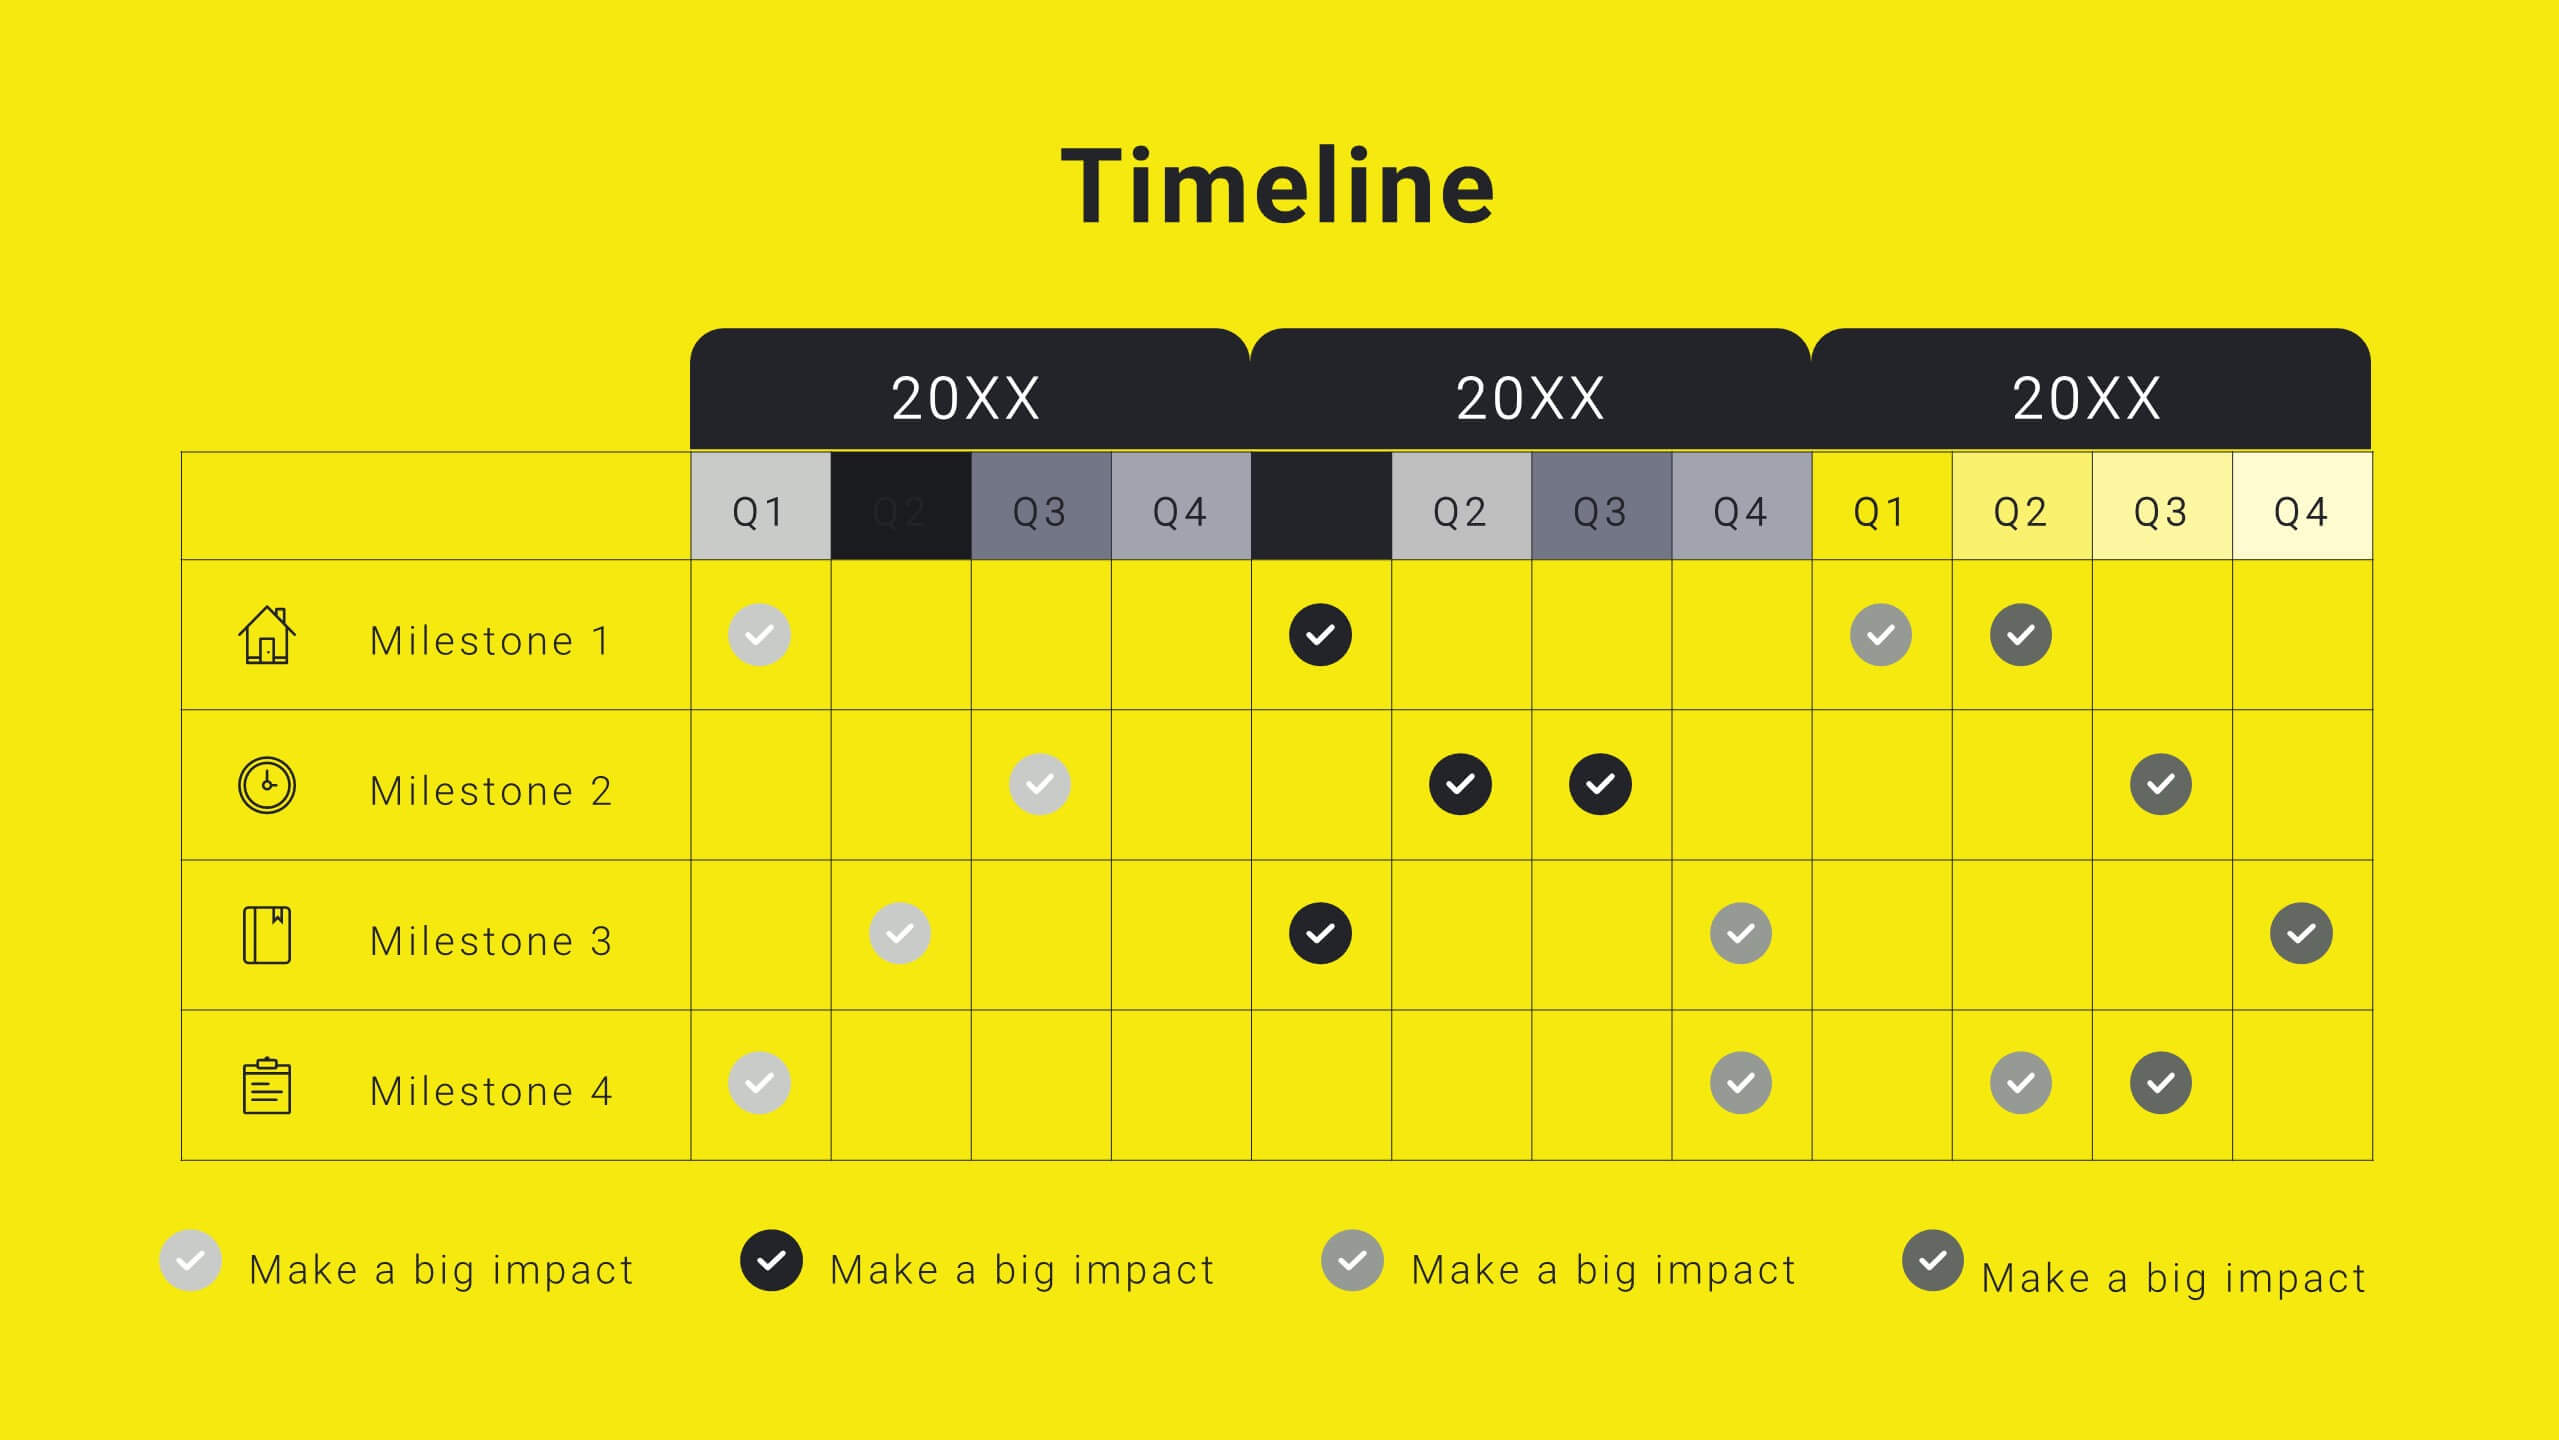
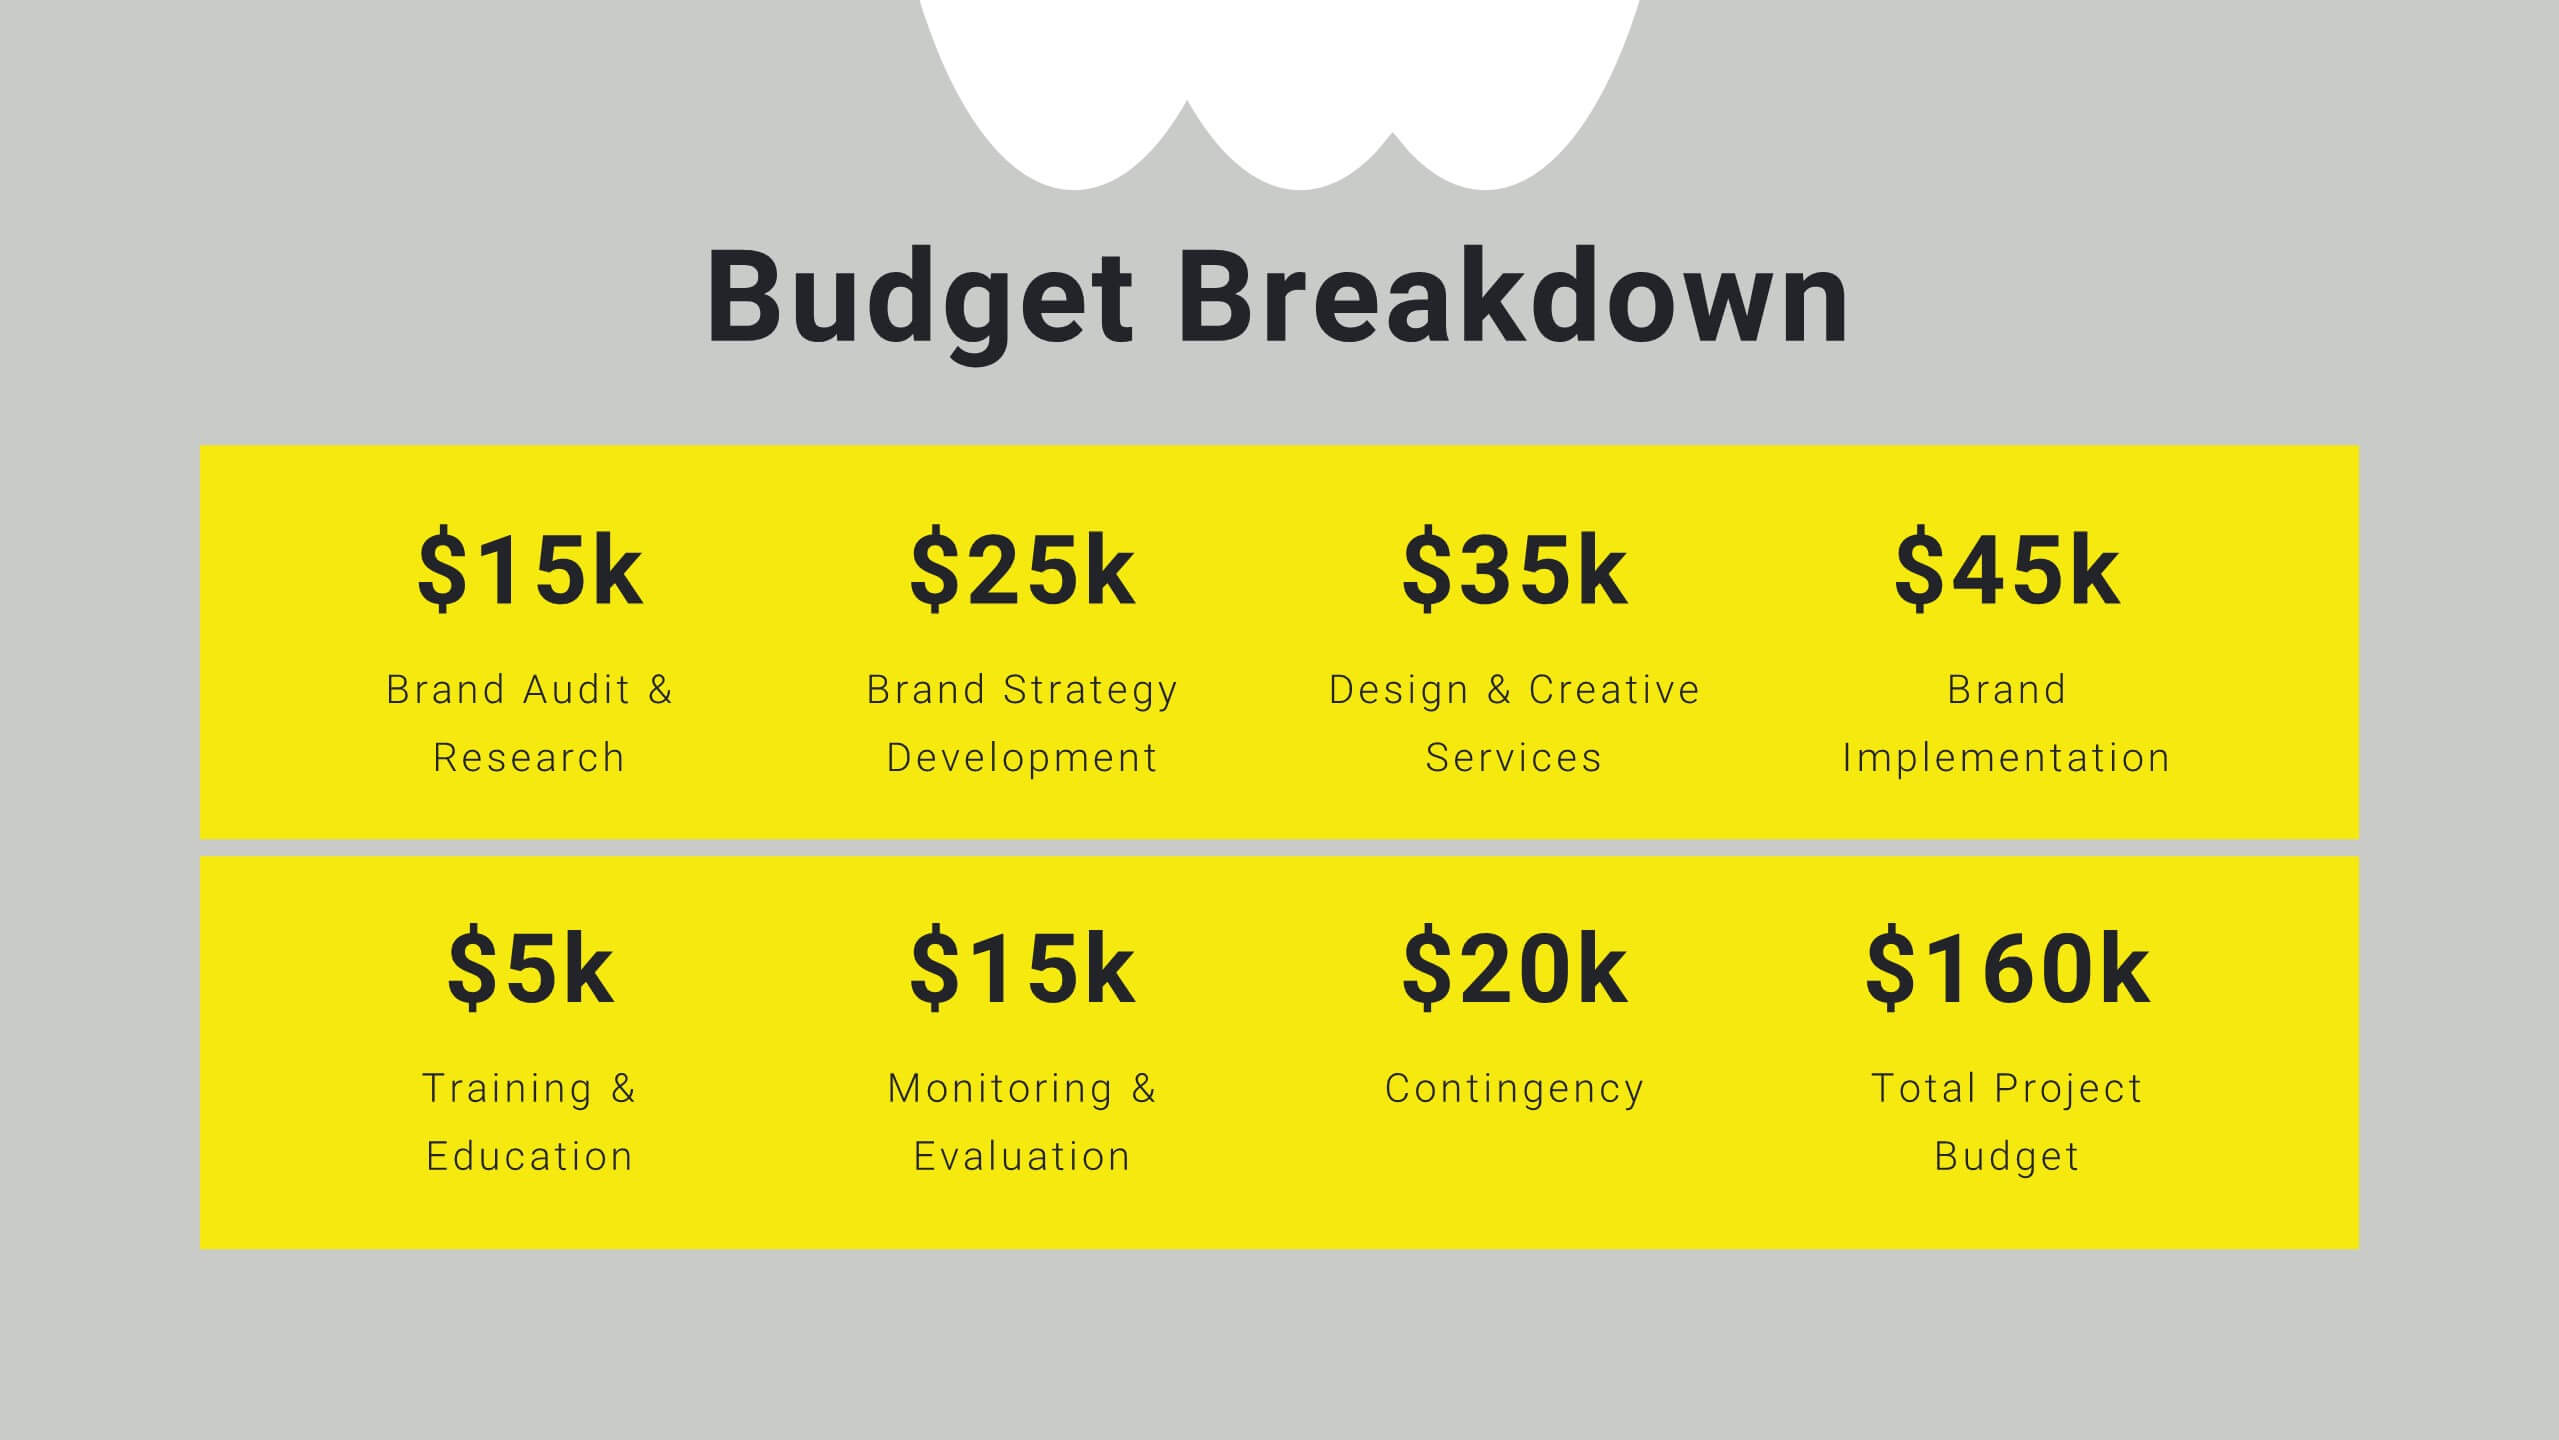
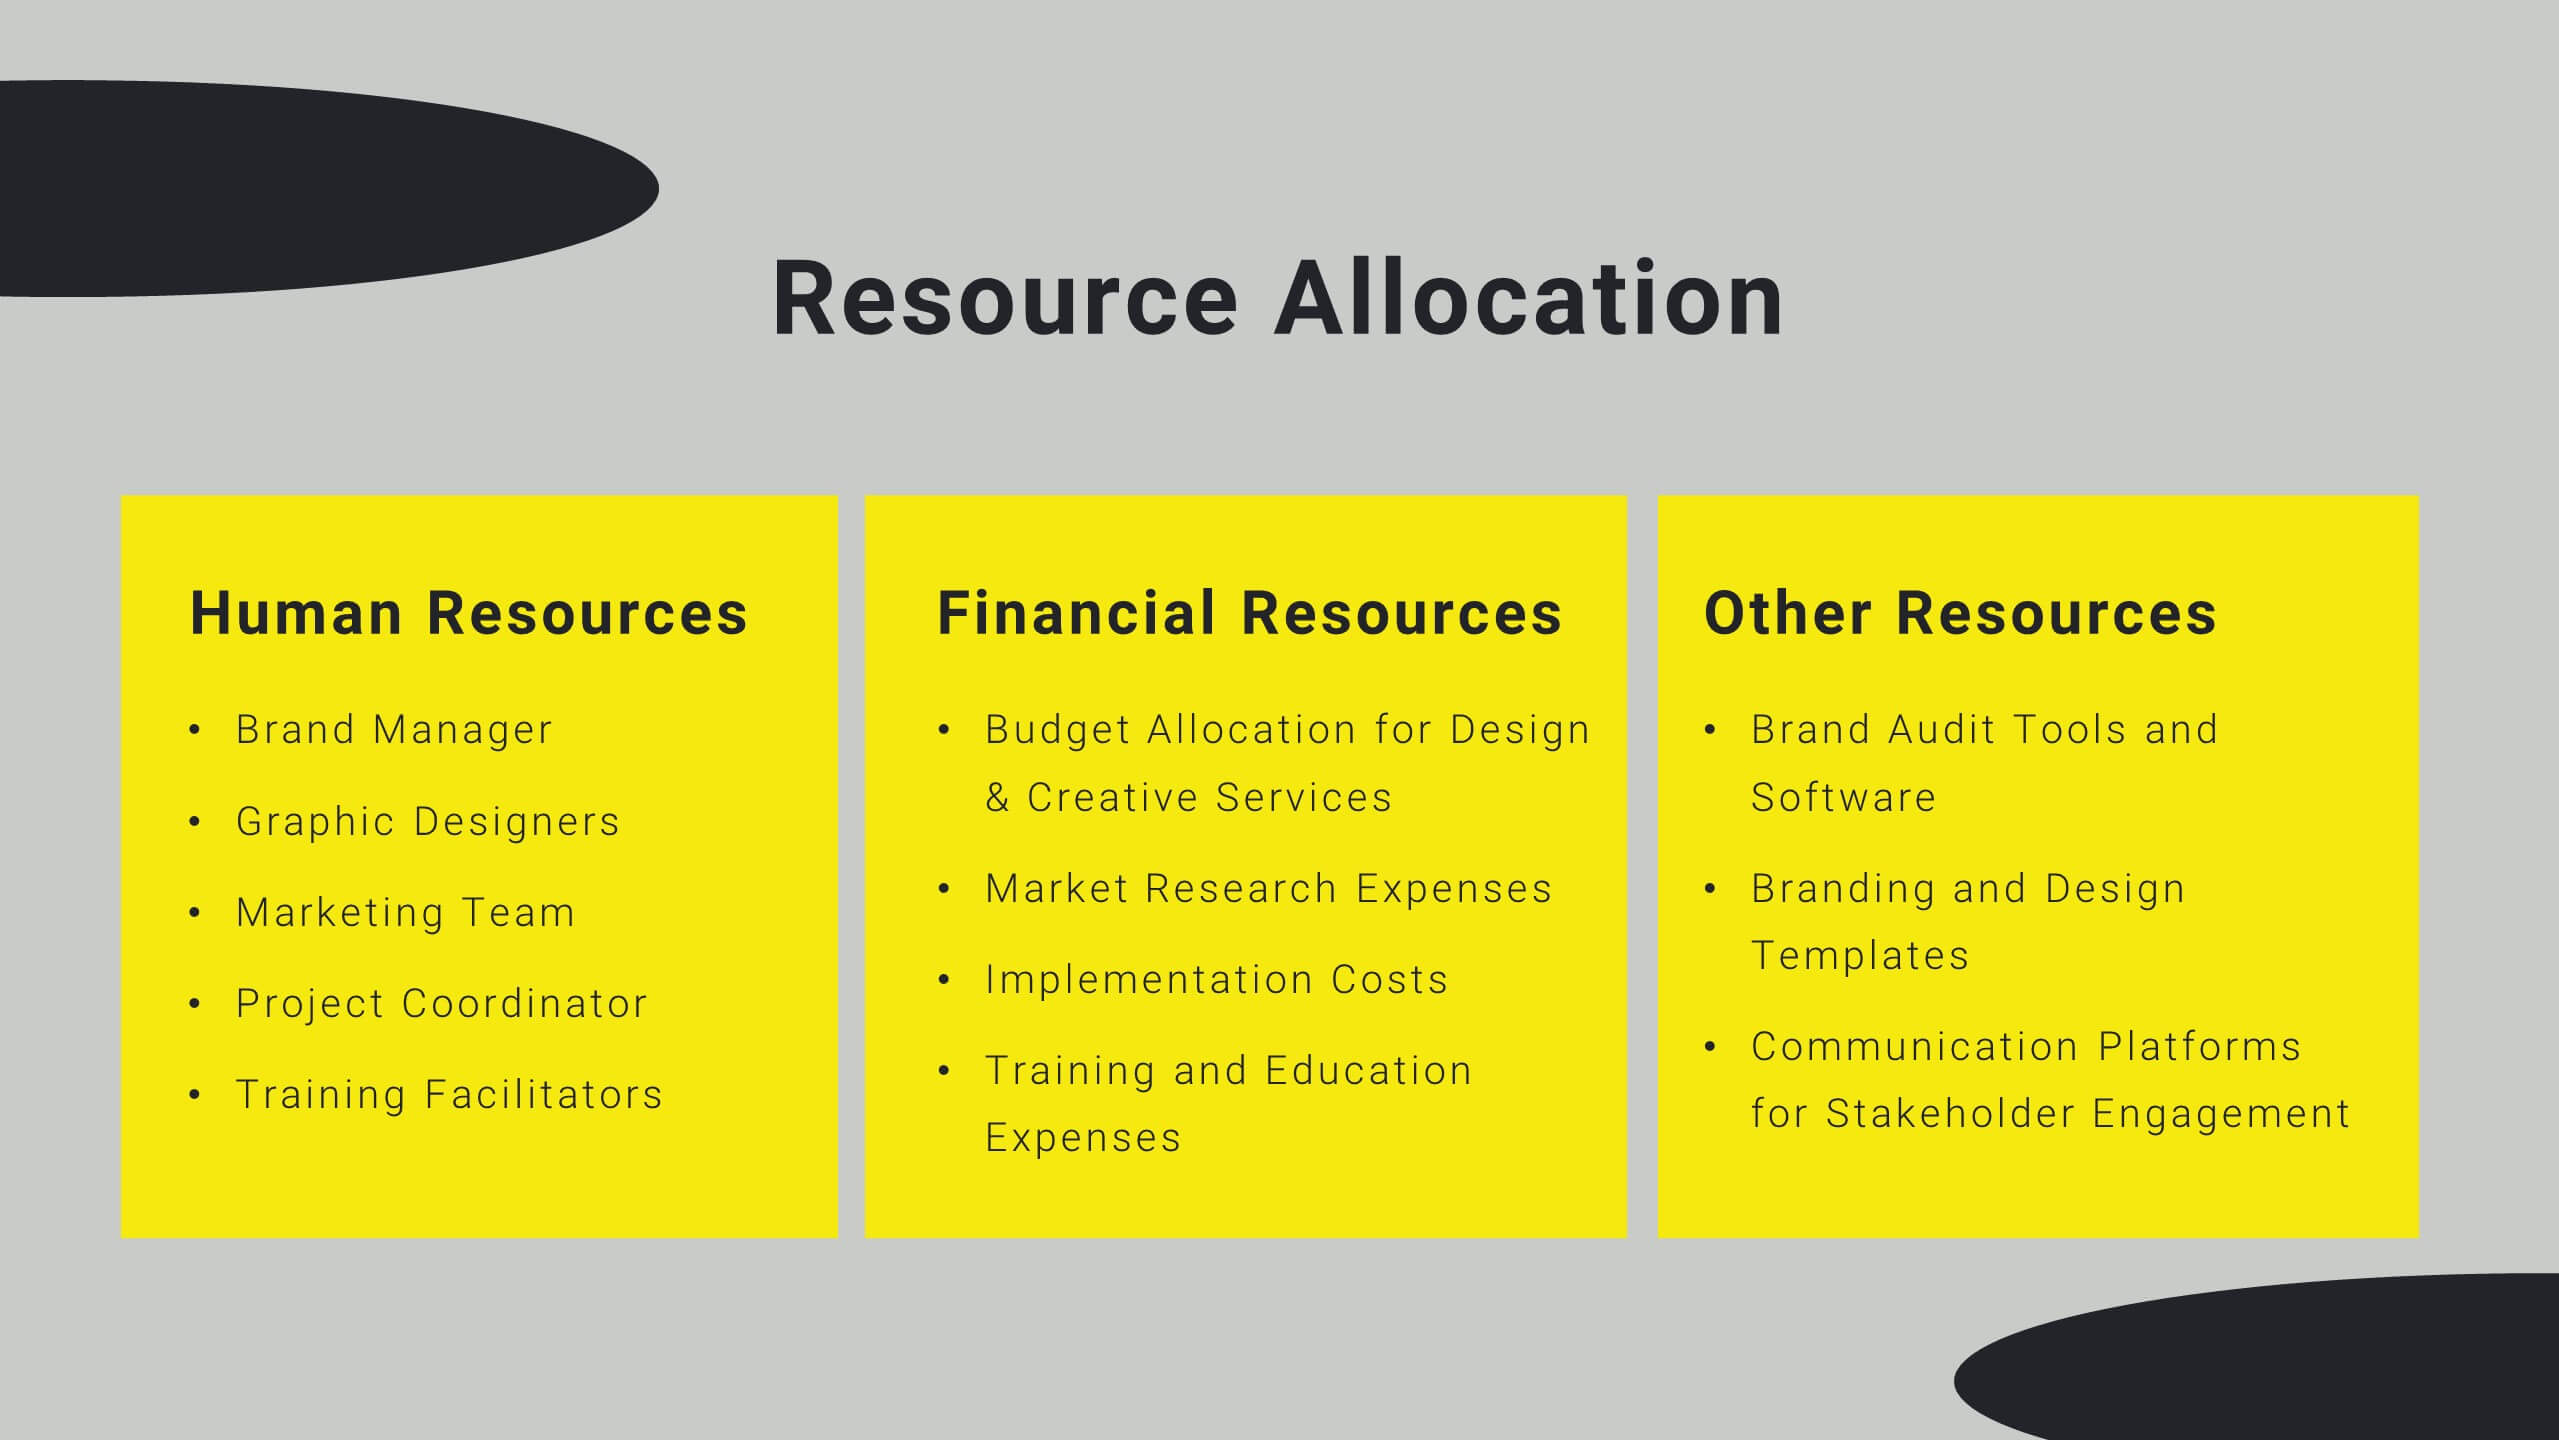
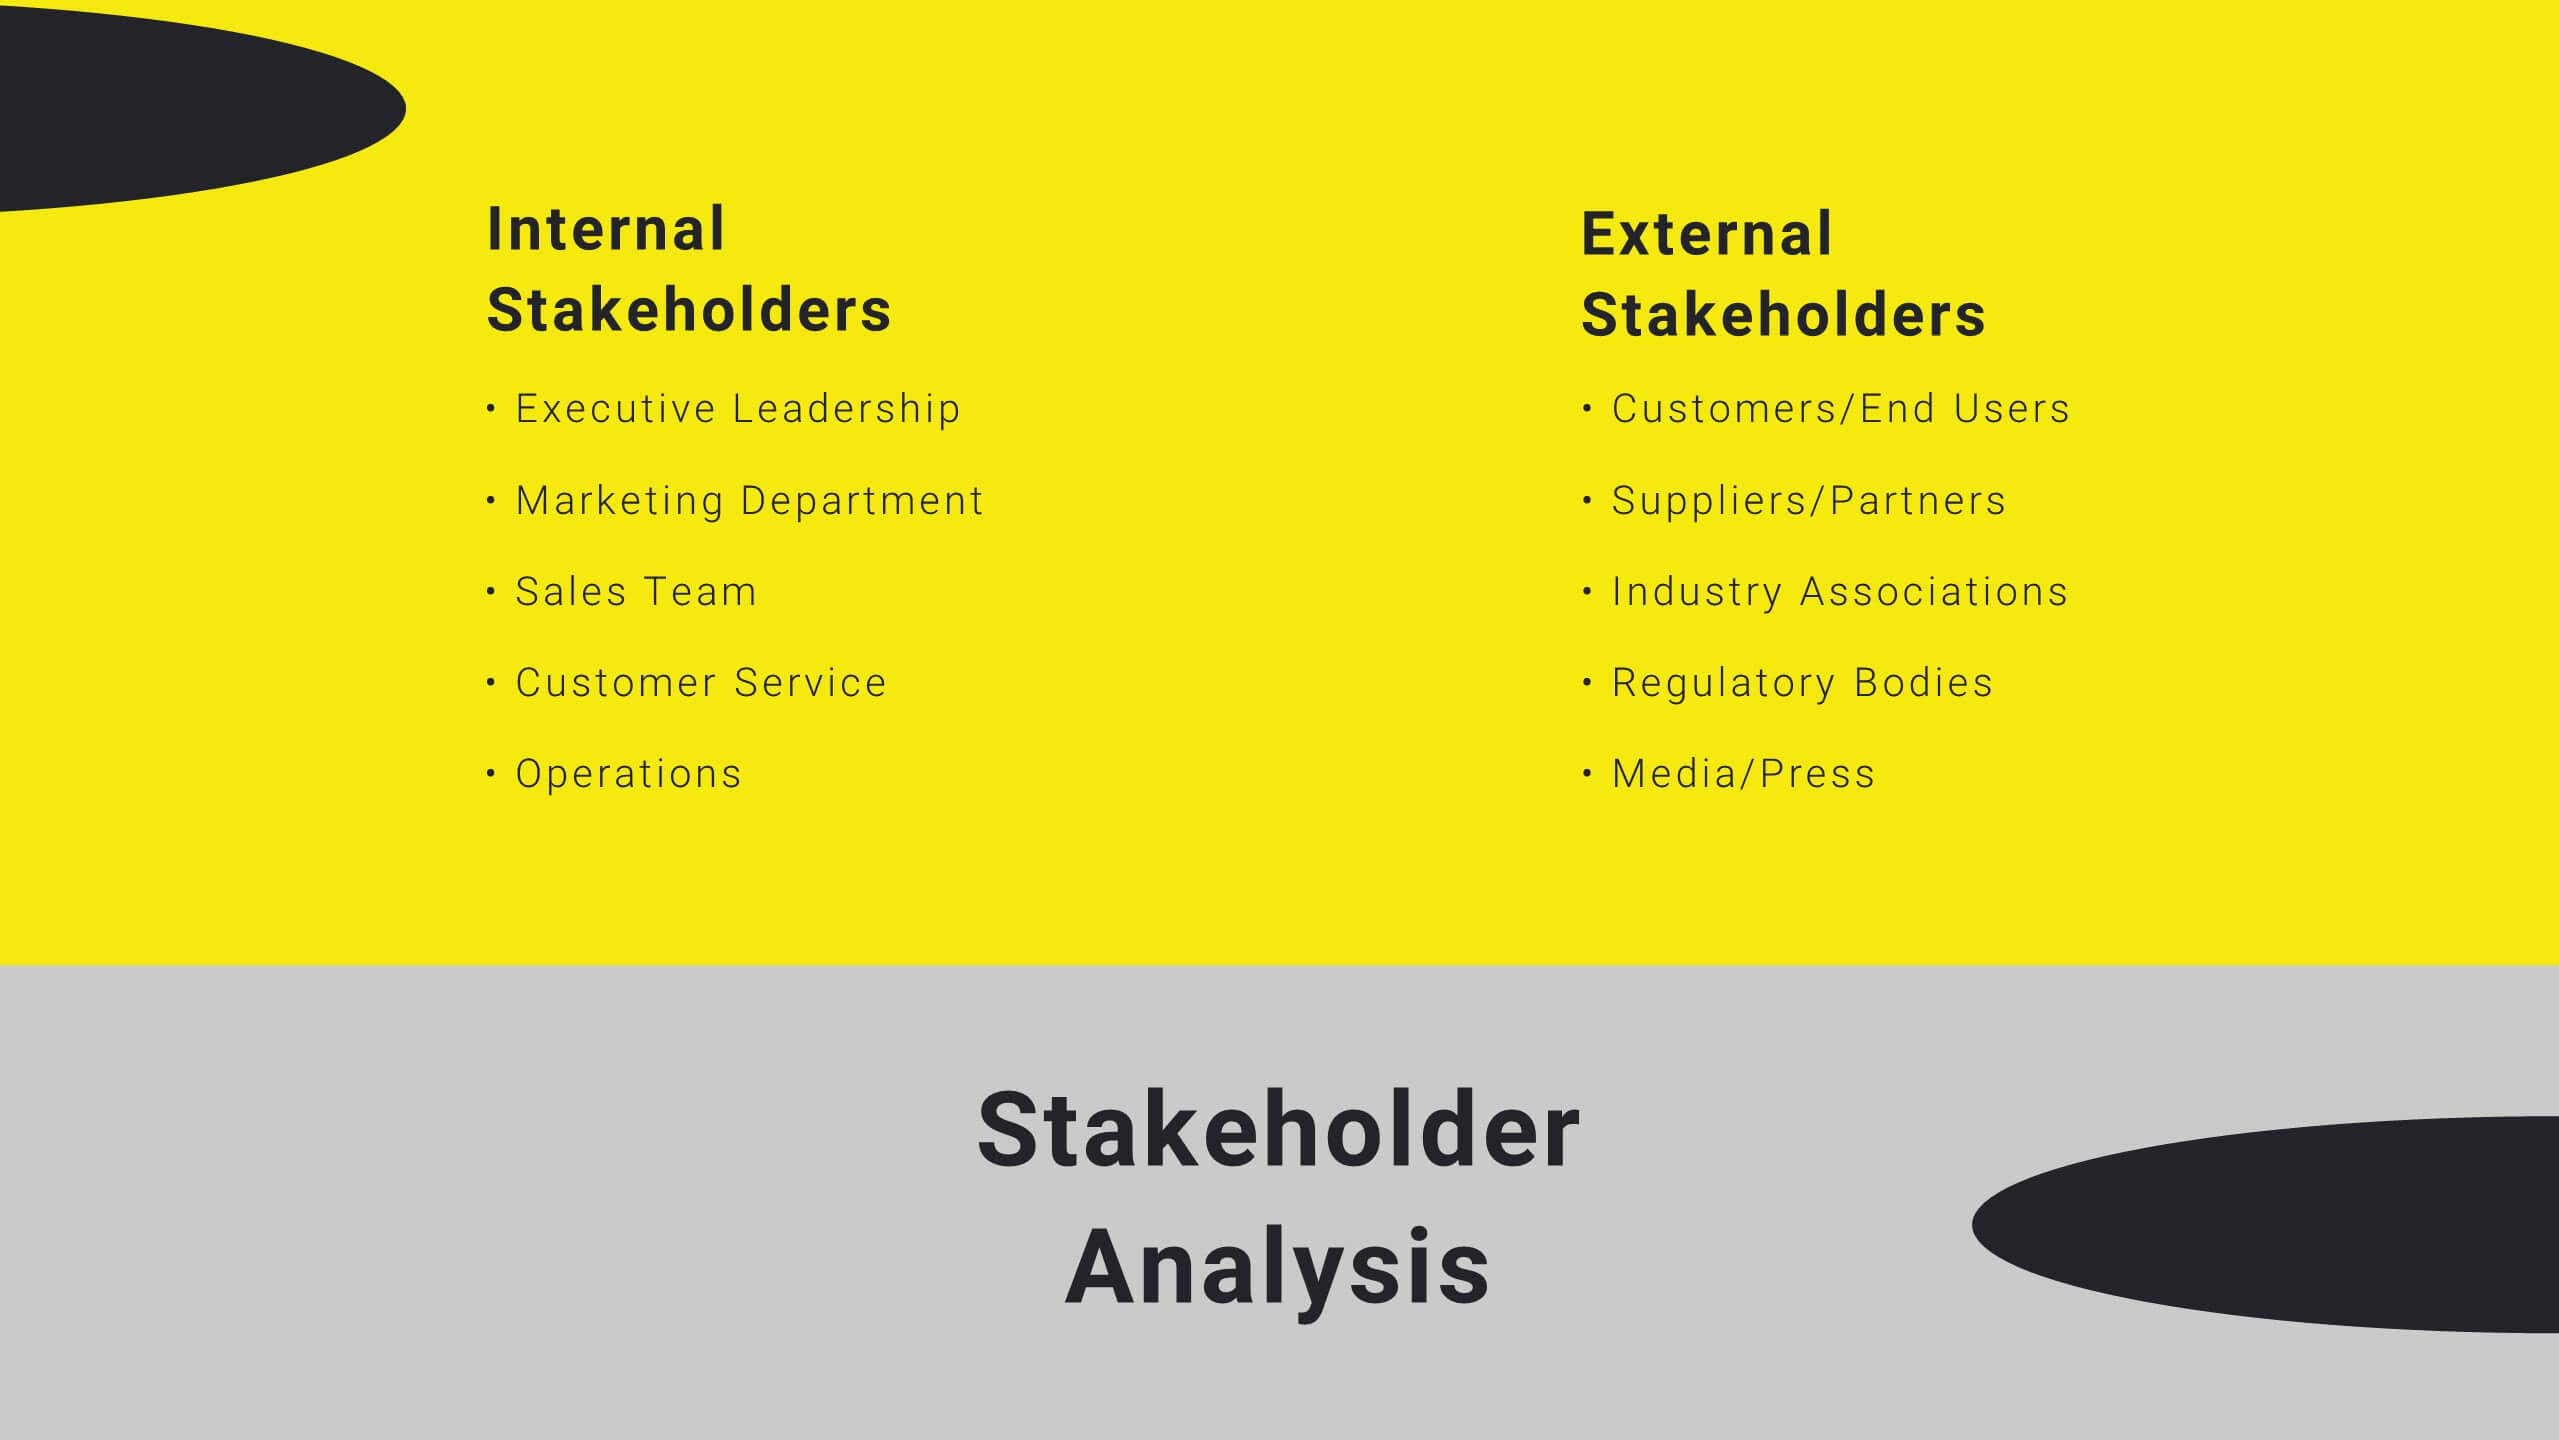
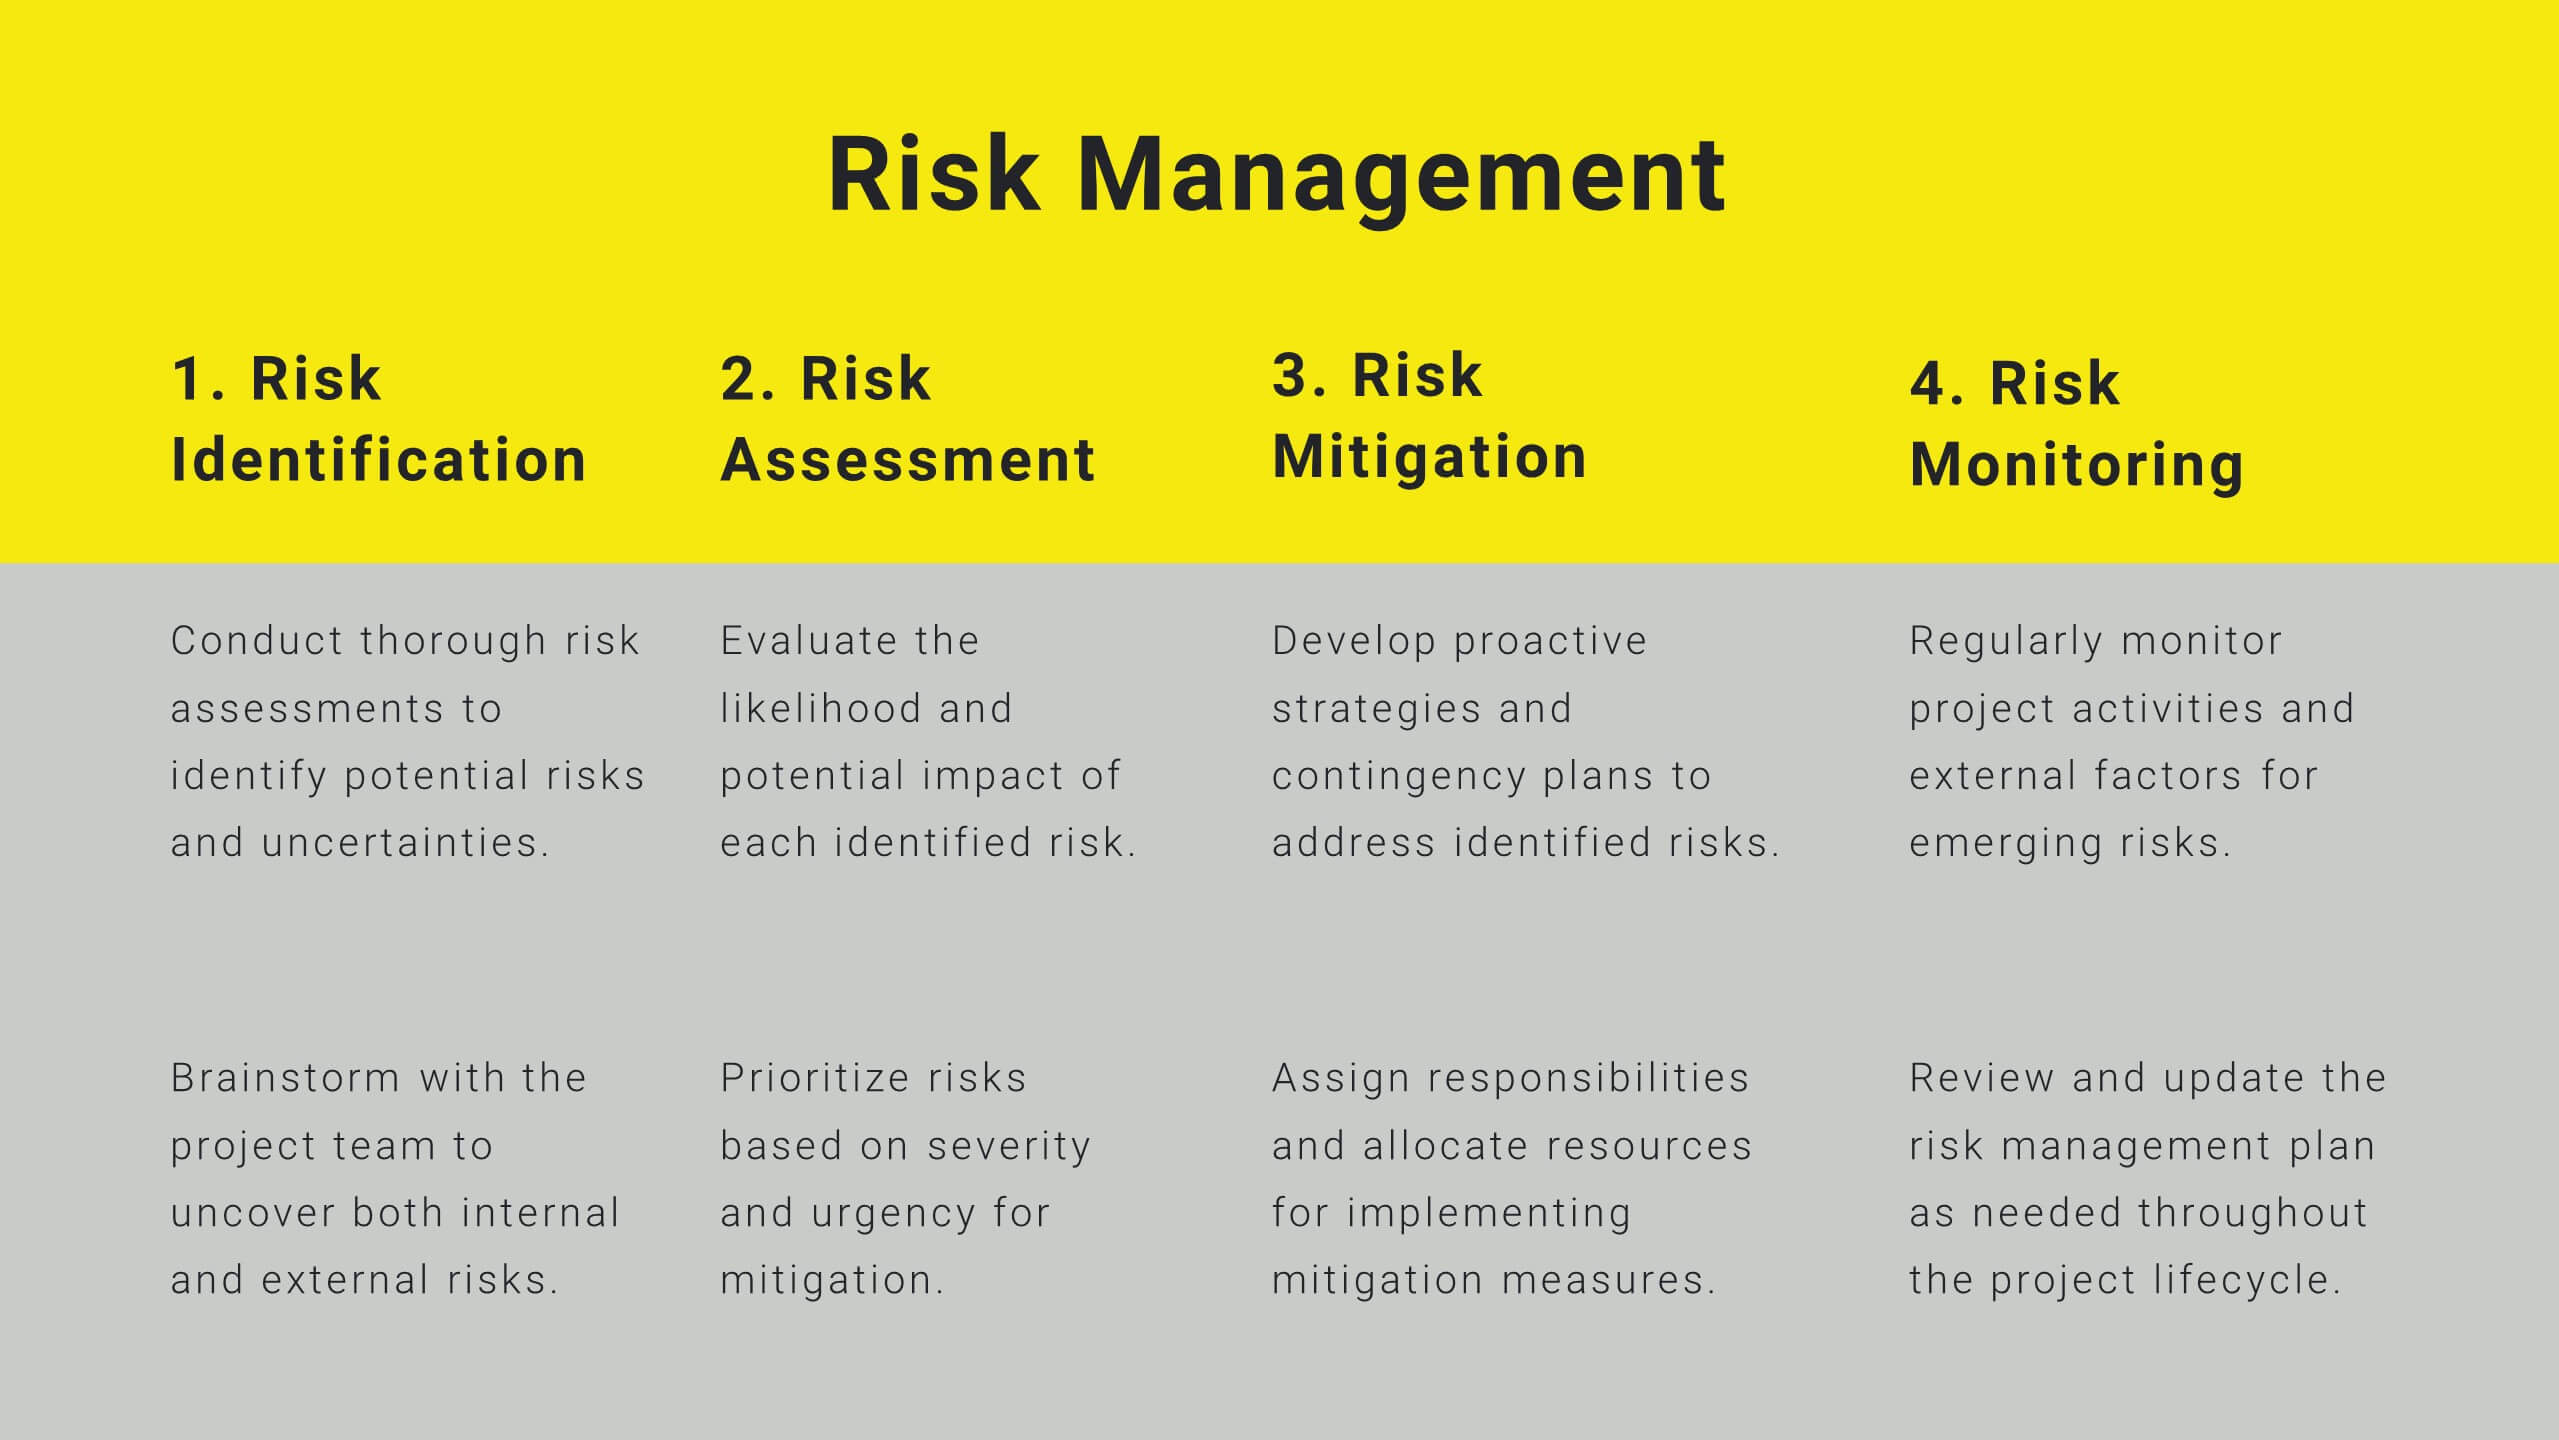
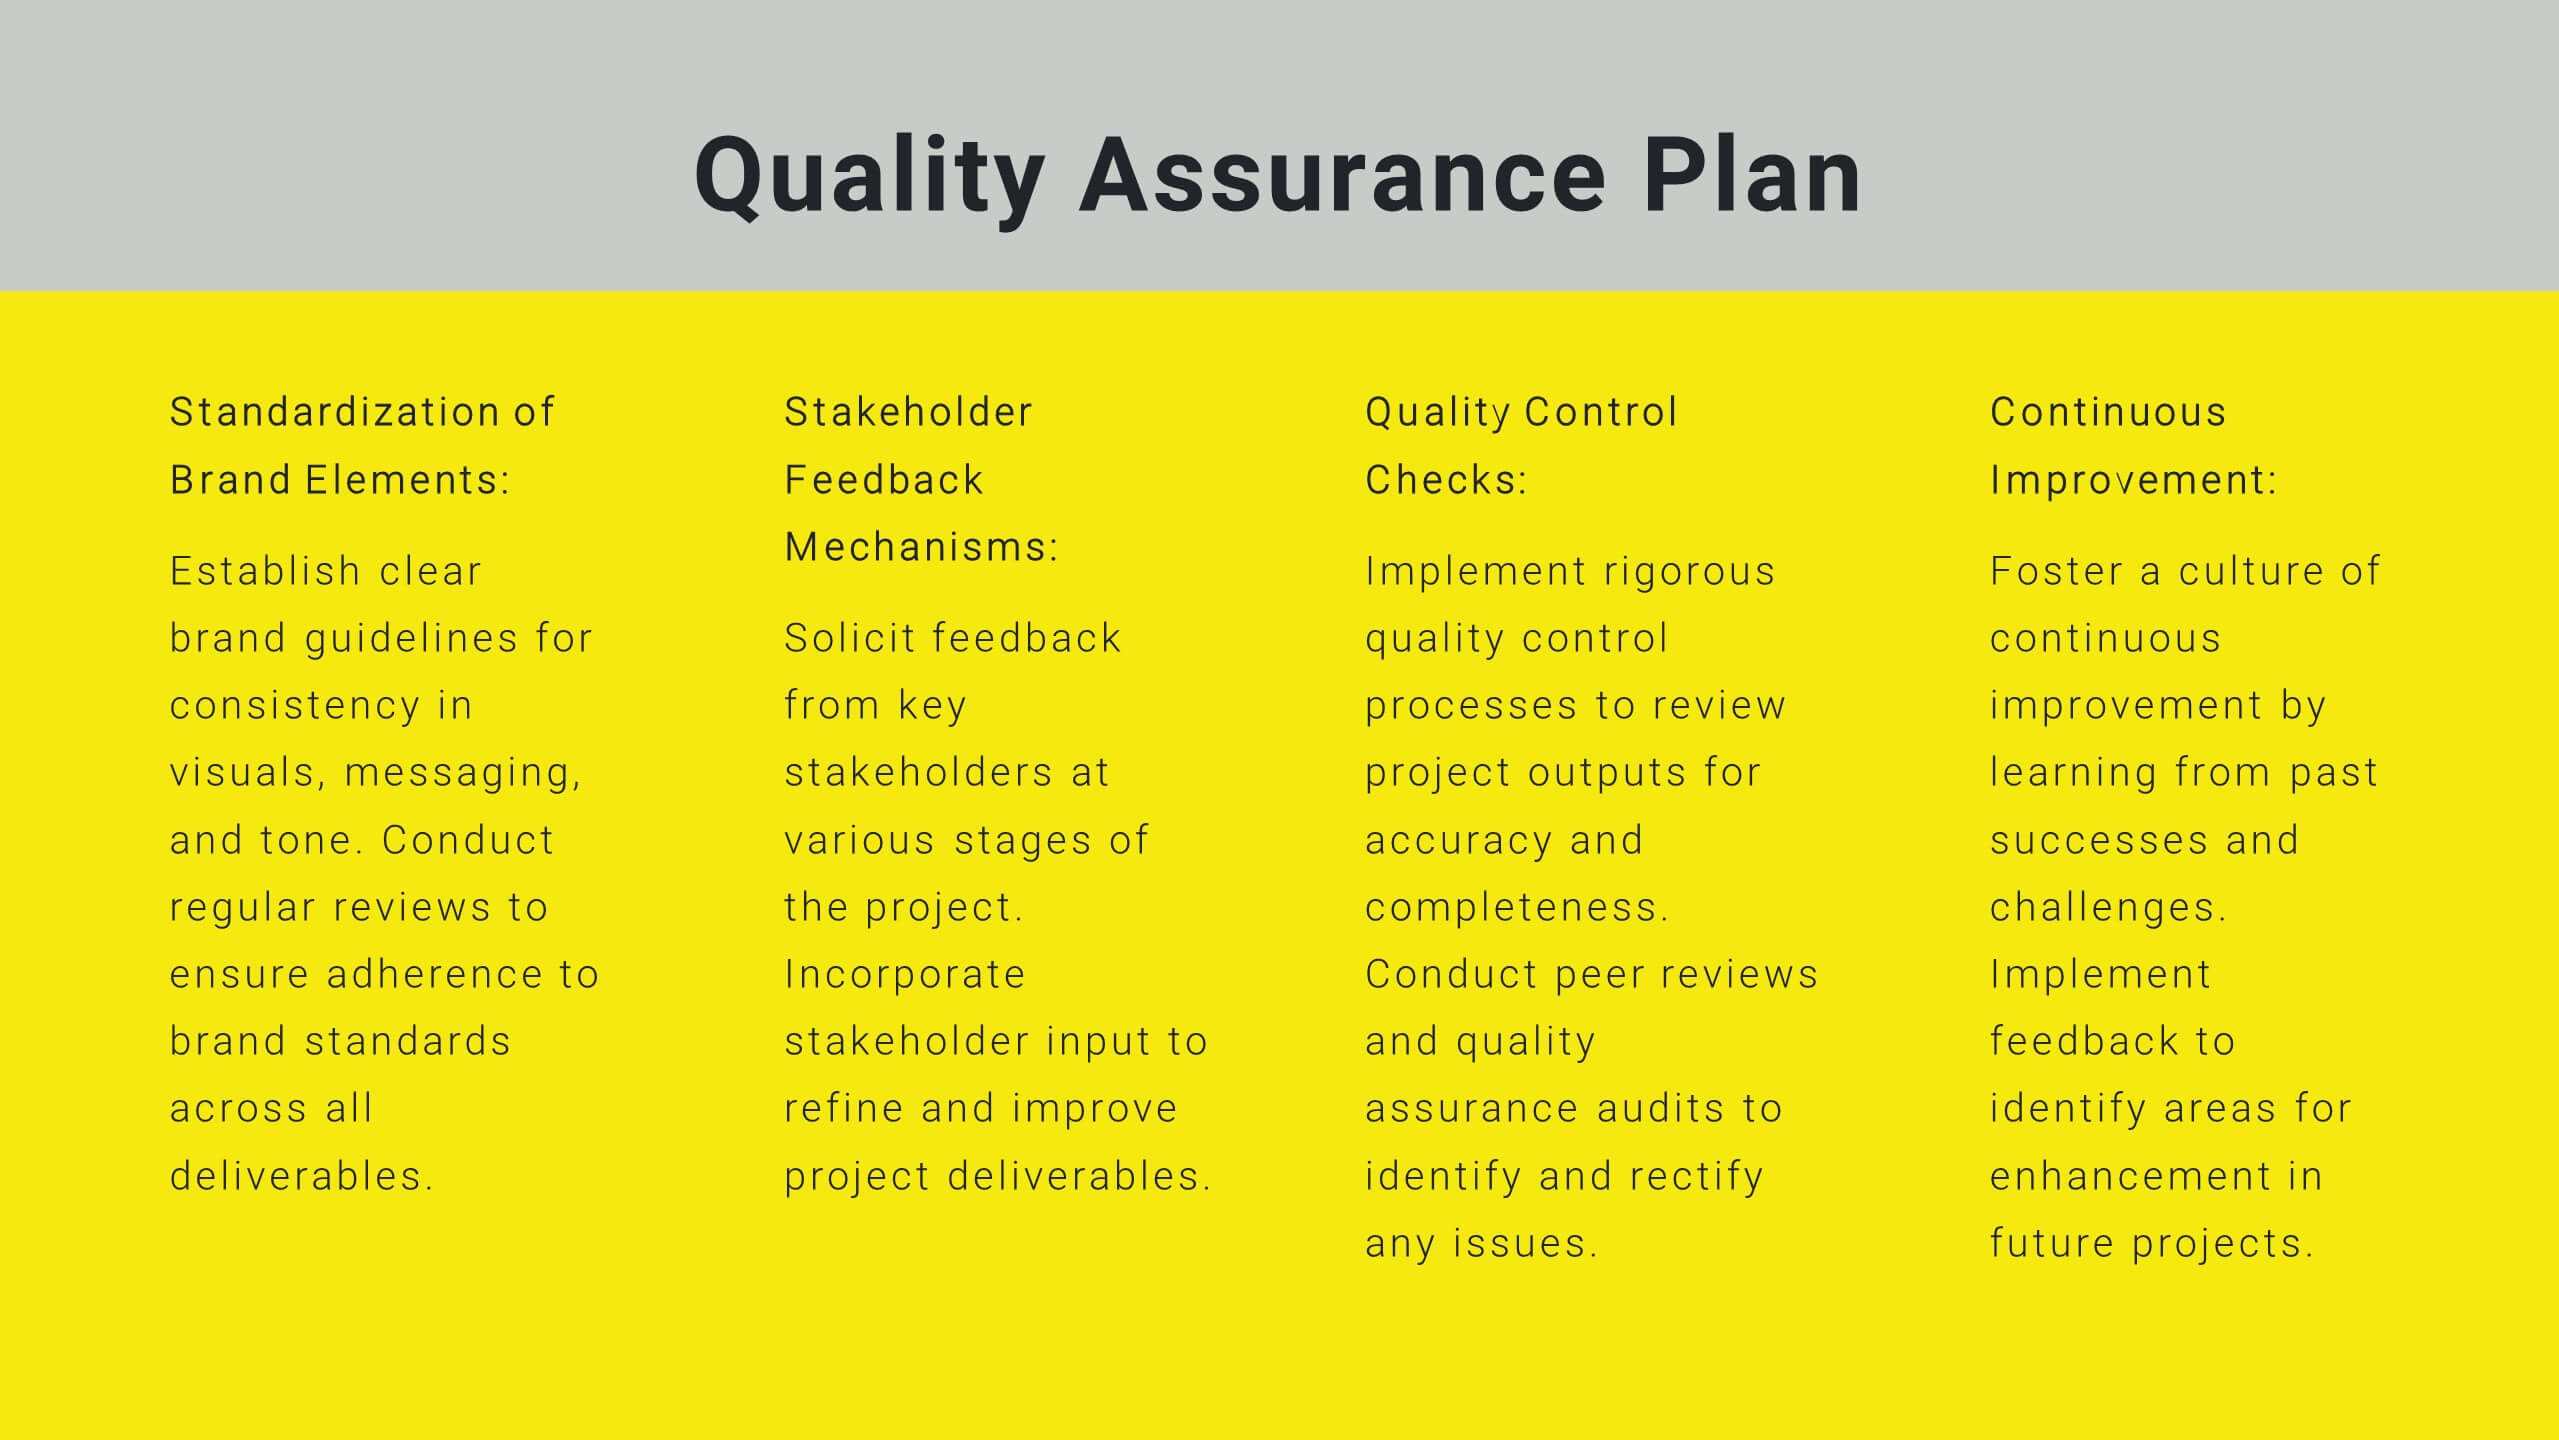
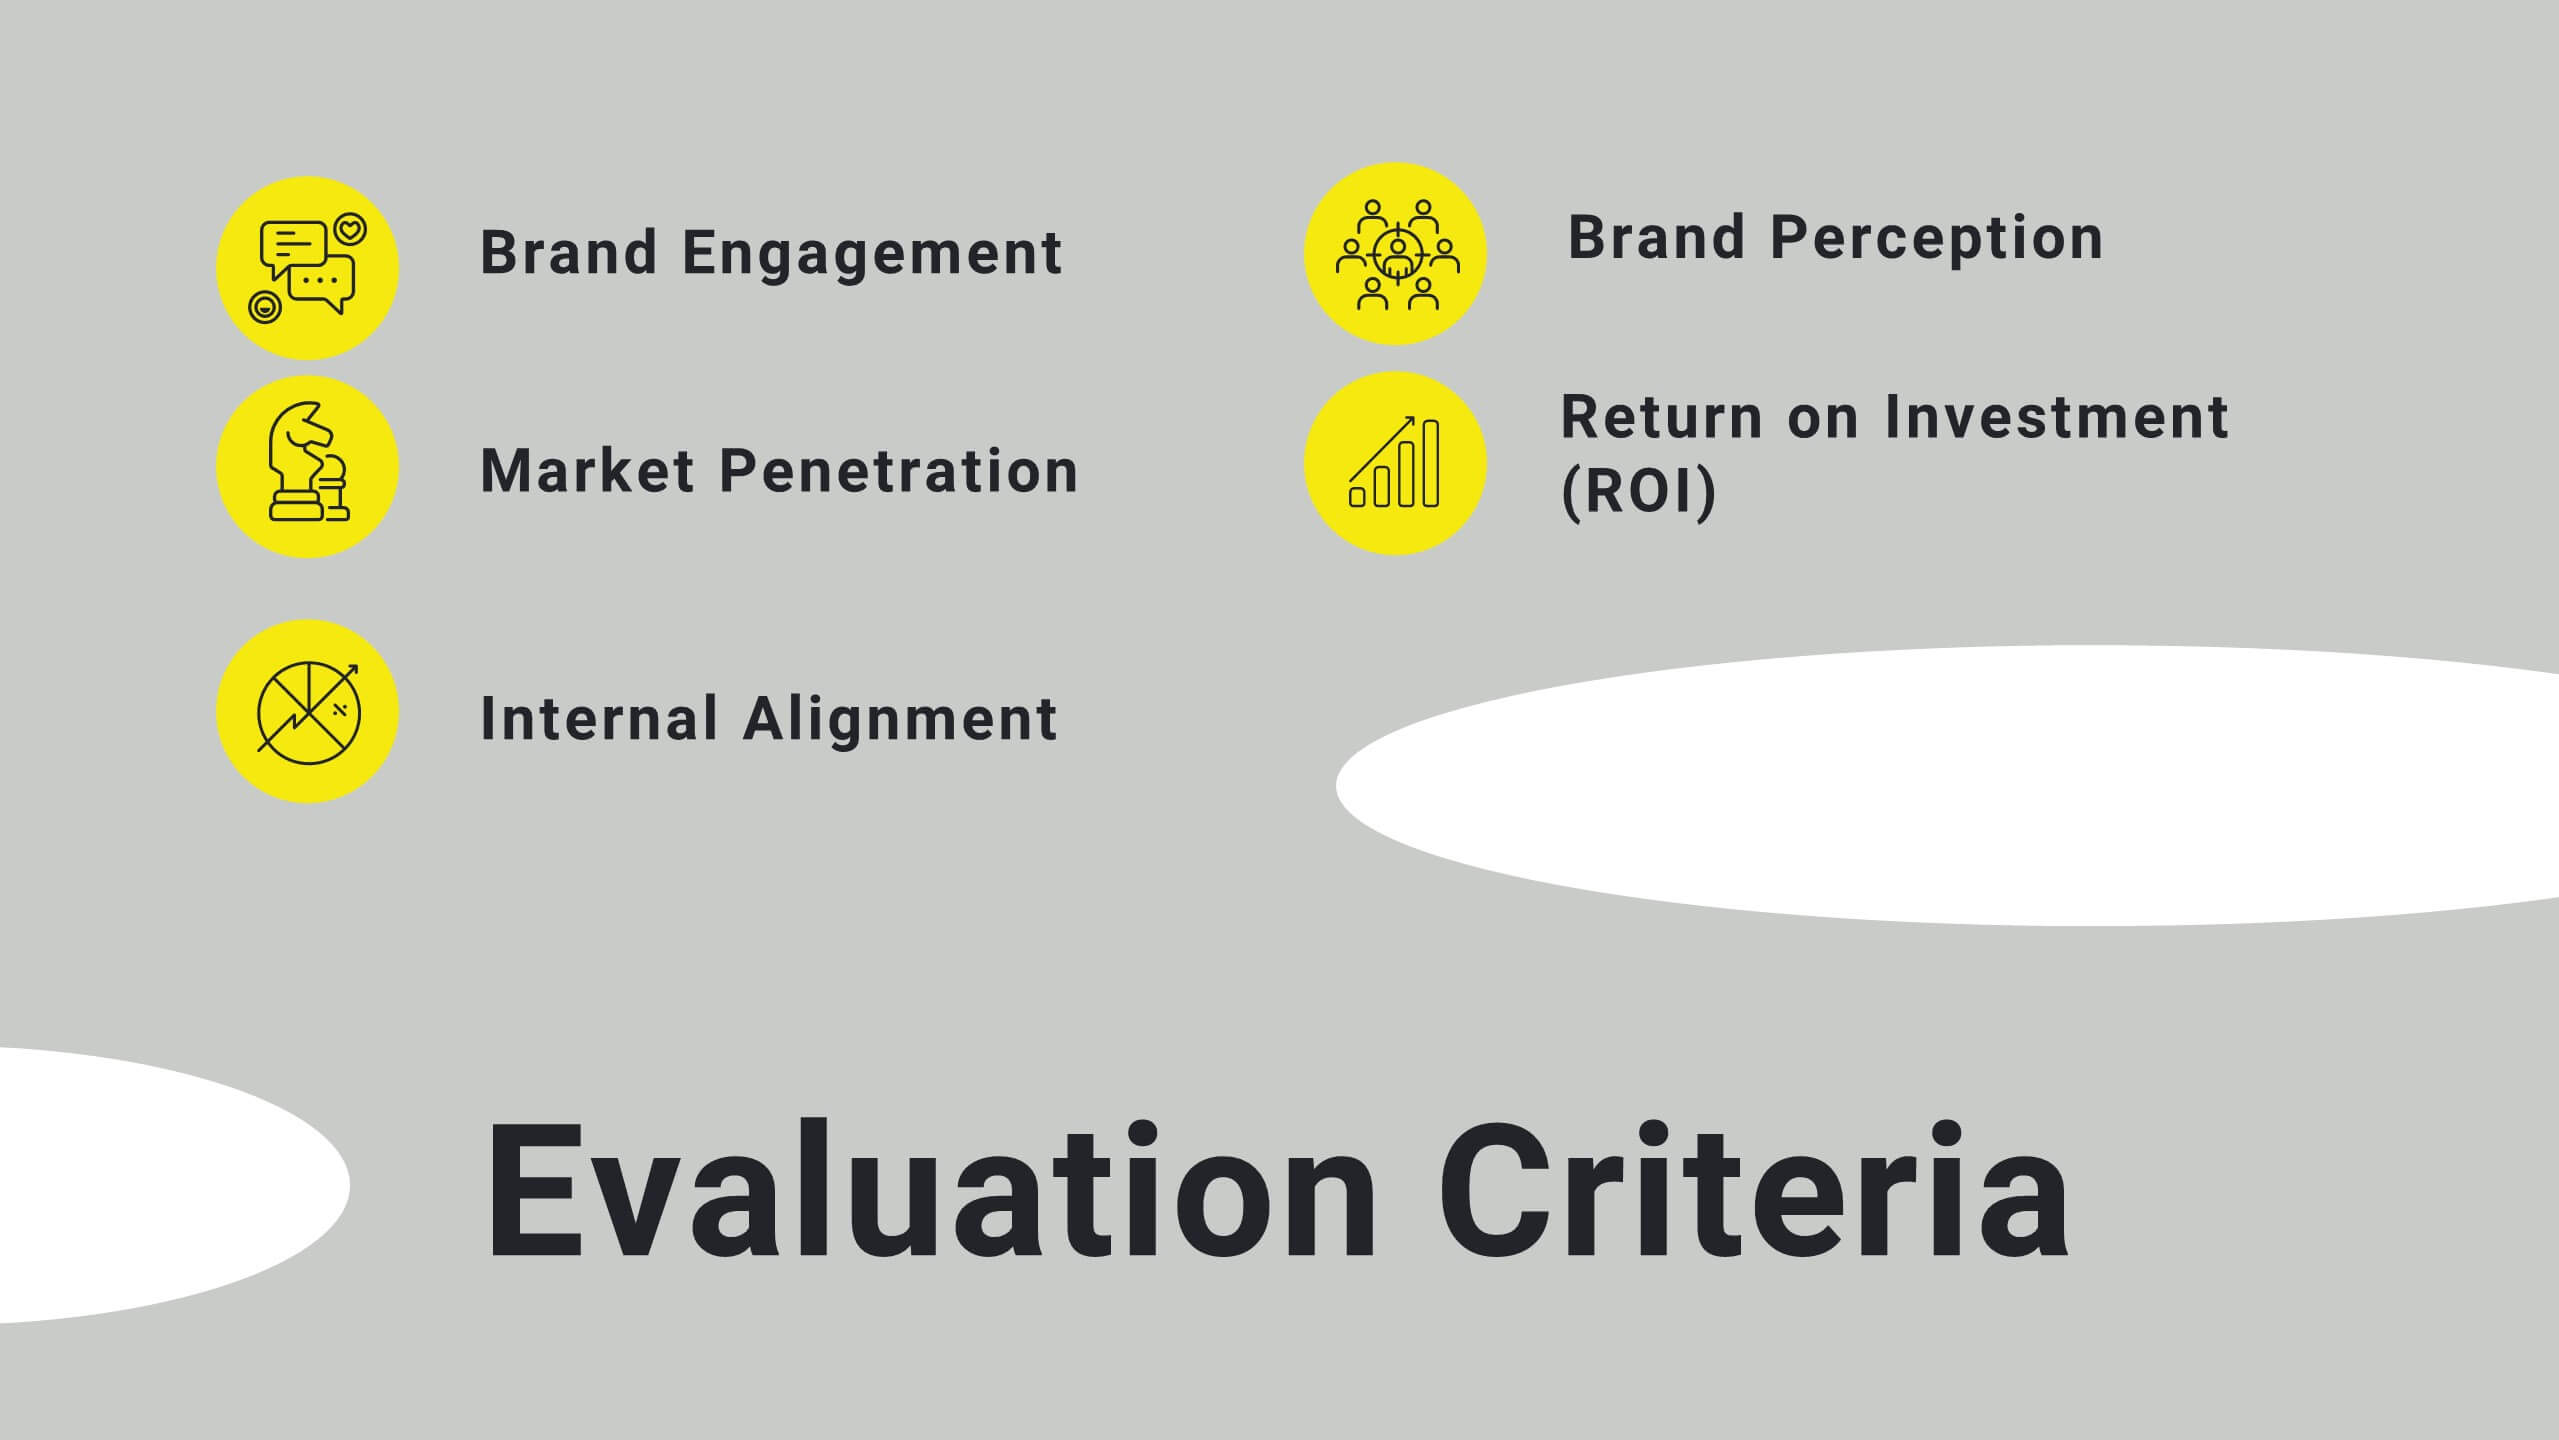
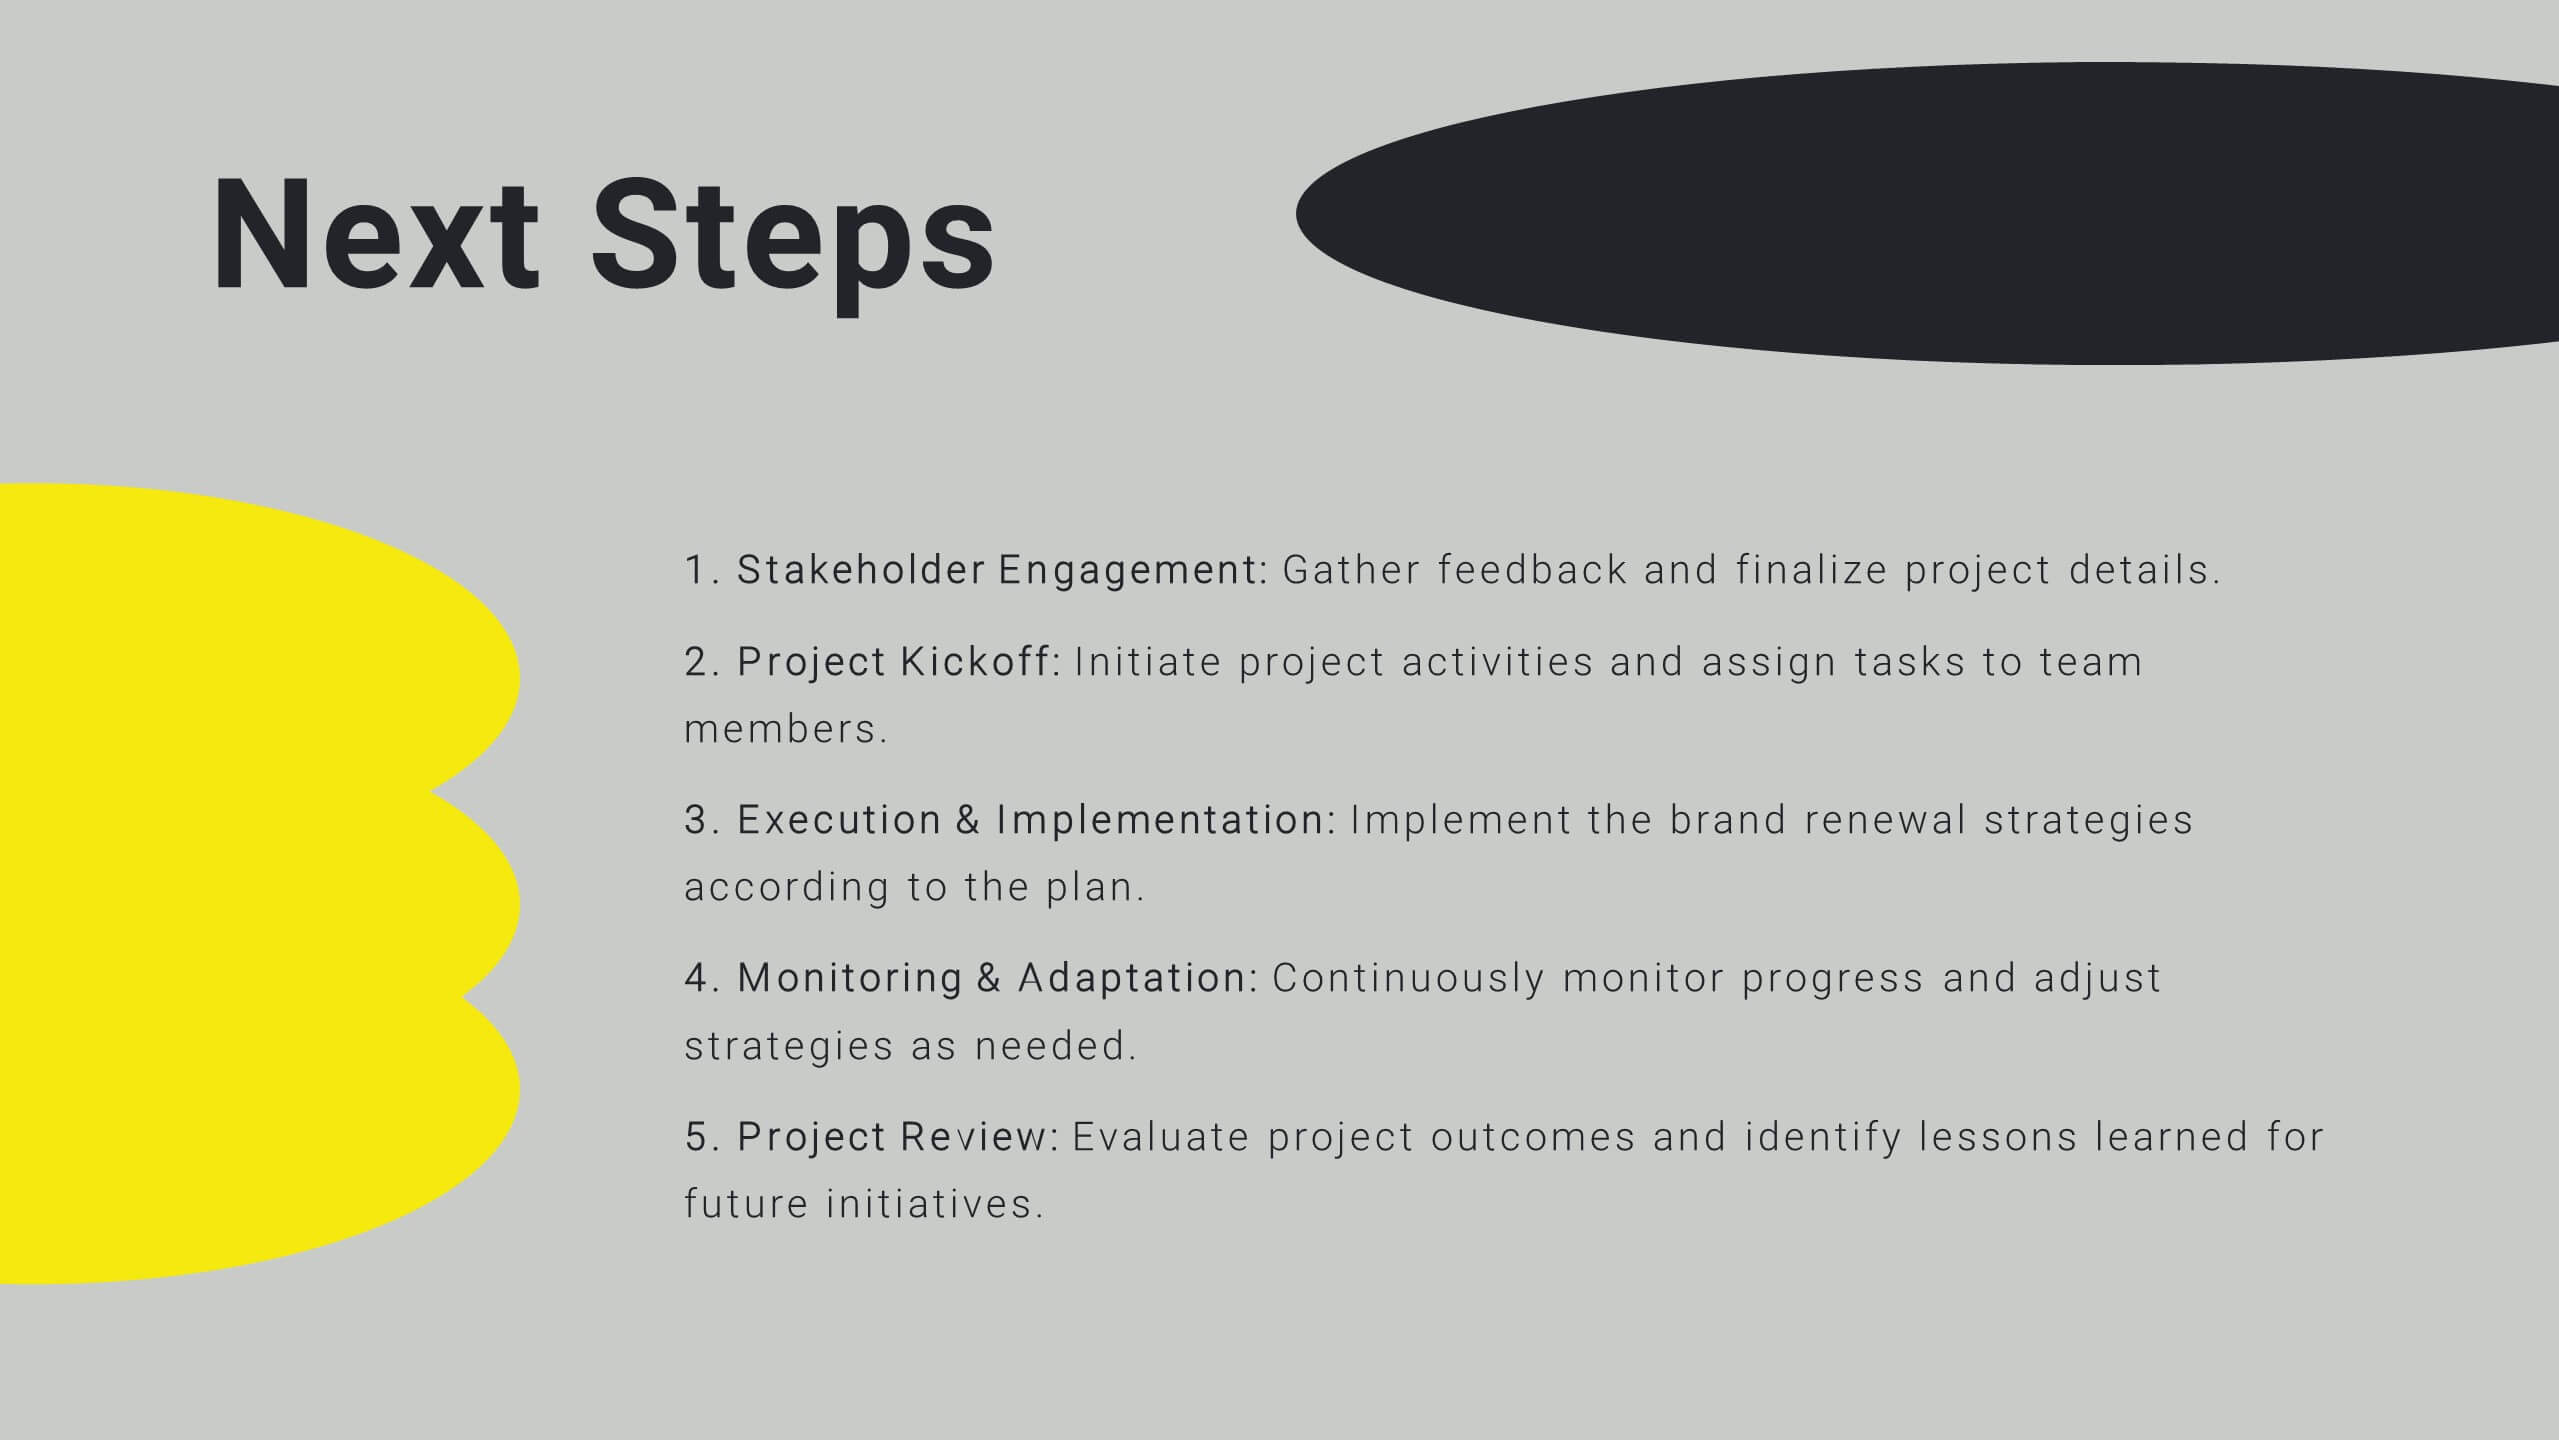
Sable Detailed Project Execution Plan Presentation
Master your project planning with this comprehensive execution plan template! Perfect for detailing project overviews, objectives, and timelines, it includes slides for budget breakdowns, resource allocation, and risk management. Ensure every detail is covered with structured content and clear visuals. Compatible with PowerPoint, Keynote, and Google Slides for seamless presentations on any platform.


8 slides
End of Presentation Thank You Slide
Wrap up your presentation with a bold, memorable finish using a vibrant layout that instantly grabs attention. This slide gives you space to share final notes, highlight next steps, or leave a lasting impression with clean, modern design. Fully editable and compatible with PowerPoint, Keynote, and Google Slides.


5 slides
Process Improvement Cycle Mapping Presentation
Illustrate continuous growth and optimization with this modern process improvement cycle template. Featuring a dynamic circular flow design, it’s ideal for showcasing iterative strategies, workflow enhancements, or business development stages. Fully editable in Canva, PowerPoint, and Google Slides, it ensures clarity and professionalism in mapping each step toward better performance.


6 slides
Aviation Classes Infographics
Discover the world of Aviation Classes with our customizable infographic template. This template is fully compatible with popular presentation software like PowerPoint, Keynote, and Google Slides, allowing you to easily customize it to illustrate and communicate various aspects of aviation education and training. The Aviation Classes infographic template offers a visually engaging platform to outline the types of aviation courses, training programs, career opportunities, and the importance of aviation education. Whether you're an aviation student, educator, aspiring pilot, or simply interested in aviation, this template provides a user-friendly canvas to create informative presentations and educational materials. Enhance your understanding of Aviation Classes with this SEO-optimized infographic template, thoughtfully designed for clarity and ease of use. Customize it to showcase different aviation disciplines, training institutions, certification requirements, and the role of education in the aviation industry. Ensure that your audience gains valuable insights into the world of aviation education. Start crafting your personalized infographic today to explore the realm of Aviation Classes.


5 slides
Customer Satisfaction Survey Ratings Presentation
Present customer insights with clarity using this Customer Satisfaction Survey Ratings slide. Designed with a vertical timeline beside a thumbs-up icon, it’s perfect for showcasing key survey data, feedback percentages, or sentiment trends. Each rating step includes editable text and color-coded markers for easy comparison. Compatible with PowerPoint, Canva, and Google Slides.


7 slides
Target Market Profiles Infographic
A Target Market Profile, also known as a customer profile or buyer persona, is a detailed description of a specific segment of a broader market that a business aims to target with its products or services. This infographic is a vibrant and insightful template designed to help you understand your audience better and enhance your marketing strategies. Explore the essence of audience segmentation and empower your marketing endeavors with a clear understanding of your target market. Compatible with Powerpoint, Keynote, and Google Slides. This infographic explores the world of targeted marketing and revolutionize your strategies.


5 slides
Strengths, Weaknesses, Opportunities & Threats Presentation
Visualize your SWOT analysis with clarity using the Strengths, Weaknesses, Opportunities & Threats Presentation. This editable puzzle-style slide makes it easy to present key insights and strategic positioning in a visually engaging format. Compatible with PowerPoint, Canva, and Google Slides for seamless customization and professional business planning.