


Features
- 5 Unique slides
- Fully editable and easy to edit in Microsoft Powerpoint, Keynote and Google Slides
- 16:9 widescreen layout
- Clean and professional designs
- Export to JPG, PDF or send by email


Do you have any questions?
Recommend


5 slides
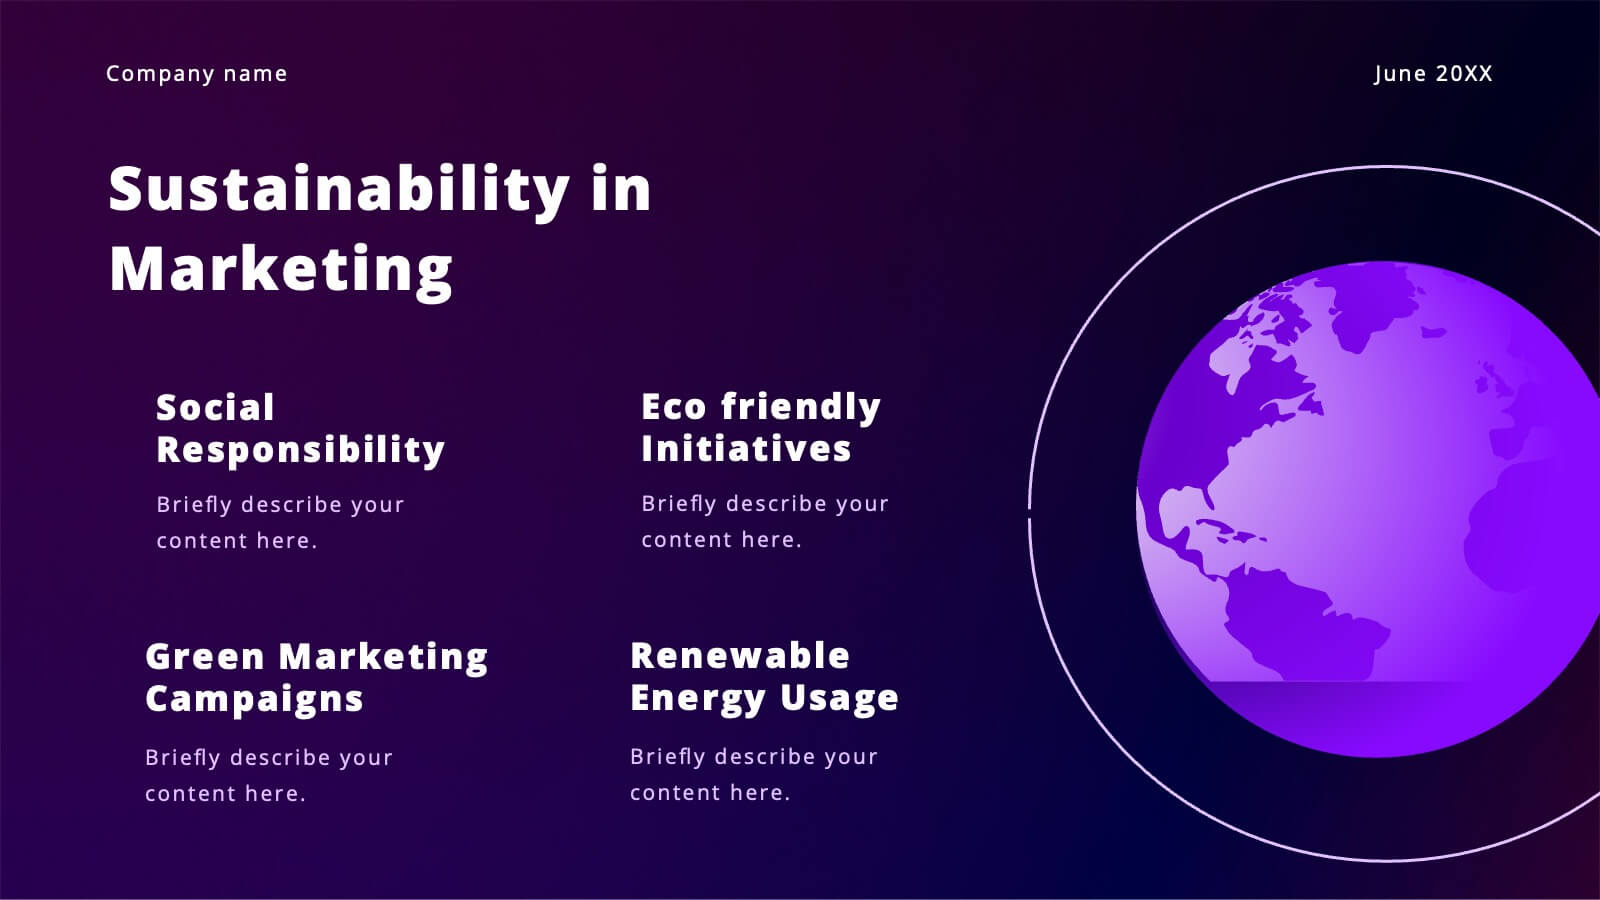
Eco Footprint and Sustainability Presentation
Raise awareness and drive impact with this Eco Footprint and Sustainability Presentation. Featuring a modern footprint visual, this slide is perfect for showcasing key environmental metrics, carbon impact, or green initiatives. Ideal for ESG reports, nonprofit campaigns, or corporate responsibility updates. Compatible with PowerPoint, Keynote, and Google Slides.


5 slides
Multiple Lists Infographics
Unleash the power of organized information with our multiple lists infographics template, your companion for presenting diverse data. This versatile resource, steeped in a vibrant mix of orange, blue, and purple hues, caters to professionals from all sectors, aiding in the seamless conveyance of varied content, from business agendas to educational material. The template, characterized by its informative and creatively random style, integrates compelling graphics and intuitive icons. Whether you're a business leader, educator, or content creator striving for clarity and engagement, this infographic tool is tailored for an unforgettable visual impact.


8 slides
End-to-End Project Lifecycle Management Presentation
Visualize each phase of your project lifecycle with this clean, circular flow layout. Ideal for showcasing planning, execution, and delivery stages in a structured loop. Each segment is fully editable to match your content. Compatible with PowerPoint, Google Slides, and Keynote for effortless customization and professional results.


26 slides
Linear Technology Presentation
Cyberspace is the realm of digital information that can be accessed, shared, and stored using electronic devices. Focus on the future of technology with this template! This presentation's linear design will put your ideas front-and-center. This design is high-tech the theme colors and icons are sure to make an inspiring first impression on your audience. This can be used for business presentations, academic projects and conferences. This template consists of 26 slides that will bring your ideas to the next level by putting emphasis on key points and keeping your ideas concise and organized.


6 slides
App Design Mockup
Showcase your app UI in a bold, creative way with this vibrant slide layout. Featuring dynamic smartphone mockups and modern graphic accents, it's ideal for app demos, portfolio highlights, or feature walkthroughs. Fully editable in PowerPoint, Keynote, and Google Slides—customize fonts, colors, and layouts to suit your brand.


5 slides
Business KPI Performance Presentation
Bring your business results to life with a clear, modern layout designed to showcase key metrics and performance goals. Perfect for tracking growth, progress, and success indicators, this visual design helps make data easy to understand and engaging. Fully editable in PowerPoint, Keynote, and Google Slides.


6 slides
Business Idea Presentation for Investors Presentation
Present your business concept with clarity using the Business Idea Presentation for Investors. This unique hexagon-centric layout highlights six key pillars of your idea—perfect for showcasing problem-solving, market fit, innovation, competitive advantage, scalability, and profitability. Each point includes customizable icons and text, allowing you to adapt it to your pitch needs. Clean, visually balanced, and easy to edit in PowerPoint, Keynote, or Google Slides, this slide is ideal for entrepreneurs, founders, and startup teams seeking investment and buy-in.


6 slides
Project Cycle Infographics
The "Project Cycle" infographic template is a meticulously designed resource, ideal for project managers, team leaders, and business analysts. This template facilitates a clear and comprehensive presentation of the various stages involved in a project, from initiation to completion. This template encompasses essential elements of the project cycle, including project initiation, planning, execution, monitoring, and closure. The structured design ensures each phase is distinctly represented, allowing for detailed exploration of timelines, resource allocation, and milestone achievements. This makes it an excellent tool for project planning meetings, stakeholder briefings, and team workshops. The design is professional and methodical, featuring a color scheme that is both engaging and indicative of progression and clarity. This not only enhances the visual appeal of the presentation but also aids in effectively communicating the sequential and cyclical nature of project management. Whether it's used in corporate boardrooms or educational settings, this template guarantees that your project cycle is presented in a detailed, visually compelling, and easily understandable manner.
8 slides
Key Project Milestone Tracker
Stay on top of progress with this streamlined Key Project Milestone Tracker. Designed to showcase up to eight critical milestones with corresponding years, this timeline helps visualize project phases and deadlines clearly. Fully editable in PowerPoint, Keynote, and Google Slides for easy customization.


7 slides
Mission Infographic
The showcased templates are meticulously designed to articulate the mission of an organization effectively, making them an invaluable tool for any corporate or non-profit entity aiming to communicate its core purpose and objectives. Each slide is crafted to guide the audience through the foundational elements that define the company’s ethos, goals, and strategic approaches. These templates feature a clean and professional layout, incorporating subtle design elements that draw attention without overwhelming the content. They utilize a harmonious blend of typography, iconography, and spacing, which helps in making the presentation not only visually appealing but also highly readable. The versatility of these templates allows them to be adapted for various contexts, whether it's part of an employee onboarding packet, investor presentations, or external company introductions. The color schemes and design motifs can be customized to align with specific brand guidelines, ensuring consistency across all corporate communications. By employing these slides, organizations can effectively communicate their mission, foster a cohesive understanding among stakeholders, and reinforce their commitment to their foundational values and objectives. This not only enhances internal morale but also strengthens the organization’s image externally, making these templates a strategic asset for any business.


6 slides
5G Network Infographic
5G, short for fifth-generation wireless technology, is the latest generation of mobile network technology designed to provide faster, more reliable, and higher capacity wireless communication. This infographic template is designed to educate viewers about the key features, benefits, and impact of 5G technology on various aspects of our lives. This template aims to provide a comprehensive and easy-to-understand overview of the transformative capabilities of 5G technology. It serves as a valuable resource for individuals, businesses, and organizations seeking to understand the potential impact and benefits of 5G on various aspects of our lives and the broader technological landscape.
20 slides
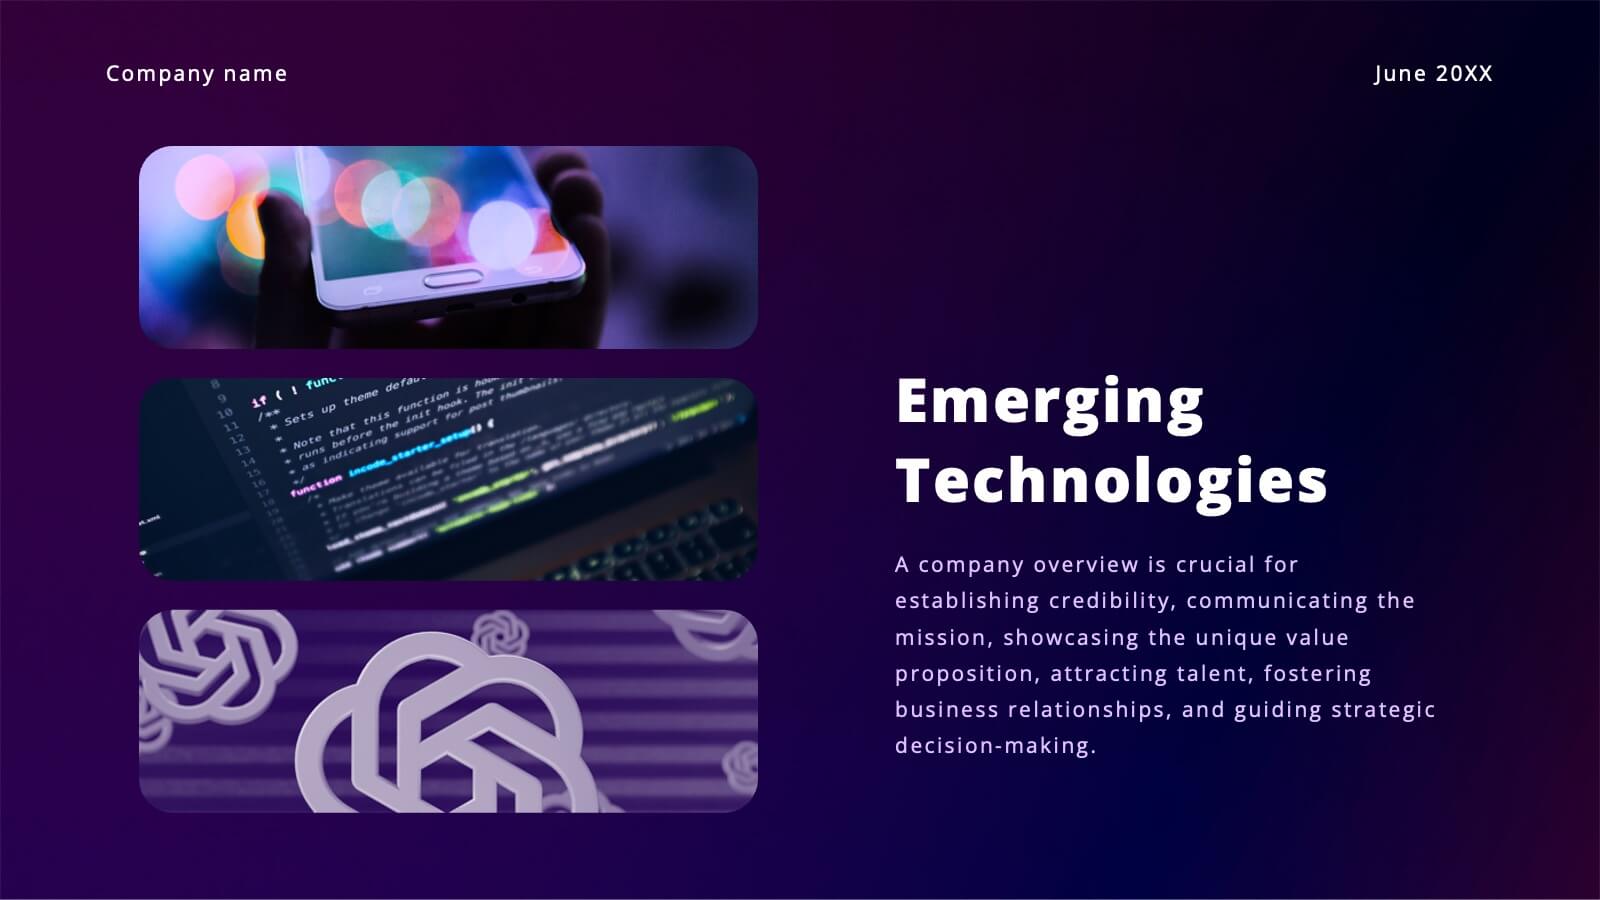
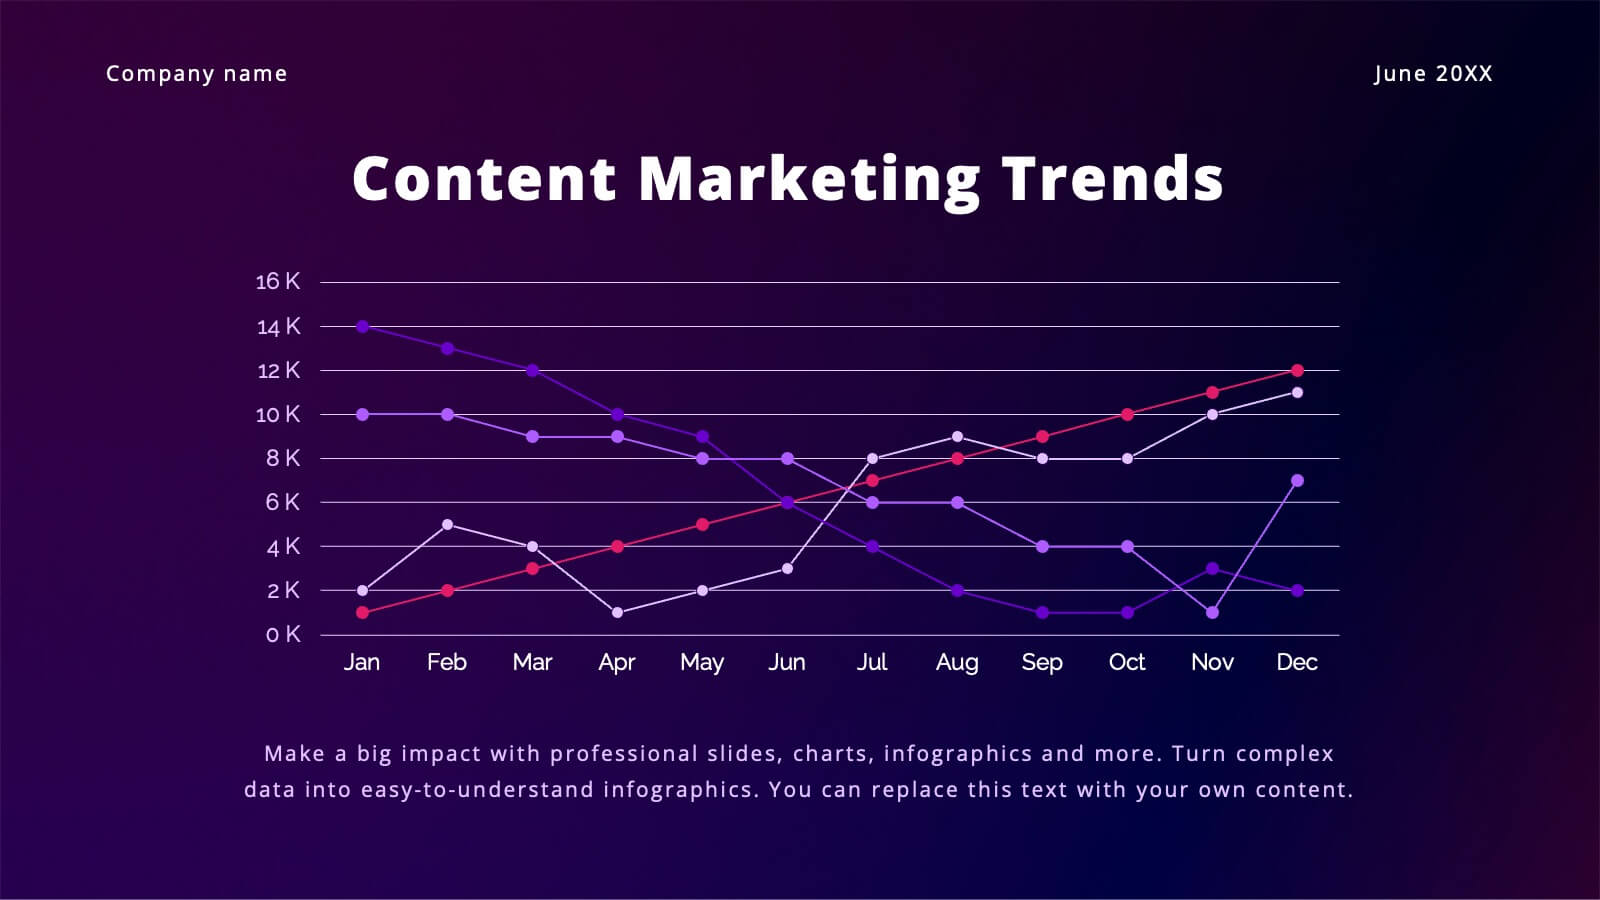
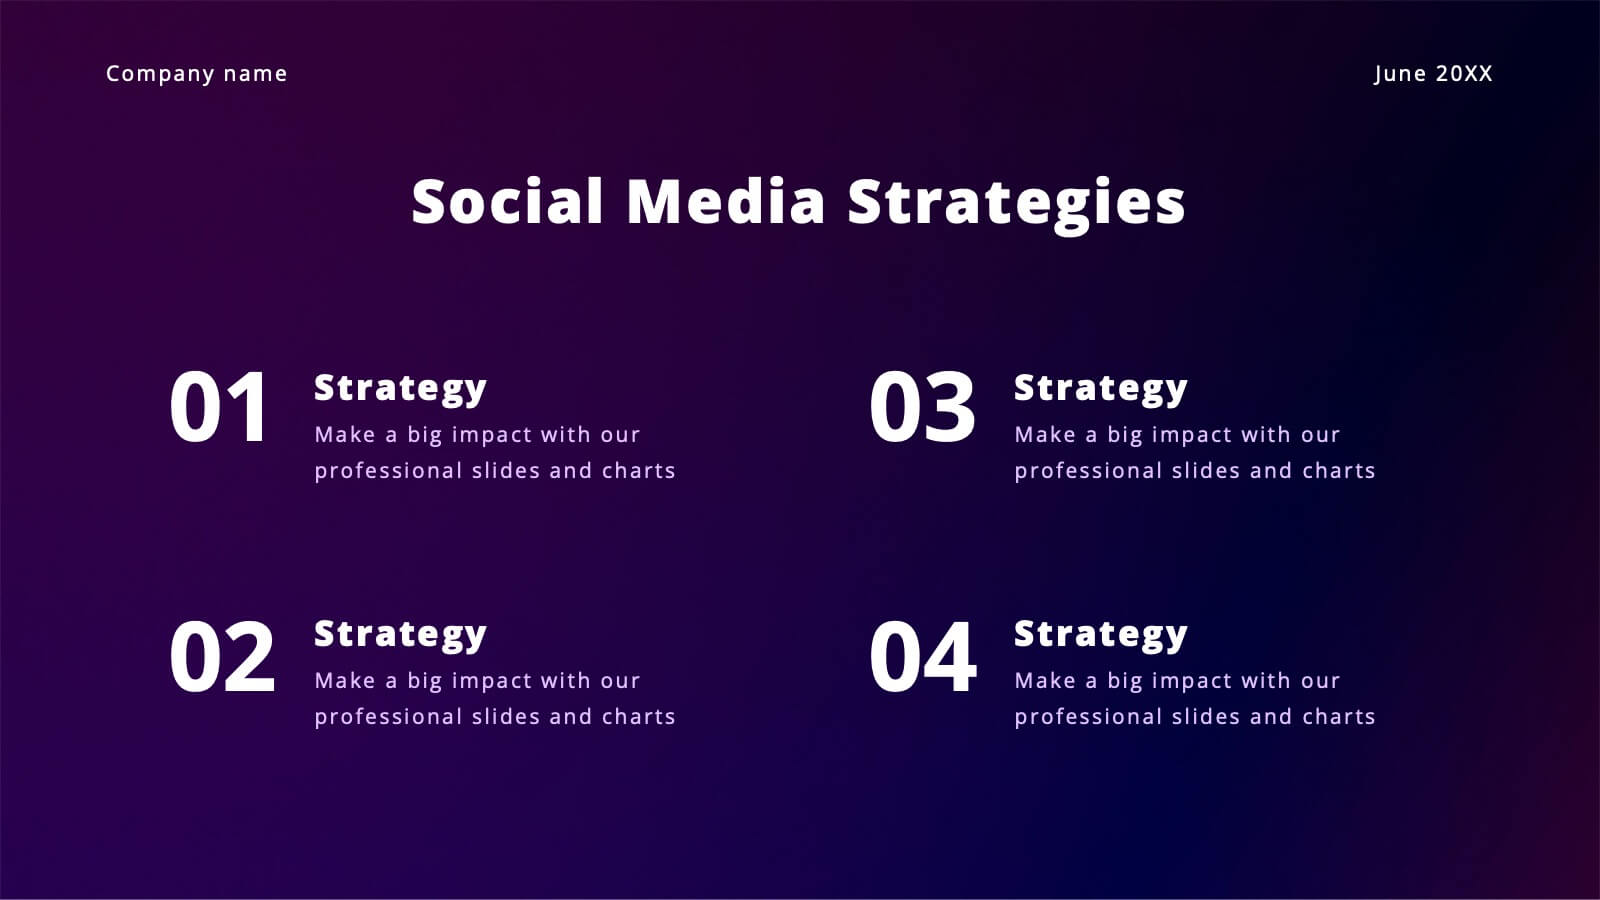
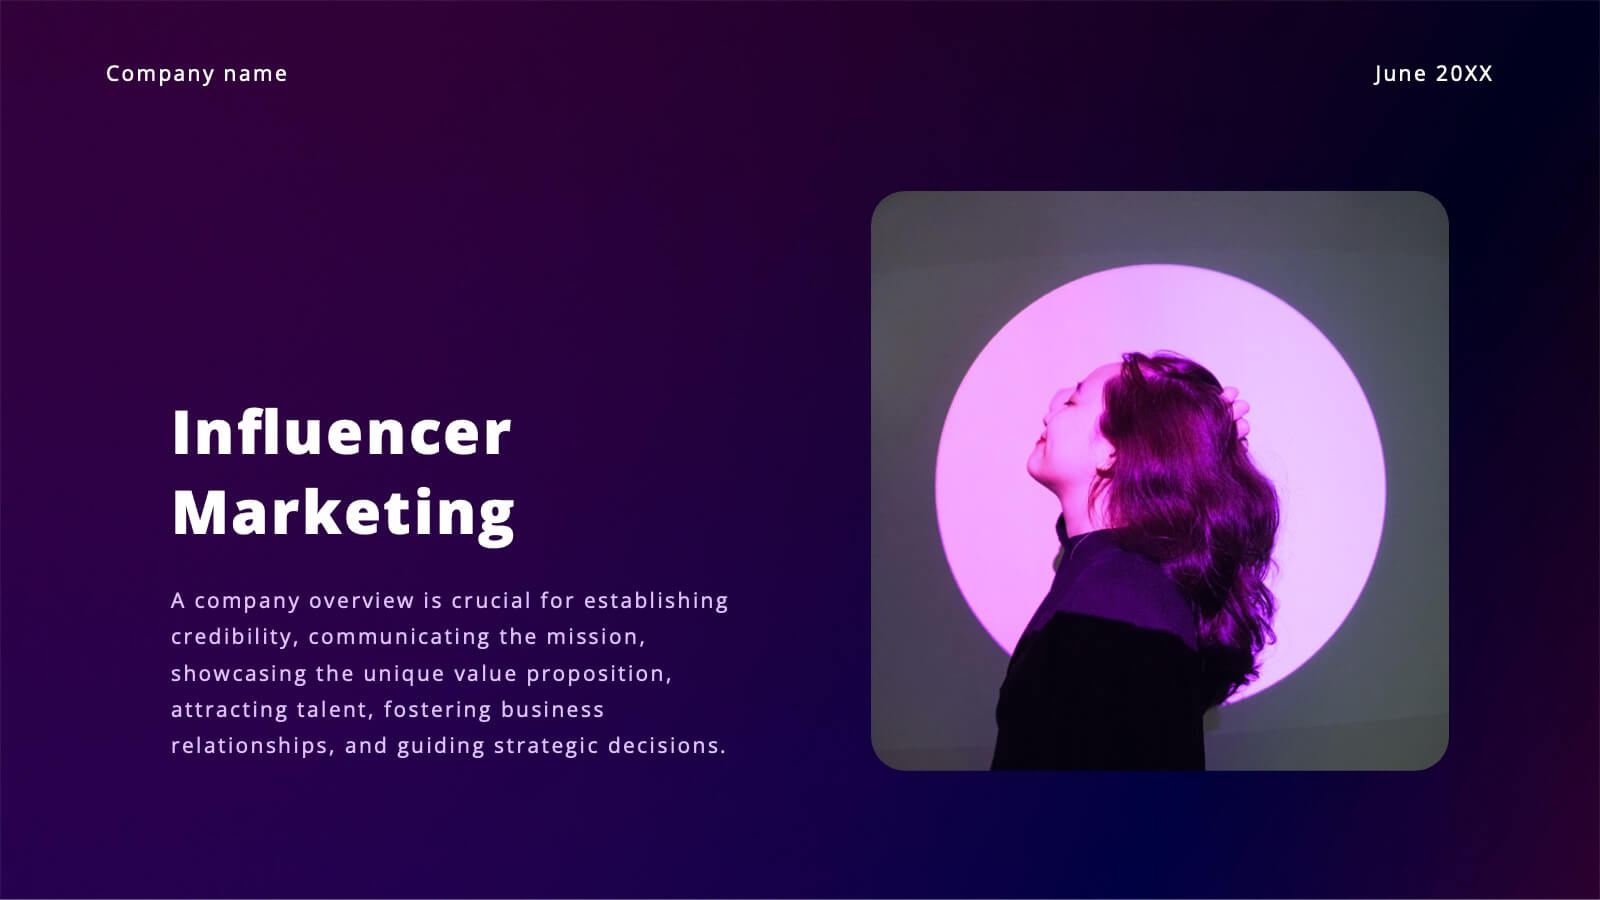
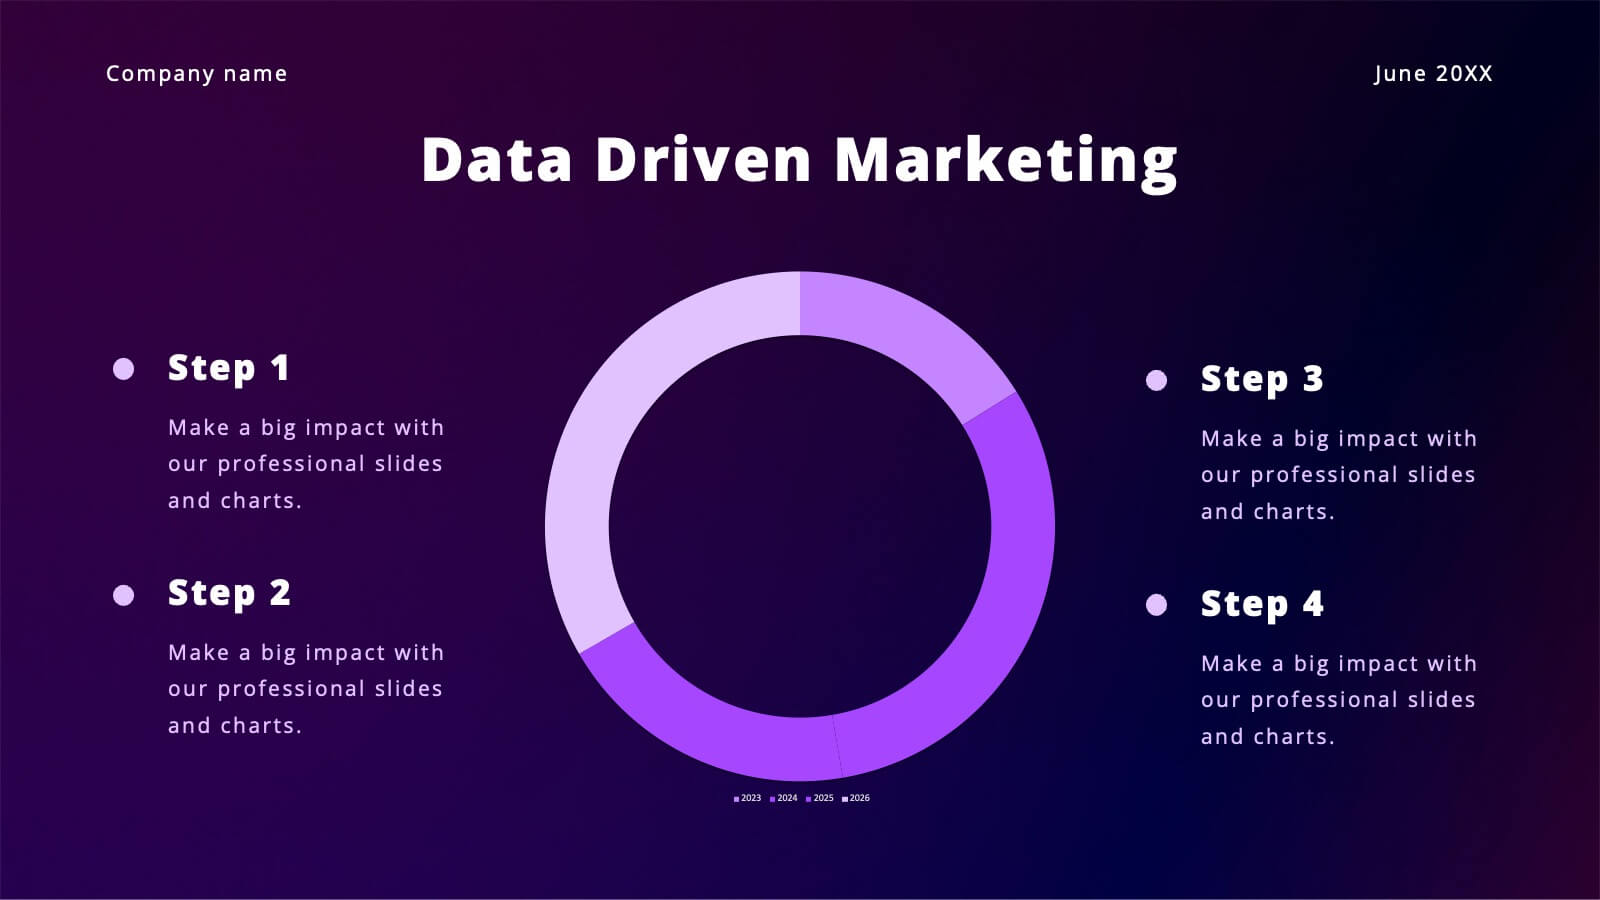
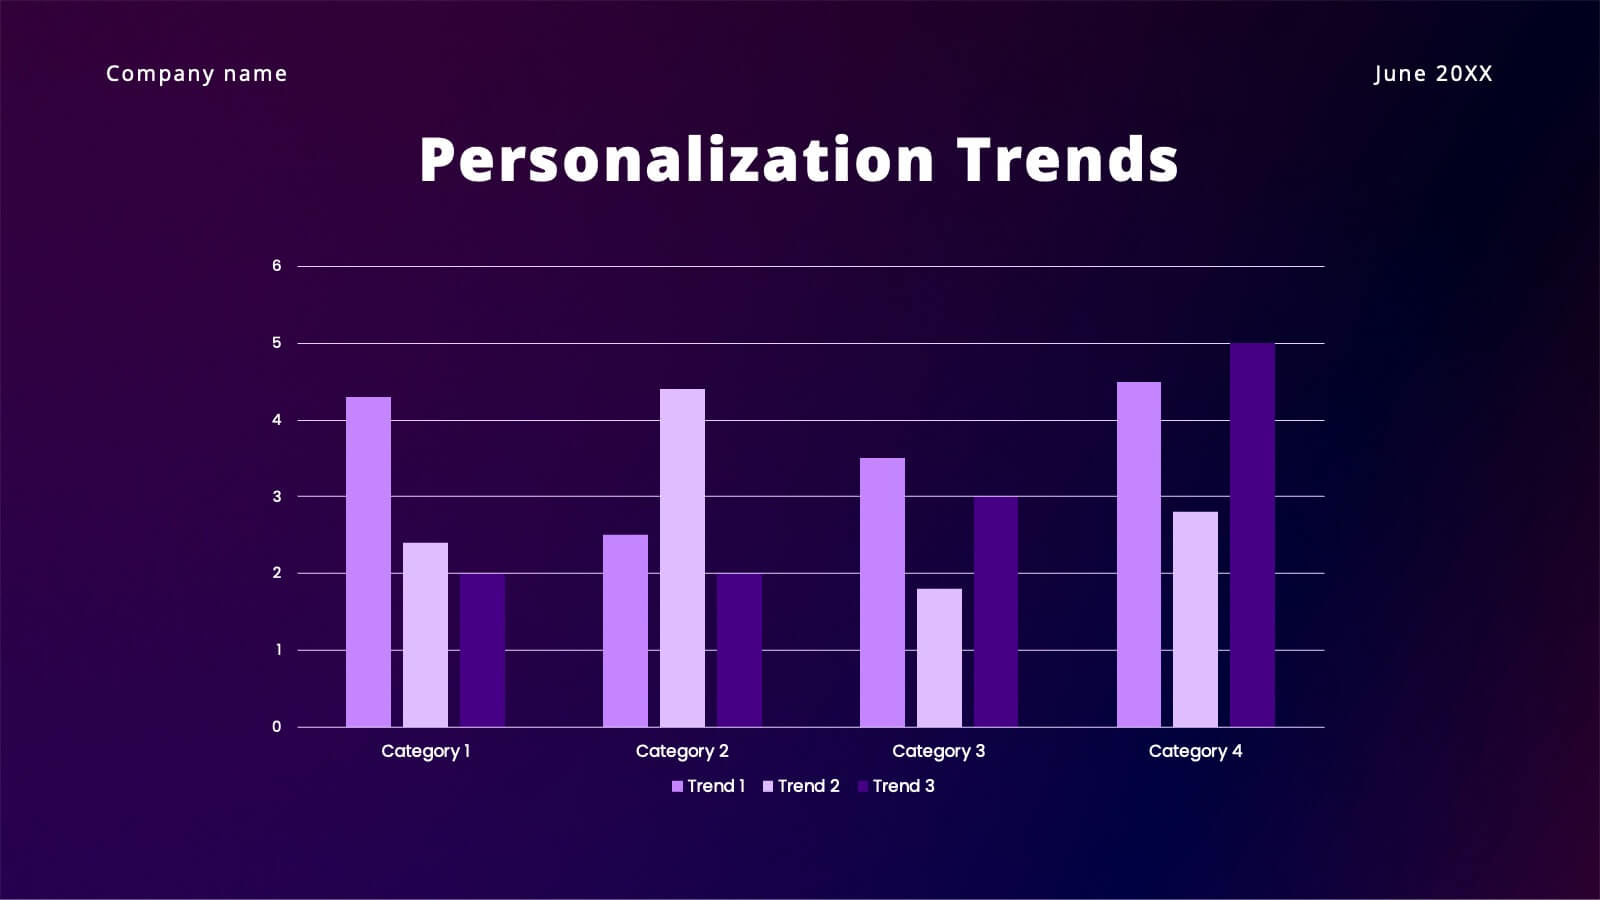
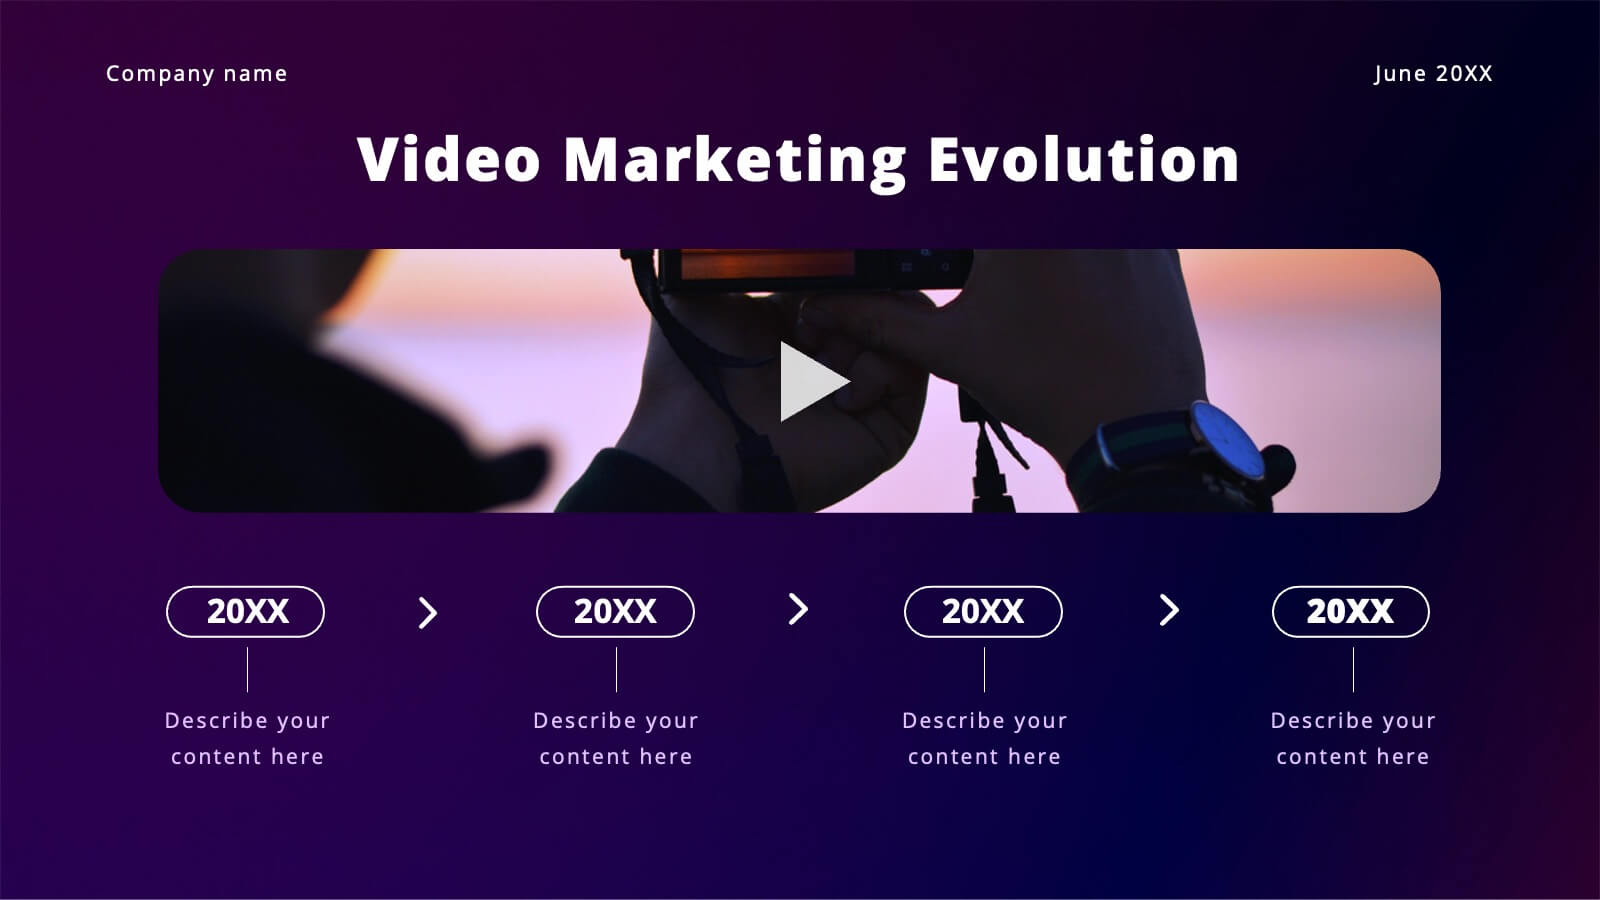
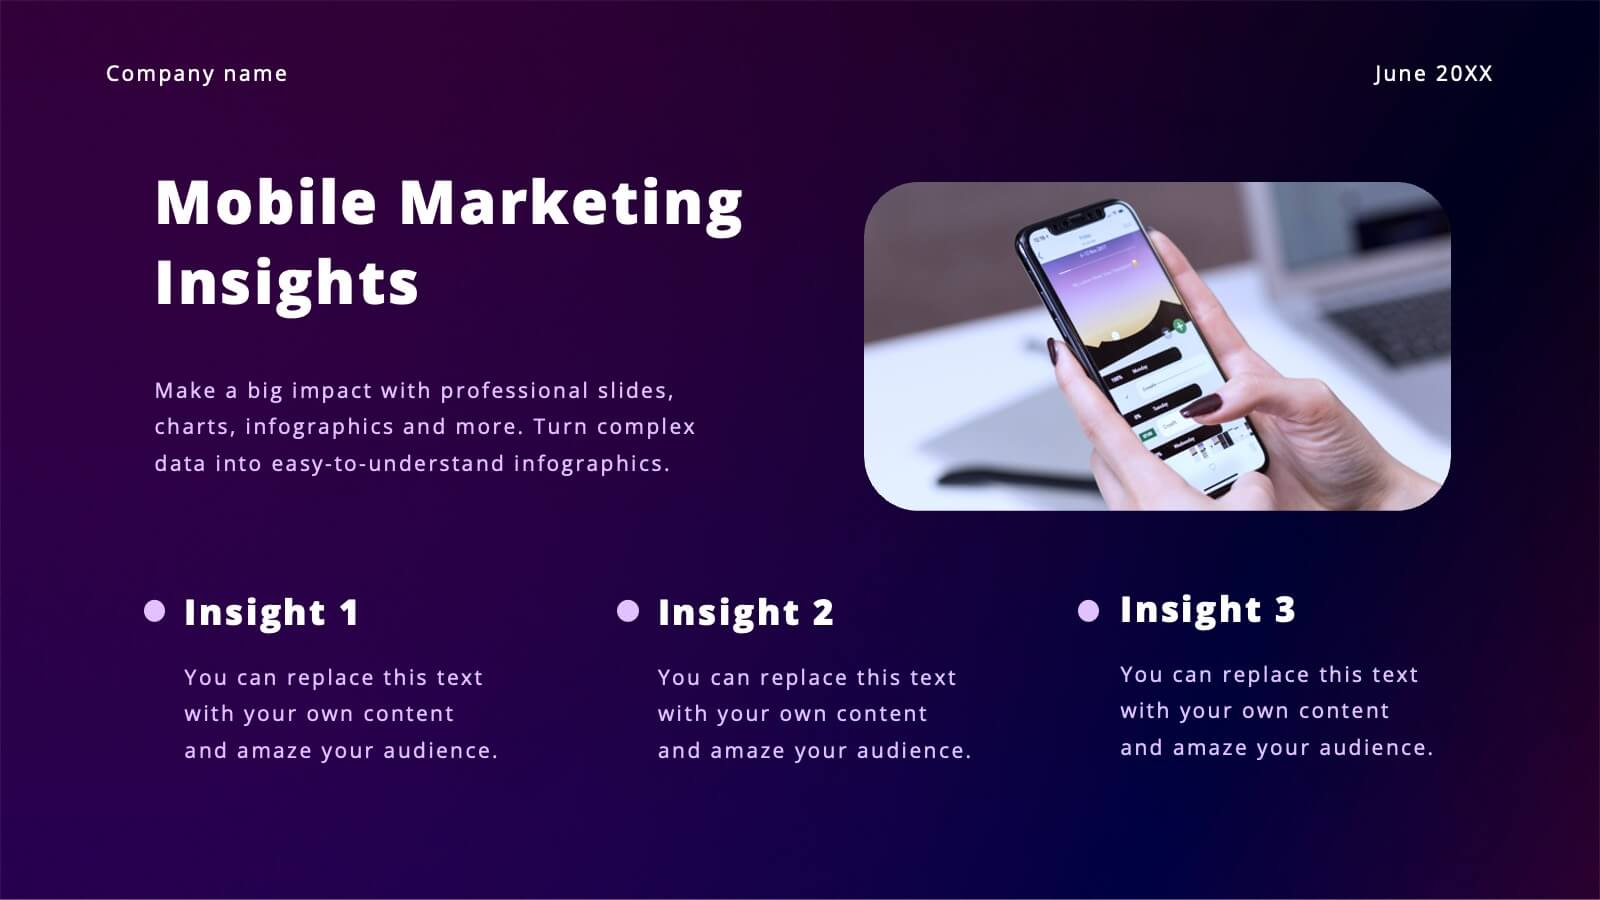
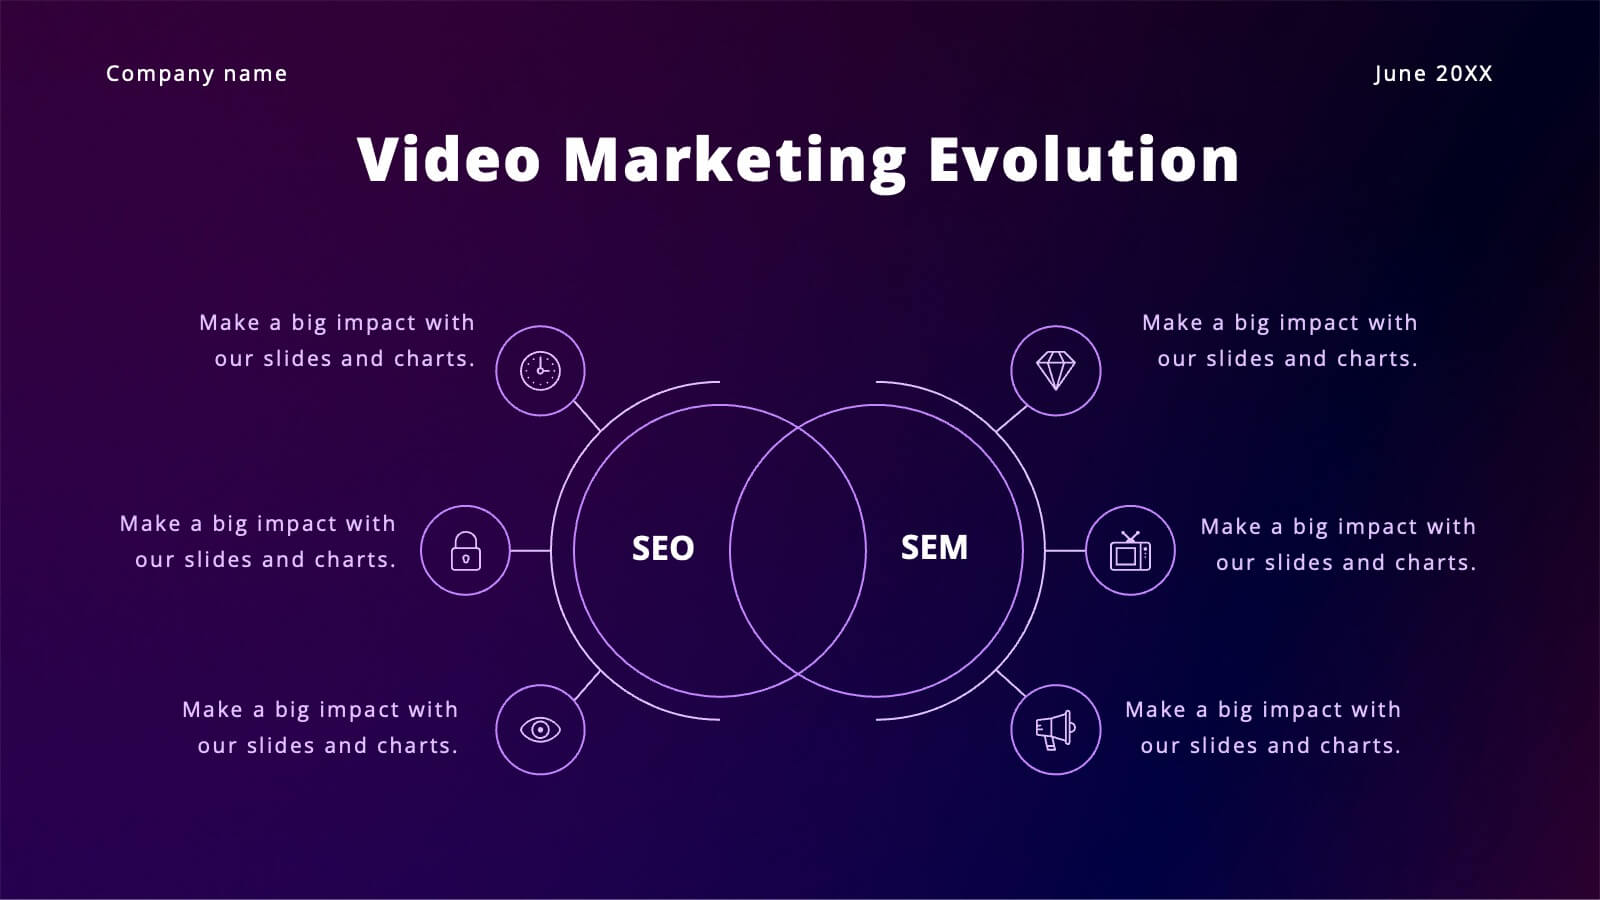
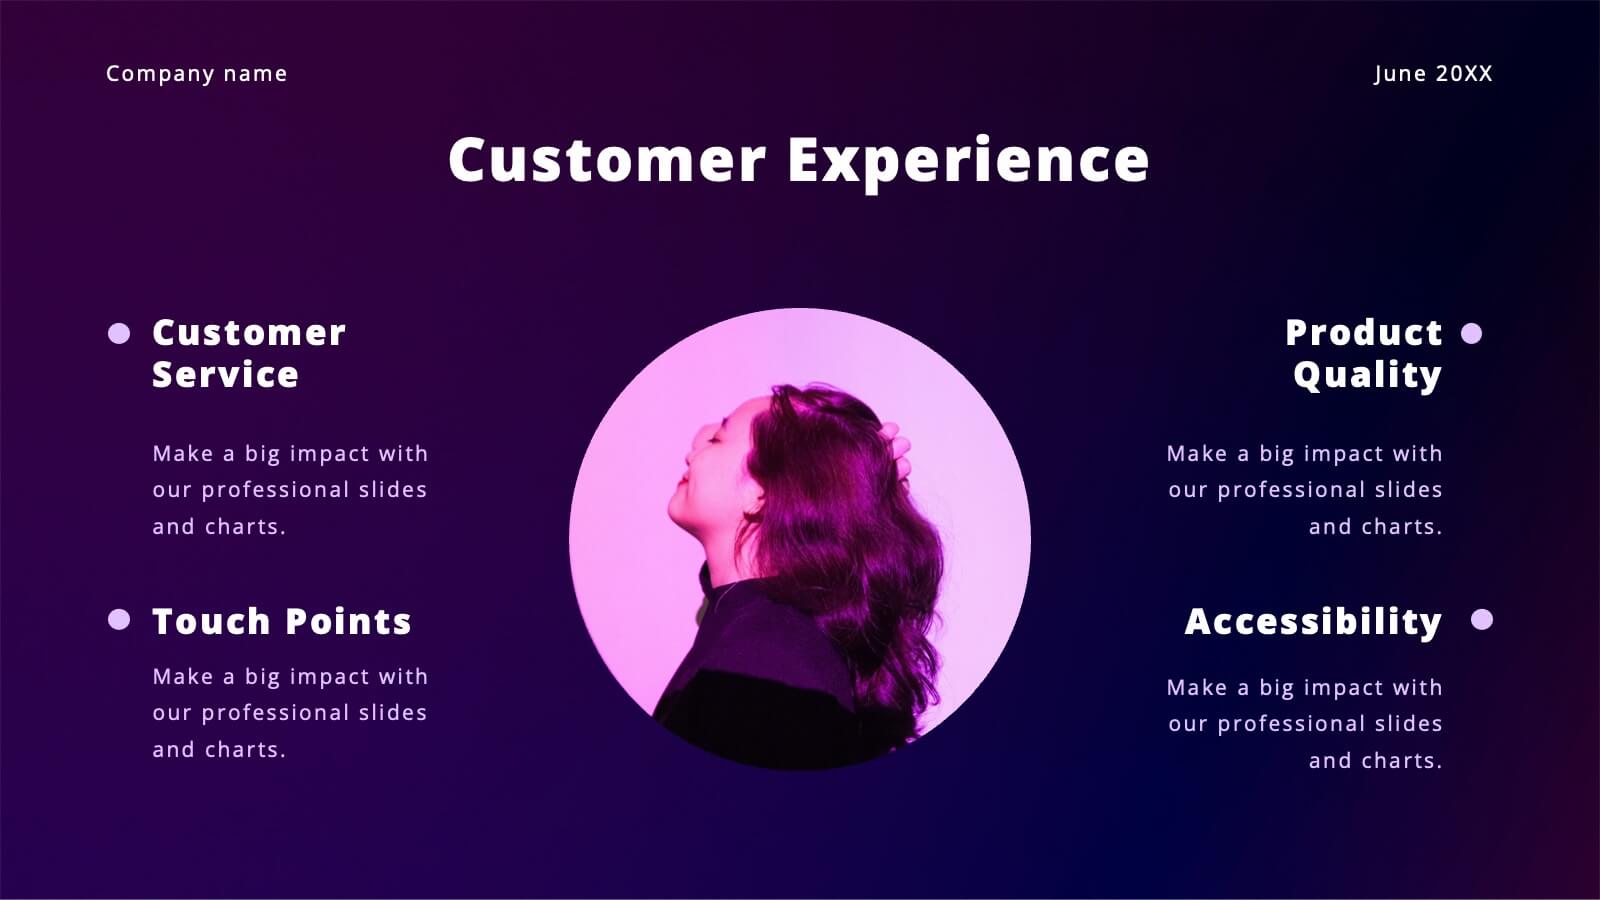
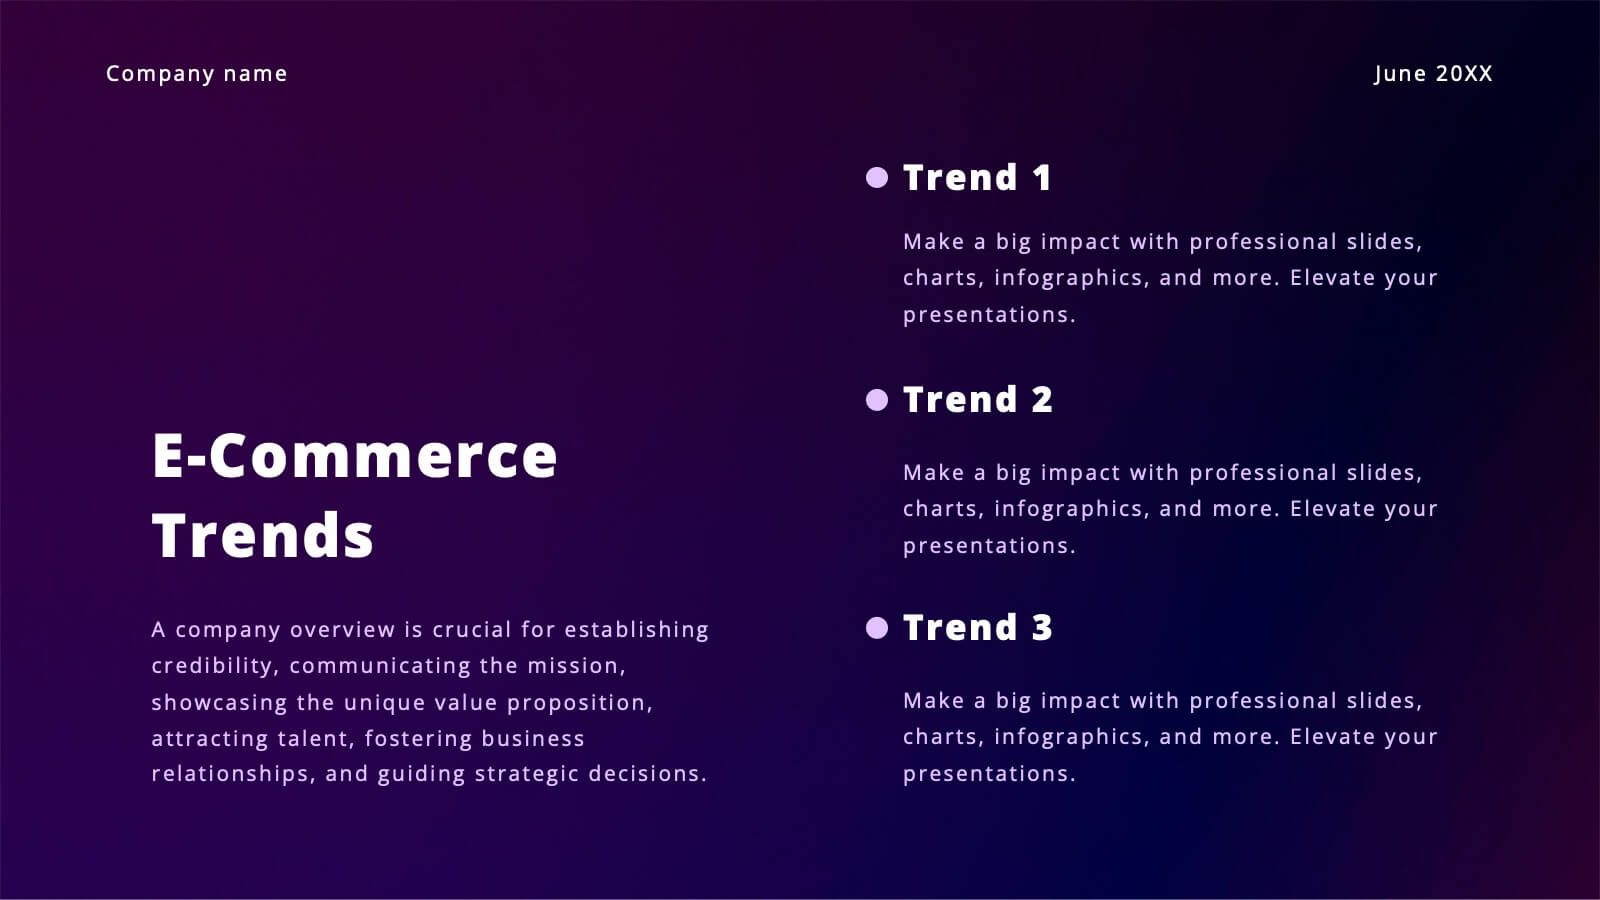
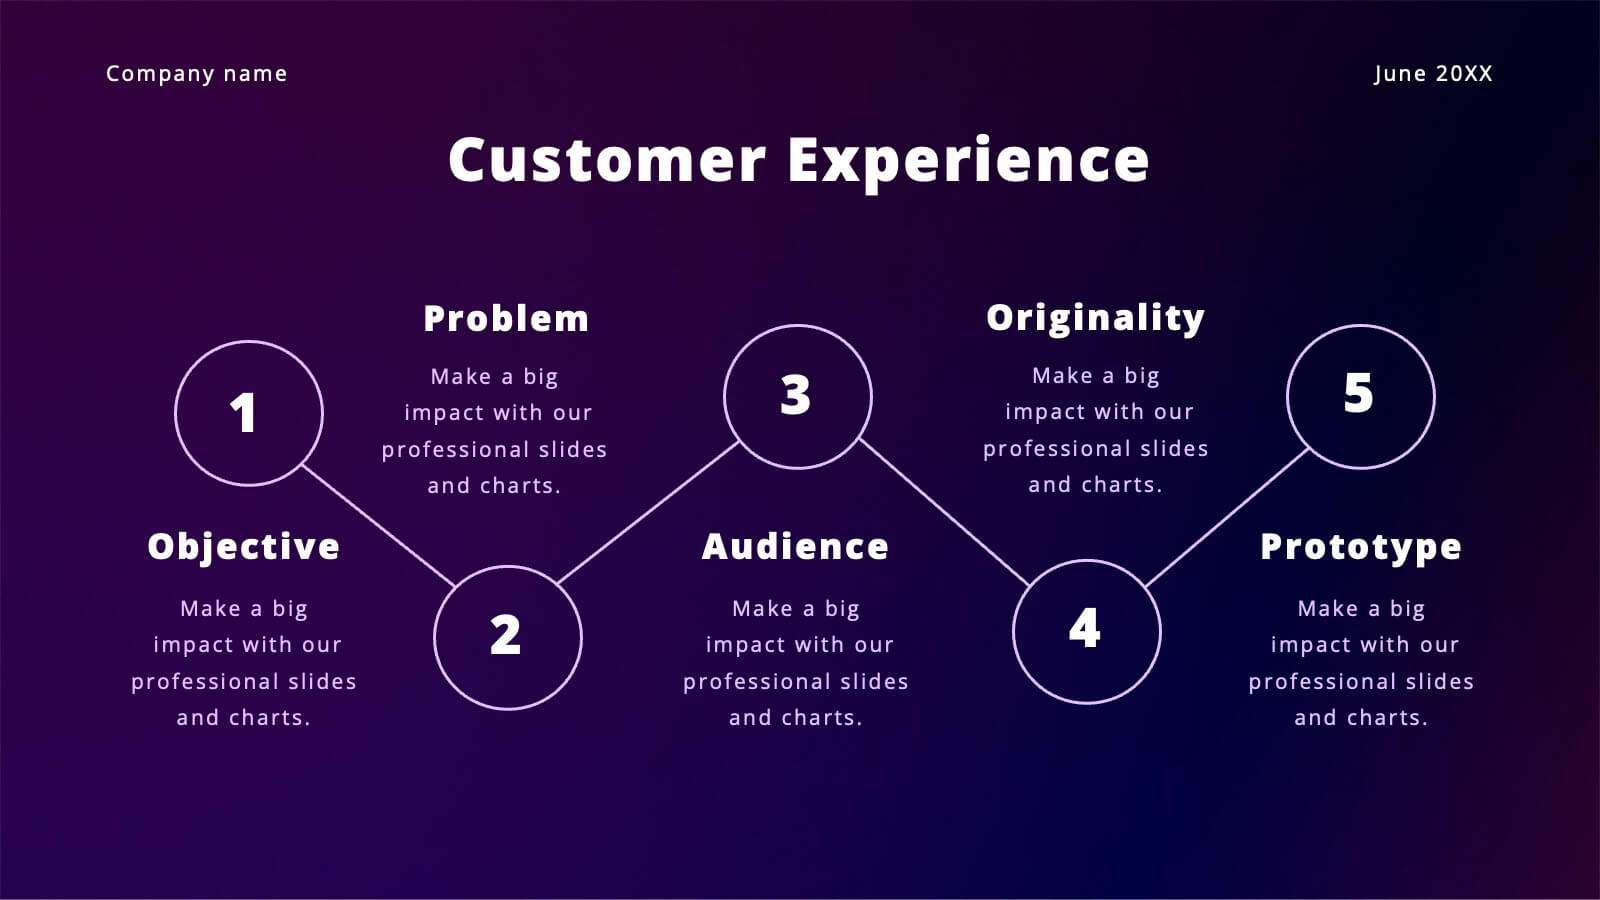
Vibrant Content Marketing Pitch Deck Presentation
Boost your marketing pitch with this vibrant deck! Covering industry overviews, customer behavior analysis, and emerging technologies, it’s designed to captivate your audience. Highlight social media strategies, data-driven marketing, and e-commerce trends effortlessly. Perfect for presenting a comprehensive marketing plan. Compatible with PowerPoint, Keynote, and Google Slides. Make your next pitch stand out!


5 slides
Office Collaboration Illustration Pack Presentation
Visualize modern teamwork with this sleek office collaboration layout. Ideal for showcasing brainstorming sessions, decision-making flows, or team communication, this illustration-driven template is perfect for business updates, internal strategy briefs, or workflow discussions. Fully editable and compatible with PowerPoint, Keynote, and Google Slides.


20 slides
Storynix New Product Proposal Presentation
This beautifully designed presentation template is your perfect tool to showcase a new product with style and professionalism. It covers everything from company overview and product features to pricing strategies and distribution plans, ensuring a comprehensive and persuasive pitch. Compatible with PowerPoint, Keynote, and Google Slides for seamless customization.


6 slides
Social Challenges Infographics
Address social challenges effectively with our Social Challenge infographic template. This template is fully compatible with popular presentation software like PowerPoint, Keynote, and Google Slides, allowing you to easily customize it to illustrate and communicate various social challenges and their solutions. The Social Challenge infographic template offers a visually engaging platform to outline the nature of social issues, their impact on communities, and strategies for addressing them. Whether you're an advocate, nonprofit organization, community leader, or simply interested in making a positive impact, this template provides a user-friendly canvas to create informative presentations and educational materials. Raise awareness and promote solutions with this SEO-optimized Social Challenge infographic template, thoughtfully designed for clarity and ease of use. Customize it to showcase specific social challenges, statistics, success stories, and calls to action, ensuring that your audience gains a comprehensive understanding of the issue at hand. Start crafting your personalized infographic today to contribute to positive change in society.


12 slides
Employee Roles and Professional Profiles
Break down team structure and highlight individual strengths with this modern hub-and-spoke layout—perfect for showcasing employee roles, departments, or professional profiles. Whether you're onboarding, presenting org charts, or outlining responsibilities, this slide keeps it all clear and cohesive. Fully compatible with PowerPoint, Keynote, and Google Slides.


5 slides
Employee Onboarding Training Roadmap Presentation
Visualize your training journey with the Employee Onboarding Training Roadmap Presentation. This layout uses a road-style timeline with trucks to represent each step of the onboarding process—perfect for outlining key milestones, training modules, or departmental introductions. Fully editable in PowerPoint, Keynote, Google Slides, or Canva.