


Features
- 21 Unique Slides
- Fully editable and easy to edit in Microsoft Powerpoint, Keynote and Google Slides
- 16:9 widescreen layout
- Clean and professional designs
- Export to JPG, PDF or send by email


Do you have any questions?
Recommend


6 slides
Blue Ocean Strategy Business Model
Capture new market spaces with this innovative Blue Ocean Strategy slide. Designed with a dynamic hourglass visual, it helps you showcase differentiation and low-cost strategies clearly. Perfect for business strategy sessions, growth planning, and innovation discussions. Fully editable in PowerPoint, Keynote, and Google Slides.


26 slides
Venture Capital Dark Presentation
Present your investment vision with confidence using our Venture Capital presentation template, ideal for PowerPoint, Keynote, and Google Slides. This template is expertly crafted for venture capitalists, startup founders, and financial advisors looking to create persuasive and engaging presentations that attract investment. Our Venture Capital template is designed to showcase the potential of innovative startups to savvy investors. It includes a range of slides that detail market analysis, growth potential, business strategies, and investment opportunities, all laid out in an easy-to-understand format. With this template, you can effectively communicate complex financial data and investment propositions through clear visuals and concise text. Featuring customizable charts, graphs, and diagrams, the template allows for a personalized touch, making it easier to highlight the unique selling points of investment opportunities. Whether you're presenting to angel investors, venture capital firms, or at a funding pitch, this template will help you to articulate your message with clarity and impact. Increase the visibility of your venture capital presentations with our SEO-optimized template and position yourself as a thought leader in the field of investment and startup growth.


22 slides
Radiance UX Research Report Presentation
This engaging UX research report template is designed to captivate your audience! With sections like user research, journey mapping, prototyping, and testing, it showcases the entire UX process effortlessly. Fully customizable and compatible with PowerPoint, Keynote, and Google Slides, this template is perfect for presenting your design insights with professionalism and flair.


10 slides
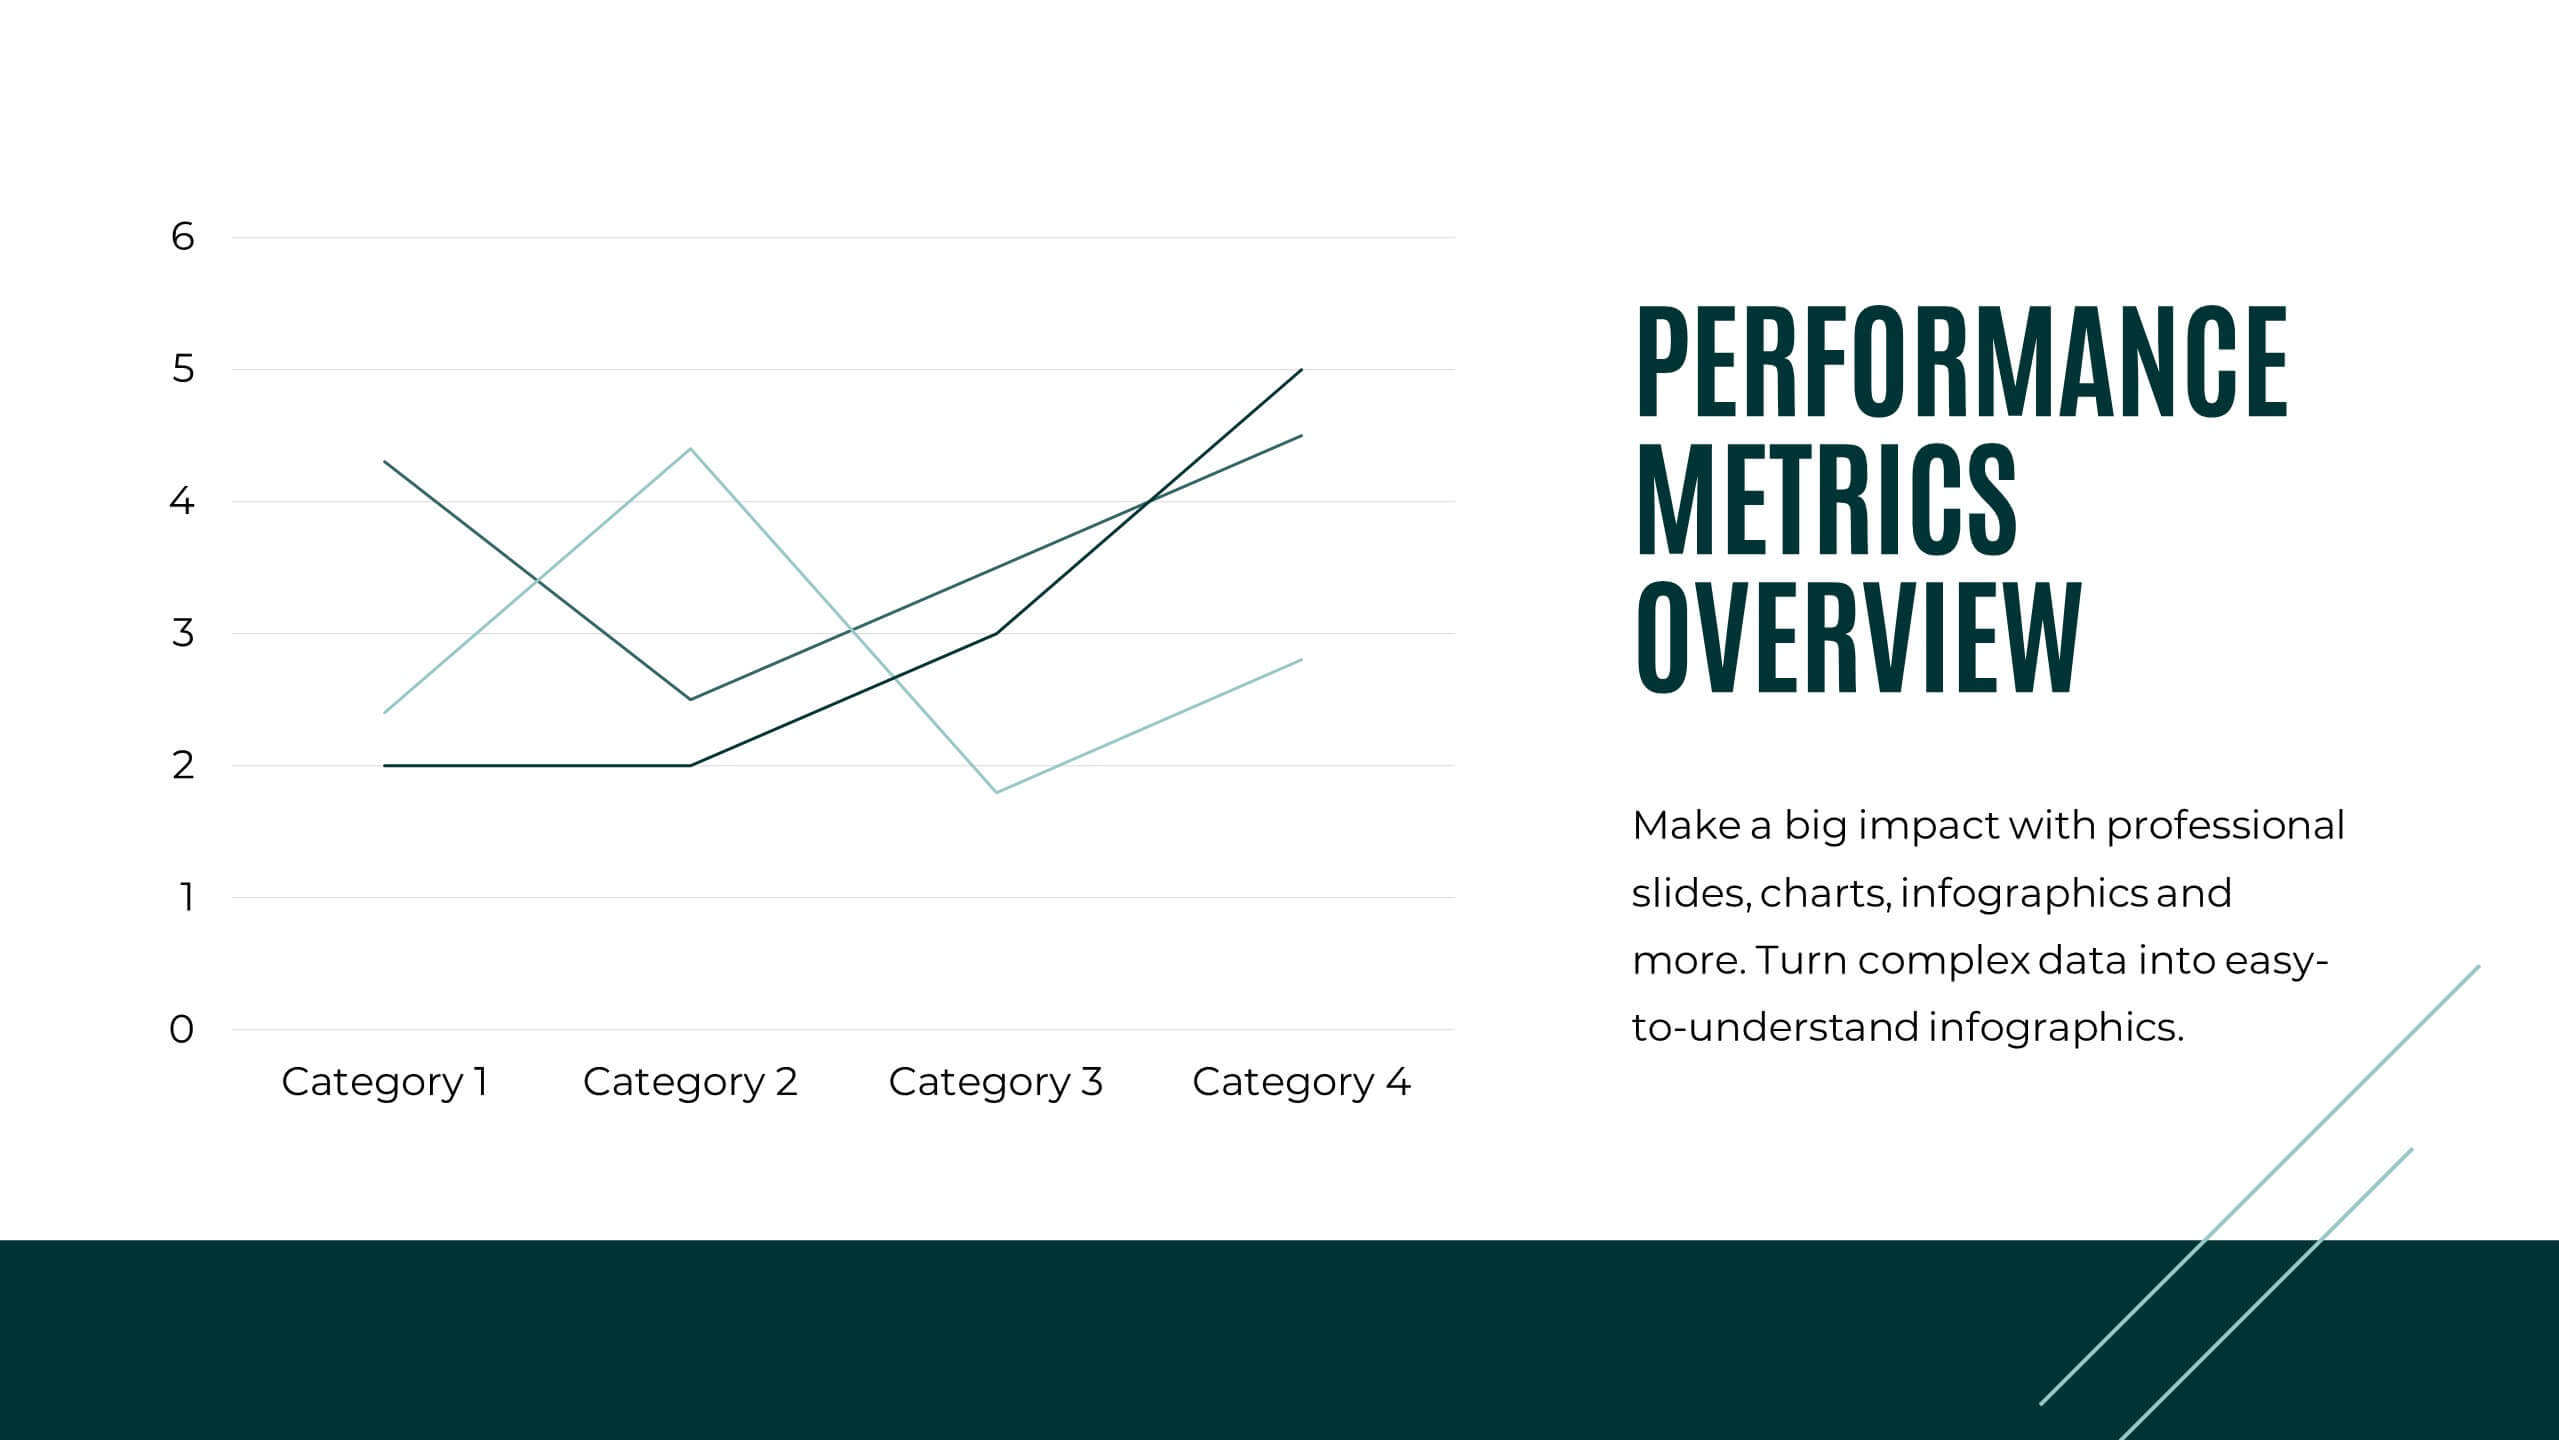
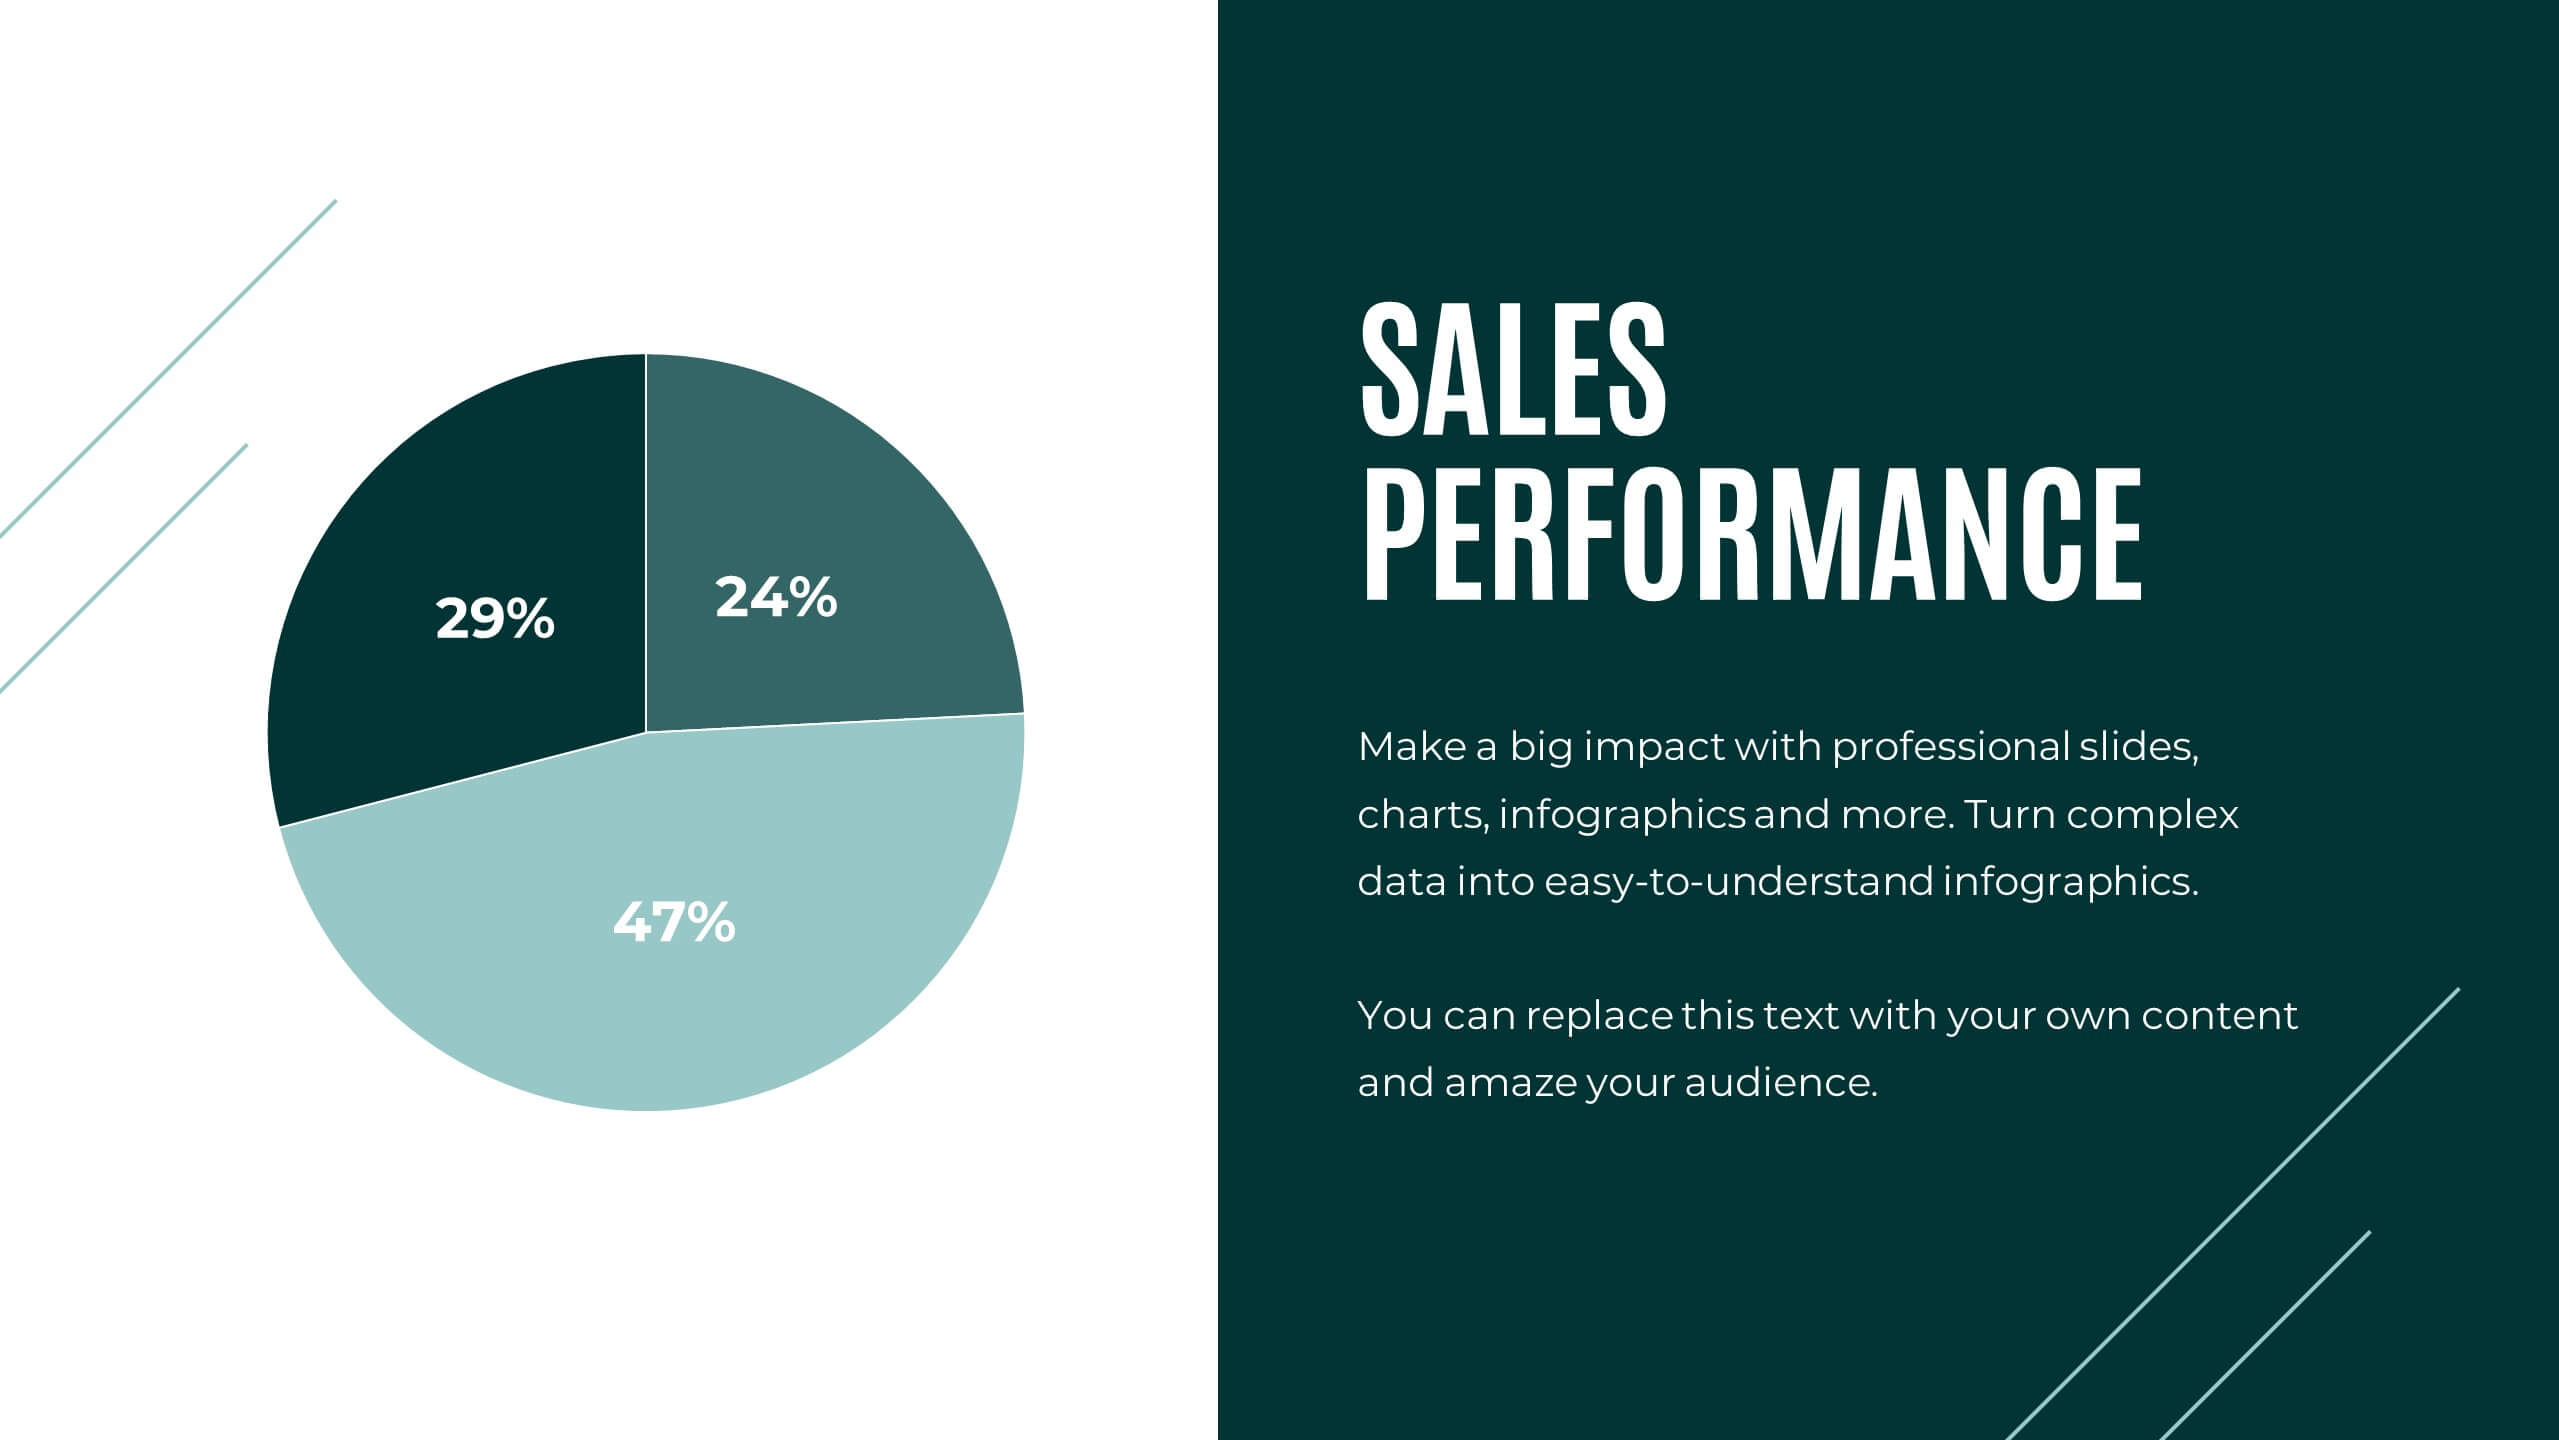
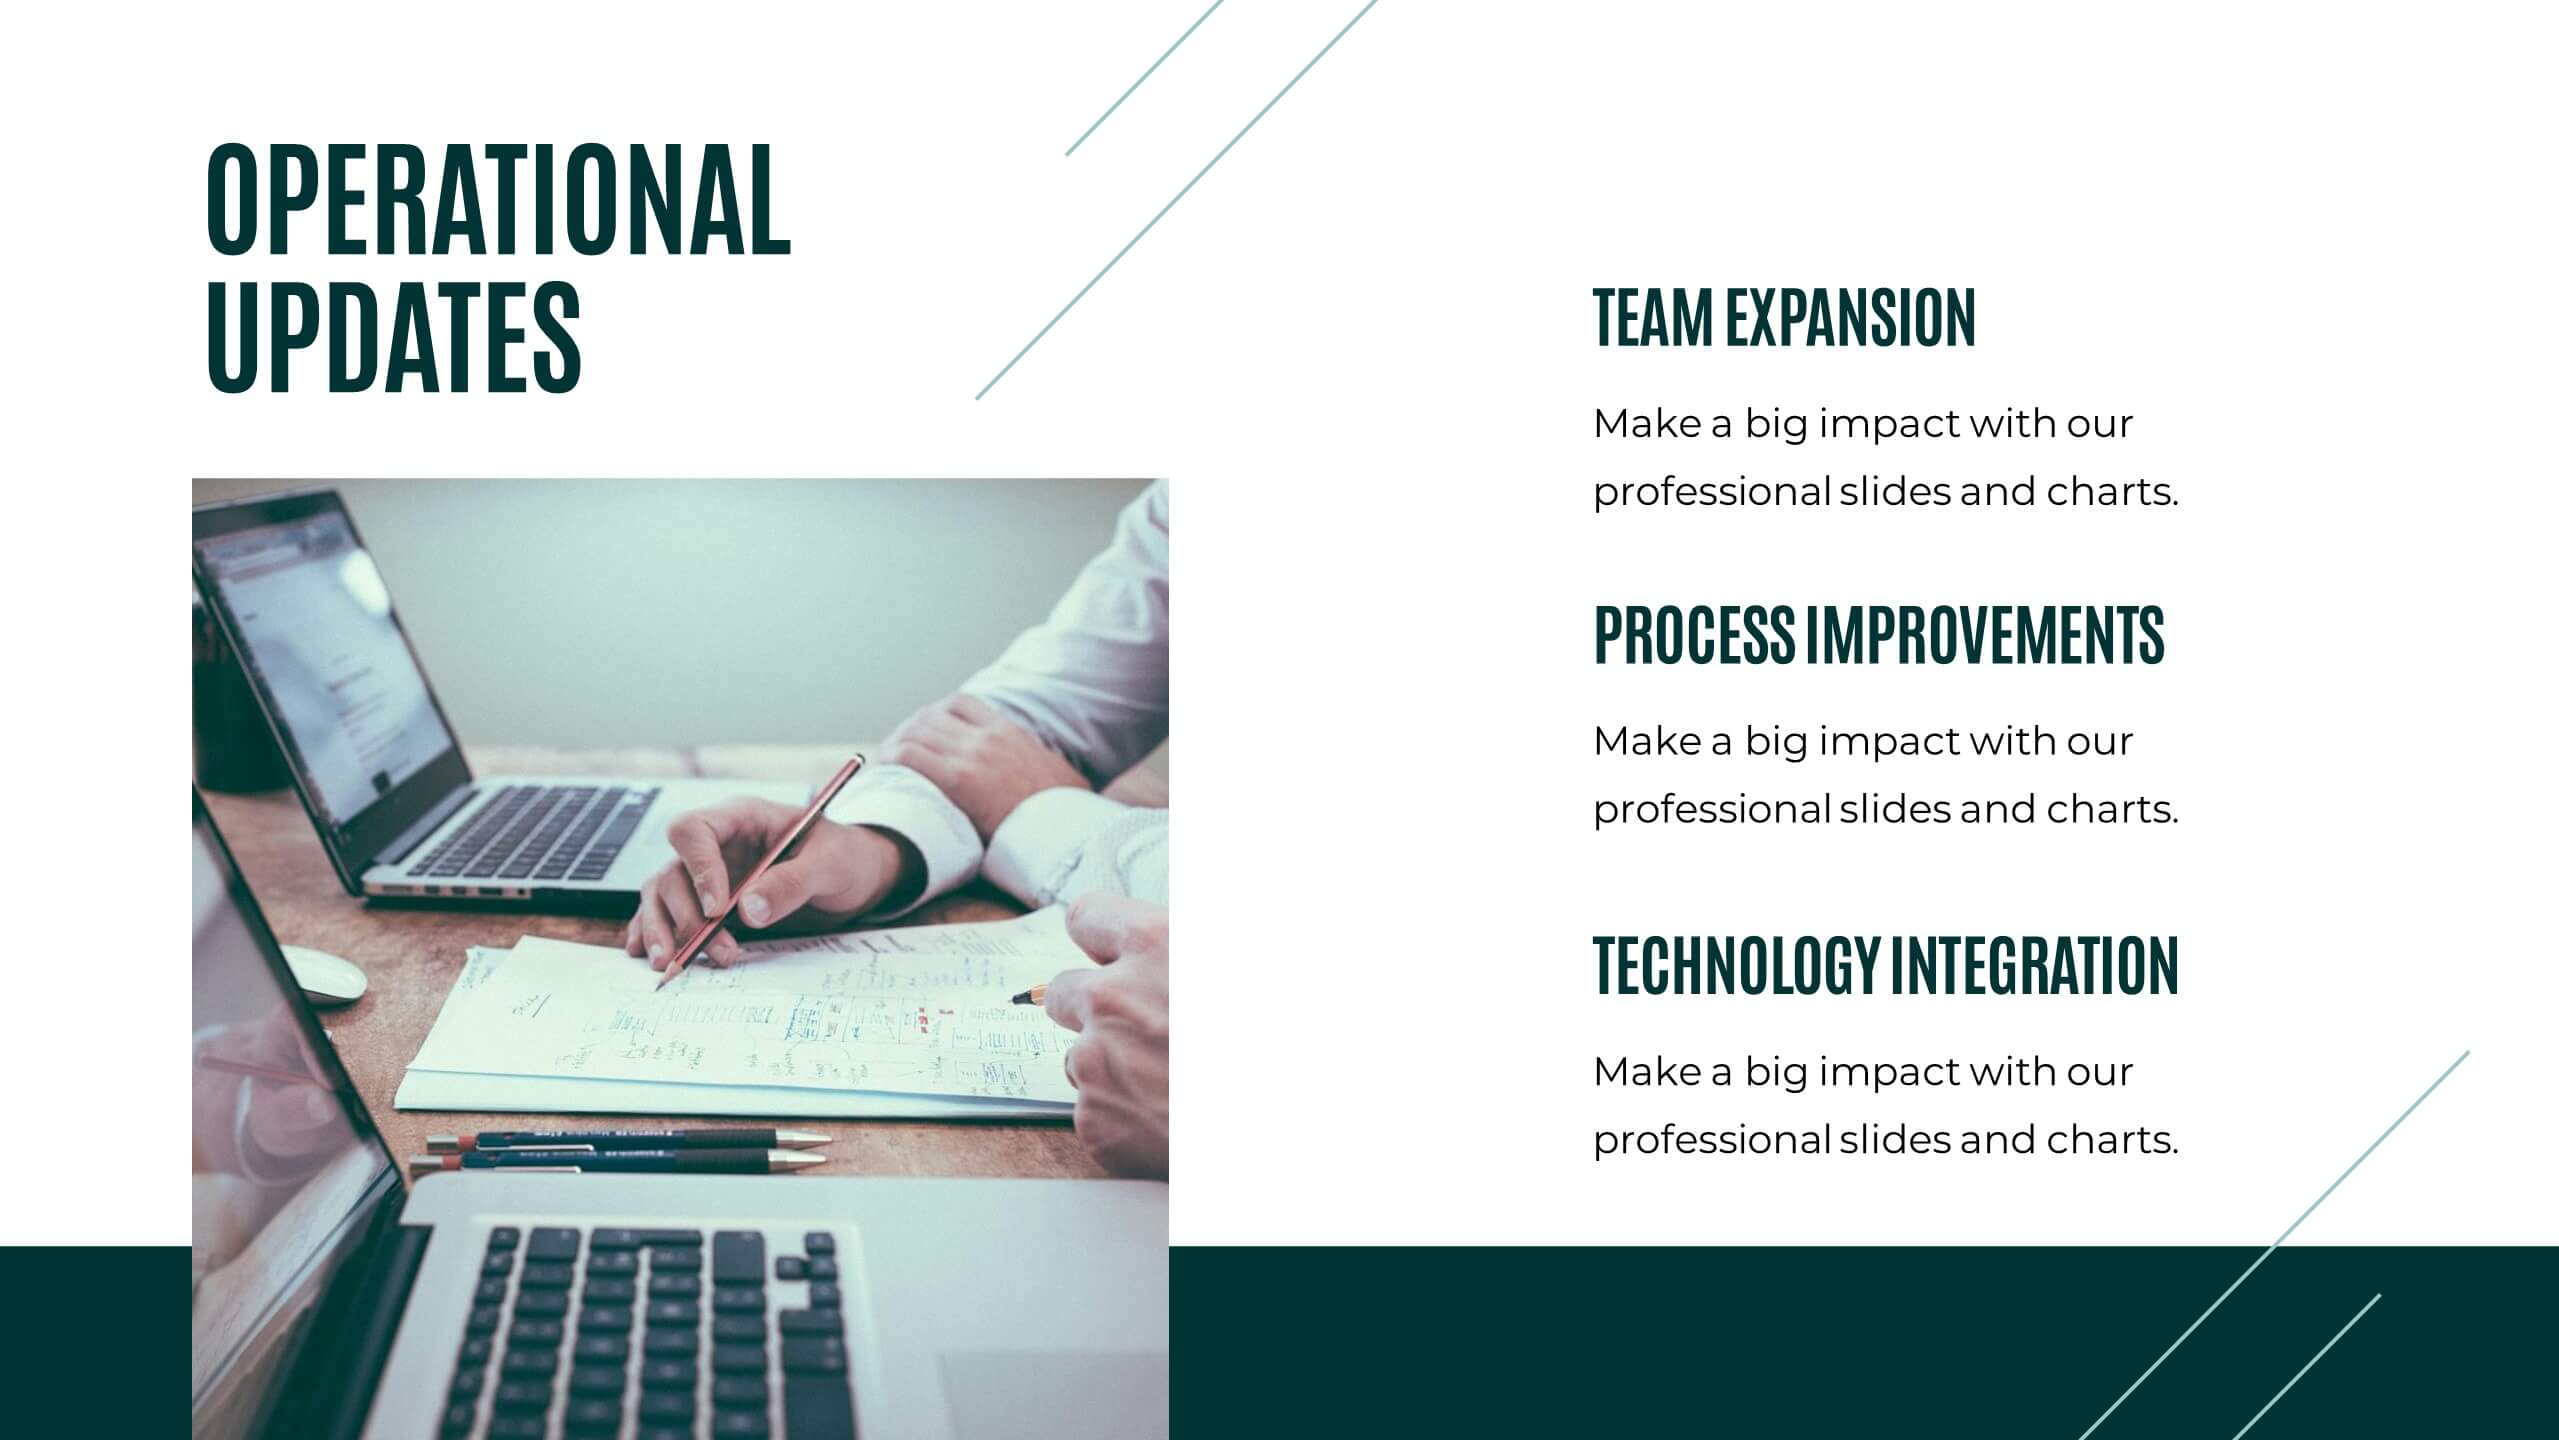
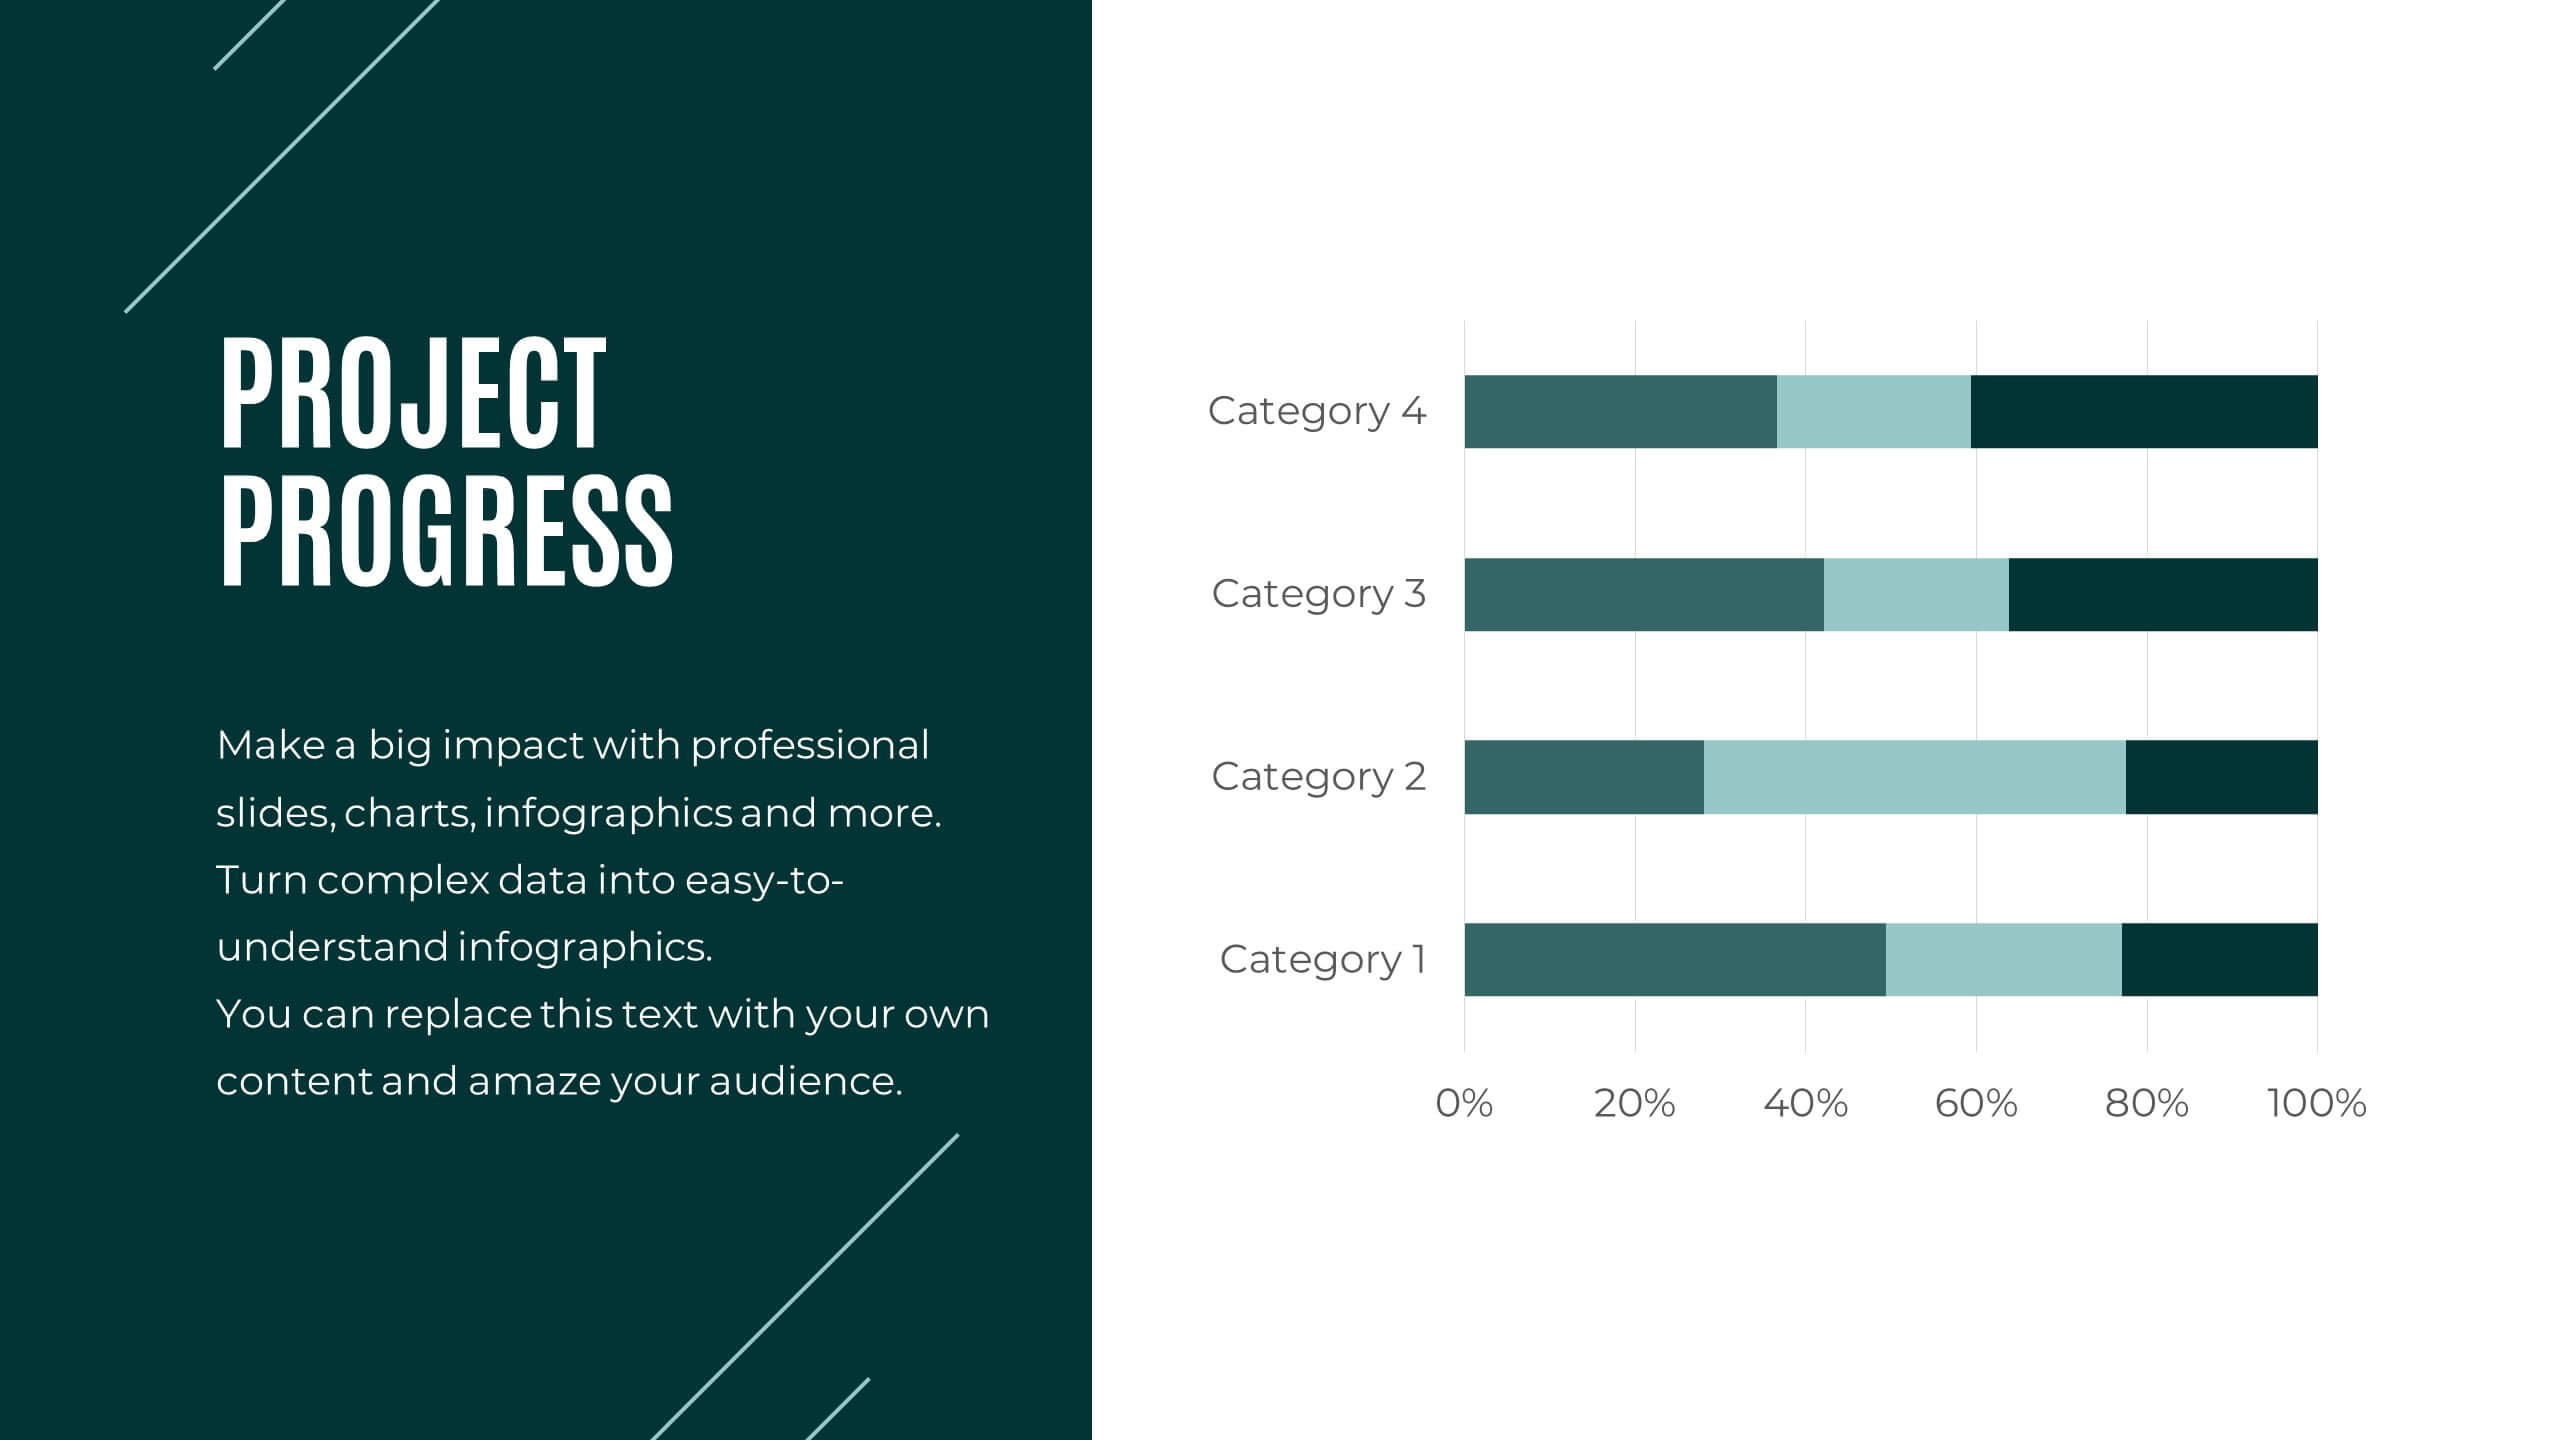
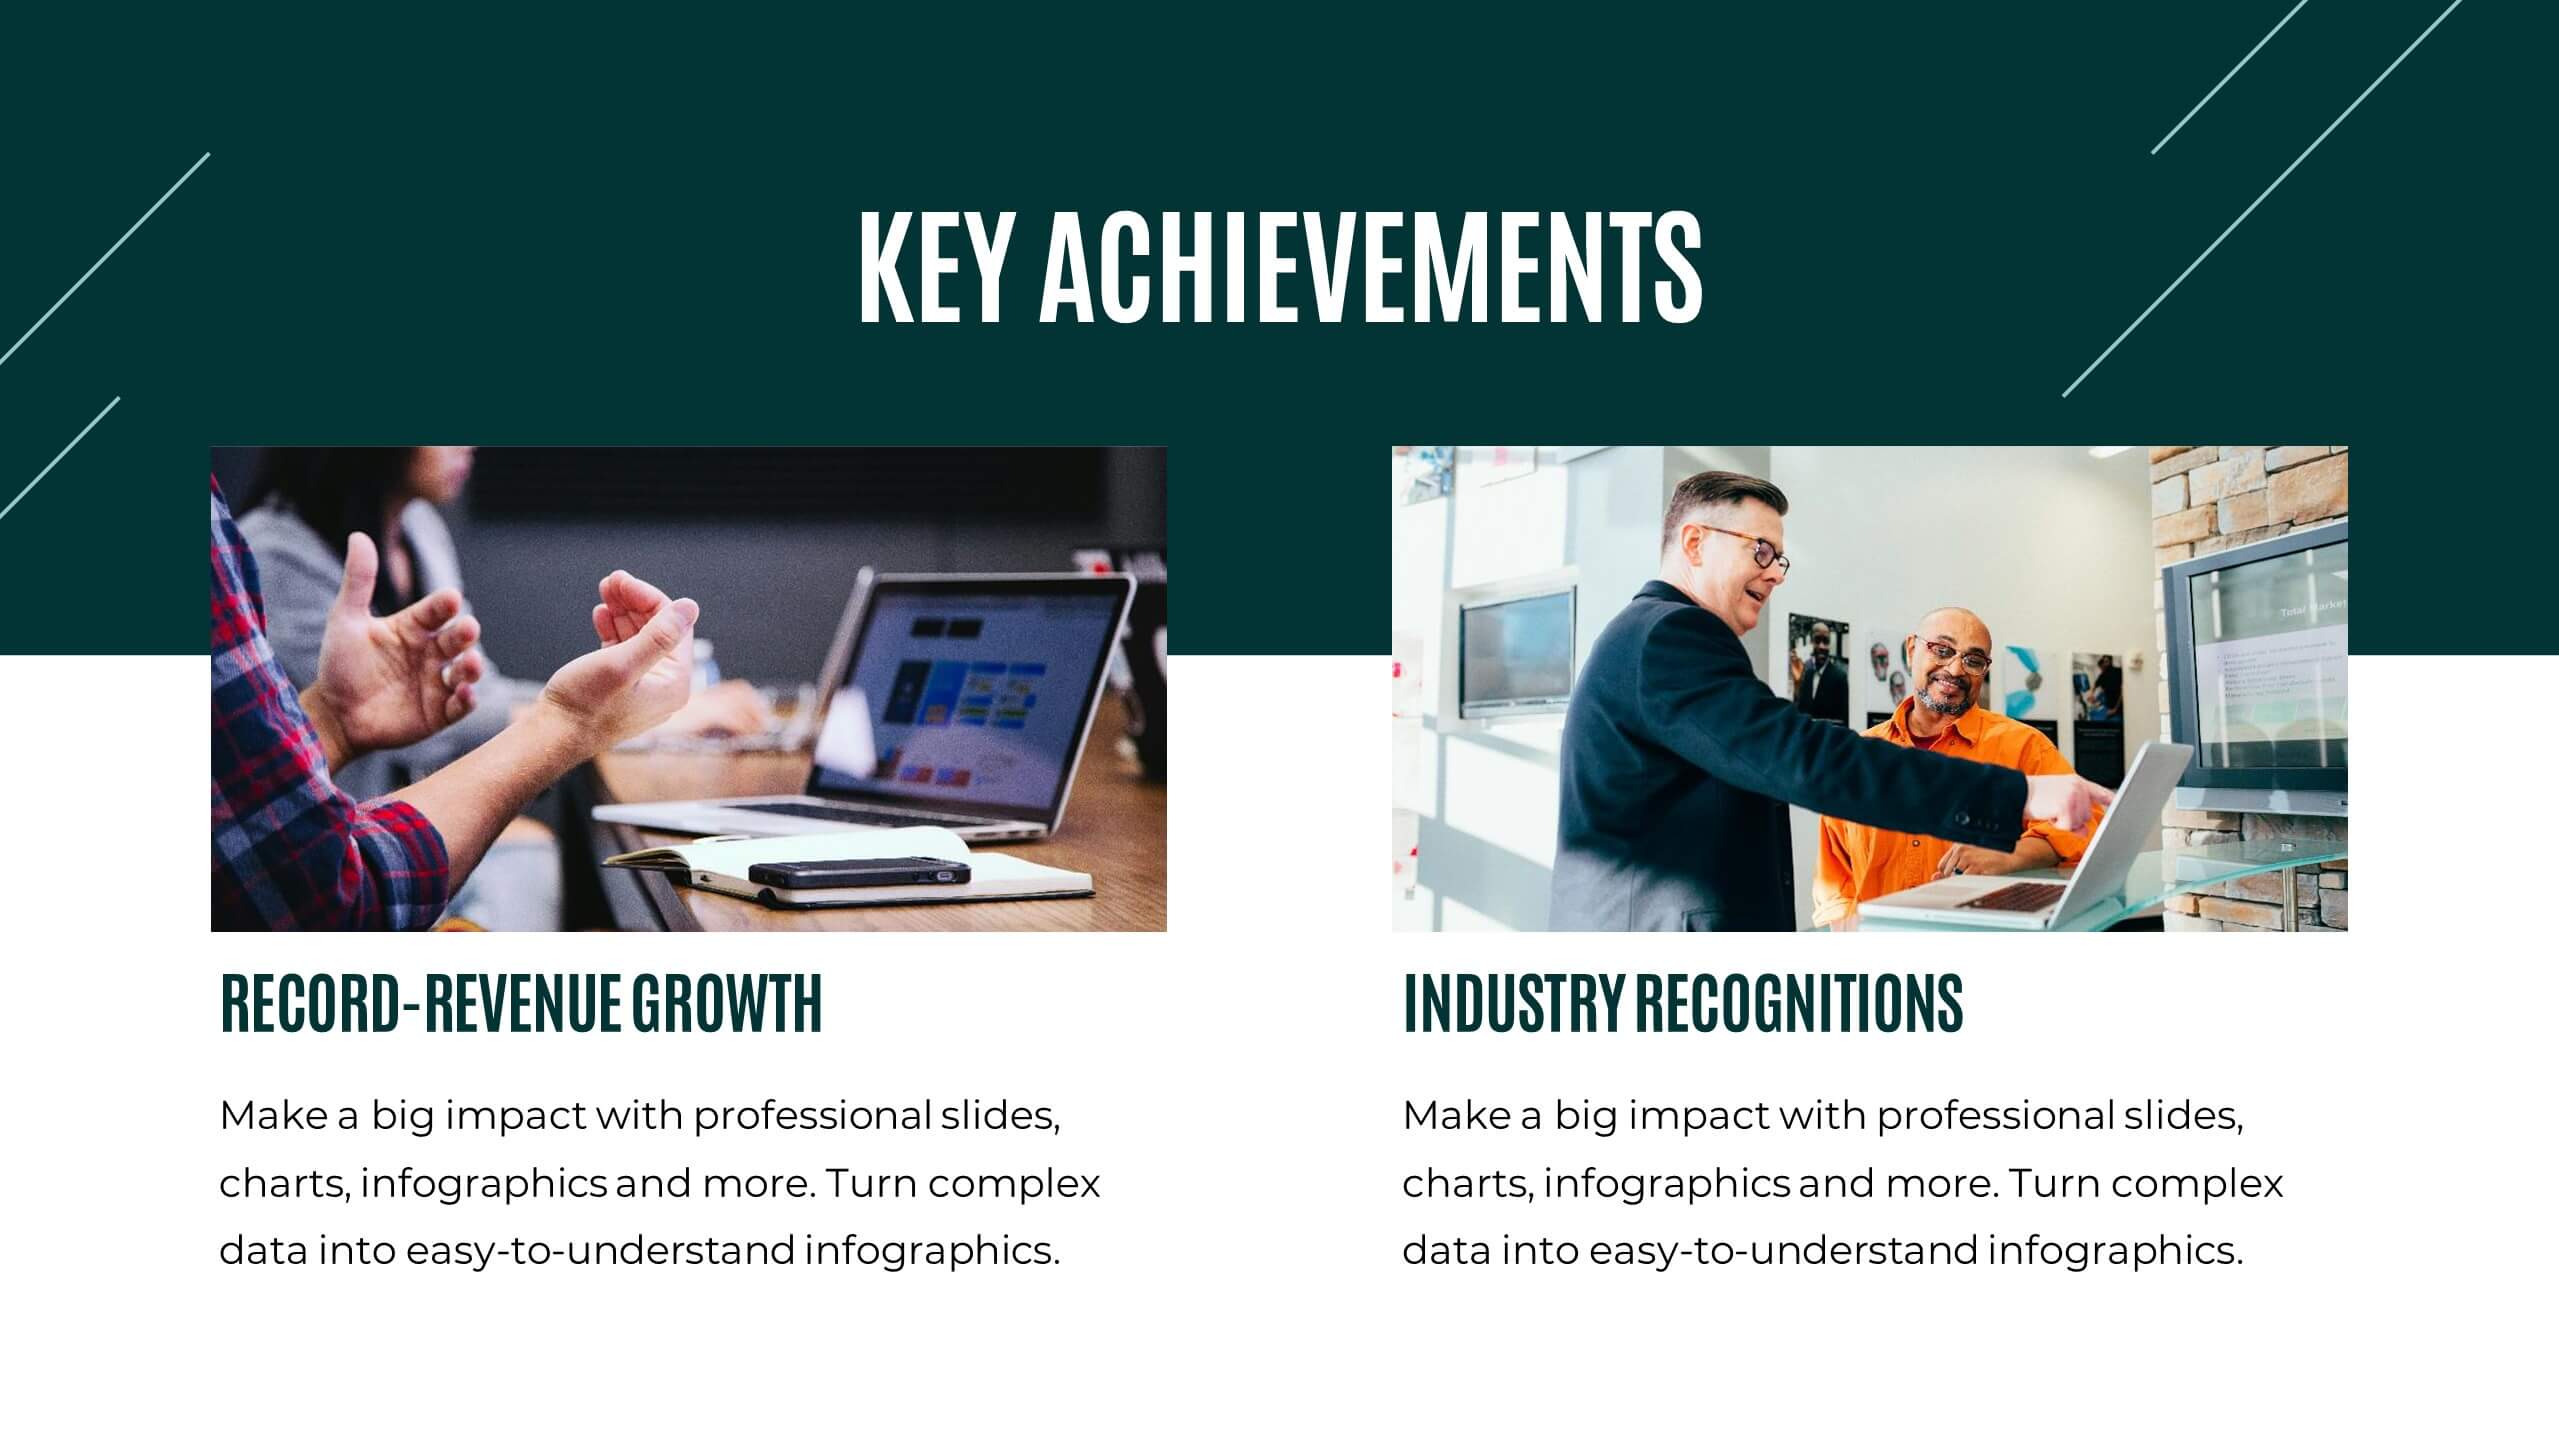
Business Performance Metrics Presentation
Track and display your business metrics effectively with the "Business Performance Metrics" presentation templates. These visually engaging slides are designed to help you present key performance indicators in a clear and structured manner, enhancing understanding and decision-making. Ideal for corporate presentations, these templates are fully compatible with PowerPoint, Keynote, and Google Slides, ensuring seamless integration into your workflow.


4 slides
30-60-90 Day Business Plan
Kickstart new roles, projects, or team onboarding with this bold 30-60-90 Day Business Plan template. Designed to outline goals, milestones, and deliverables over three critical phases, this layout is ideal for managers, job candidates, and team leaders. Fully editable in PowerPoint, Keynote, and Google Slides.


4 slides
Options Comparison Chart Presentation
Make every decision crystal clear with a dynamic, easy-to-follow layout designed to compare options side by side. Perfect for presenting business strategies, pricing plans, or feature breakdowns, this presentation helps your audience see the value instantly. Fully compatible with PowerPoint, Keynote, and Google Slides for effortless editing.


10 slides
Water Cycle and Hydrological Study Presentation
Break down complex water cycle processes with this engaging diagram layout. Featuring a bottle-shaped center graphic with directional arrows, it’s perfect for illustrating hydrological stages or sustainability concepts. Fully editable in PowerPoint, Keynote, and Google Slides, making it ideal for educational, environmental, or scientific presentations. Clear, modern, and easy to use.


4 slides
Europe Market Expansion Visualization Presentation
Showcase your European growth strategy with the Europe Market Expansion Visualization Presentation. This map-based slide design allows you to clearly highlight regional opportunities, new market entries, and key expansion zones using icons and color-coded country markers. Ideal for strategic planning, investor updates, and sales overviews. Fully editable in PowerPoint, Keynote, Google Slides, and Canva.


22 slides
Prism Project Status Report Presentation
Deliver impactful updates with this comprehensive project status report template! Perfect for presenting key highlights, performance metrics, and strategic initiatives. Ideal for project managers aiming to keep stakeholders informed and aligned. Compatible with PowerPoint, Keynote, and Google Slides, this template ensures your reports are clear, professional, and engaging. Keep projects on track!


10 slides
Hierarchy Tree Structure Slide Presentation
Bring your ideas to life with a dynamic visual flow that connects every stage of your business strategy. Perfect for mapping growth, processes, or team structures, this clean and modern layout keeps your data clear and engaging. Fully compatible with PowerPoint, Keynote, and Google Slides for effortless customization.


20 slides
Spartan Content Marketing Pitch Deck Presentation
The Spartan Marketing Pitch Deck is designed to captivate and impress with its bold, modern layout and striking black-and-white color scheme. Perfect for delivering powerful marketing strategies, this template covers all essential aspects from industry overview to consumer behavior analysis. It seamlessly guides you through emerging technologies, content marketing trends, and mobile marketing insights. The deck emphasizes personalization trends, influencer marketing, and the latest eCommerce developments, ensuring your pitch resonates with cutting-edge strategies. Whether discussing SEO and SEM trends or diving into customer experience and brand storytelling, this template delivers your message with clarity and impact. Conclude with a strong call to action, ensuring your audience is engaged and ready to take the next step. Fully compatible with PowerPoint, Keynote, and Google Slides, the Spartan Marketing Pitch Deck is an excellent choice for professionals aiming to deliver a memorable and persuasive presentation.


7 slides
Business Process Checklist
Simplify workflow tracking with this visual business process checklist slide. Featuring circular progress bars and bold letter labels (A–C), this template helps visualize task completion percentages for up to six steps. Perfect for audits, quality checks, or operational reviews. Fully customizable in PowerPoint, Keynote, and Google Slides.


6 slides
Historical Data Timeline Visualization
Showcase historical progression with clarity using the Historical Data Timeline Visualization. Designed for presenting chronological data points, this template combines circle elements with image icons and milestone labels—perfect for educational or historical presentations. Fully editable in Canva, PowerPoint, Keynote, and Google Slides for seamless customization.


6 slides
Corporate Profiles Layout Presentation
Bring your business story to life with a clean, modern layout that makes every detail feel polished and professional. This presentation is designed to showcase company highlights, key services, and essential profile information with clarity and impact. Fully editable and easy to customize in PowerPoint, Keynote, and Google Slides.


5 slides
Industry Analysis Porter's 5 Forces
Analyze market dynamics with this clean, circular infographic focused on Porter’s Five Forces. Visually break down buyer power, supplier influence, new entrants, substitutes, and competitive rivalry for a clear strategic overview. Ideal for consultants, marketers, and business analysts. Fully editable in PowerPoint, Keynote, and Google Slides.


21 slides
Carmenta Project Management Plan Presentation
Organize your projects with clarity using this comprehensive project management plan template. It includes slides for objectives, timelines, risk management, budget breakdowns, and team introductions. Ideal for efficient project presentations, it’s compatible with PowerPoint, Keynote, and Google Slides, offering a structured approach to showcase every project detail.


22 slides
Marketing Research Presentation
Streamline your data presentation with our Marketing Research template. It includes comprehensive slides on research objectives, methodology, data analysis, and key findings. Ideal for academic and professional settings, this template is compatible with PowerPoint, Keynote, and Google Slides, enhancing your research presentations with precision and professionalism.