


Features
- 21 Unique Slides
- Fully editable and easy to edit in Microsoft Powerpoint, Keynote and Google Slides
- 16:9 widescreen layout
- Clean and professional designs
- Export to JPG, PDF or send by email


Do you have any questions?
Recommend


23 slides
Fama Business Idea Pitch Deck Presentation
Present your business idea with this impactful pitch deck, covering key areas like problem statement, solutions, competitive landscape, financials, and growth projections. With a bold design, it effectively showcases your startup’s value proposition. Compatible with PowerPoint, Keynote, and Google Slides for dynamic and professional investor presentations.


10 slides
Workforce Learning & Training Module Presentation
Visualize your team’s learning journey with the Workforce Learning & Training Module Presentation. This hexagonal layout clearly maps training pillars or module stages, helping you present development plans in a structured, engaging way. Ideal for HR professionals, corporate trainers, and consultants. Fully editable in PowerPoint, Keynote, Google Slides, and Canva.


5 slides
Startup Growth Roadmap and Milestones Presentation
Present your startup journey clearly with the Startup Growth Roadmap and Milestones Presentation. This timeline-style layout breaks down your key phases, from initial concept to market traction. Ideal for investor decks, pitch presentations, or internal planning. Fully editable in PowerPoint, Canva, and Google Slides for seamless customization.

26 slides
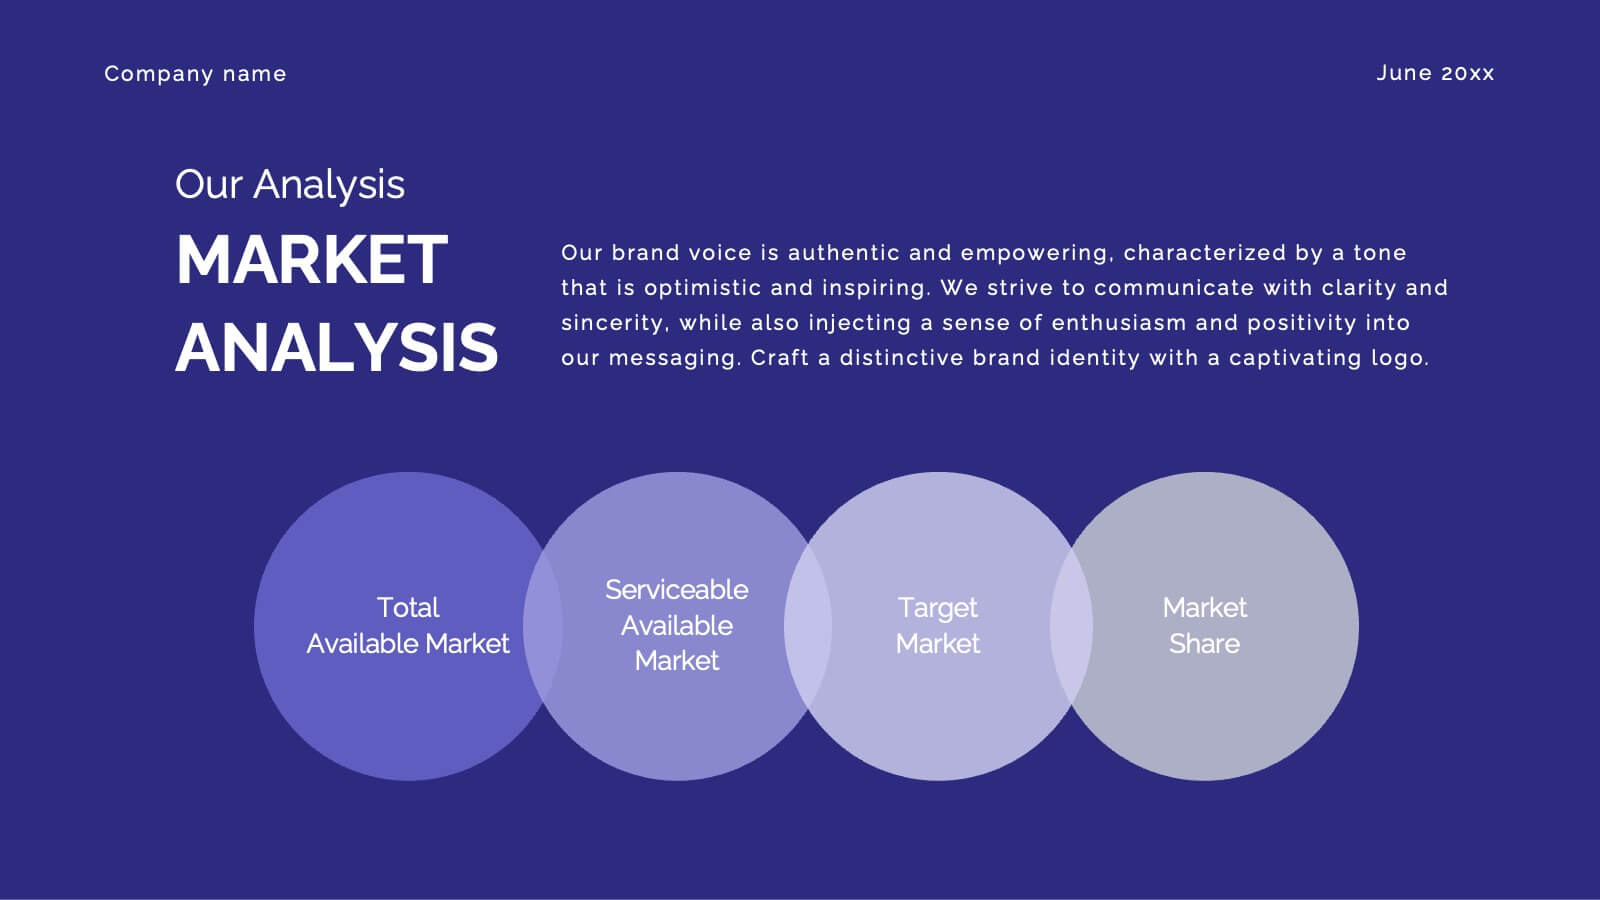
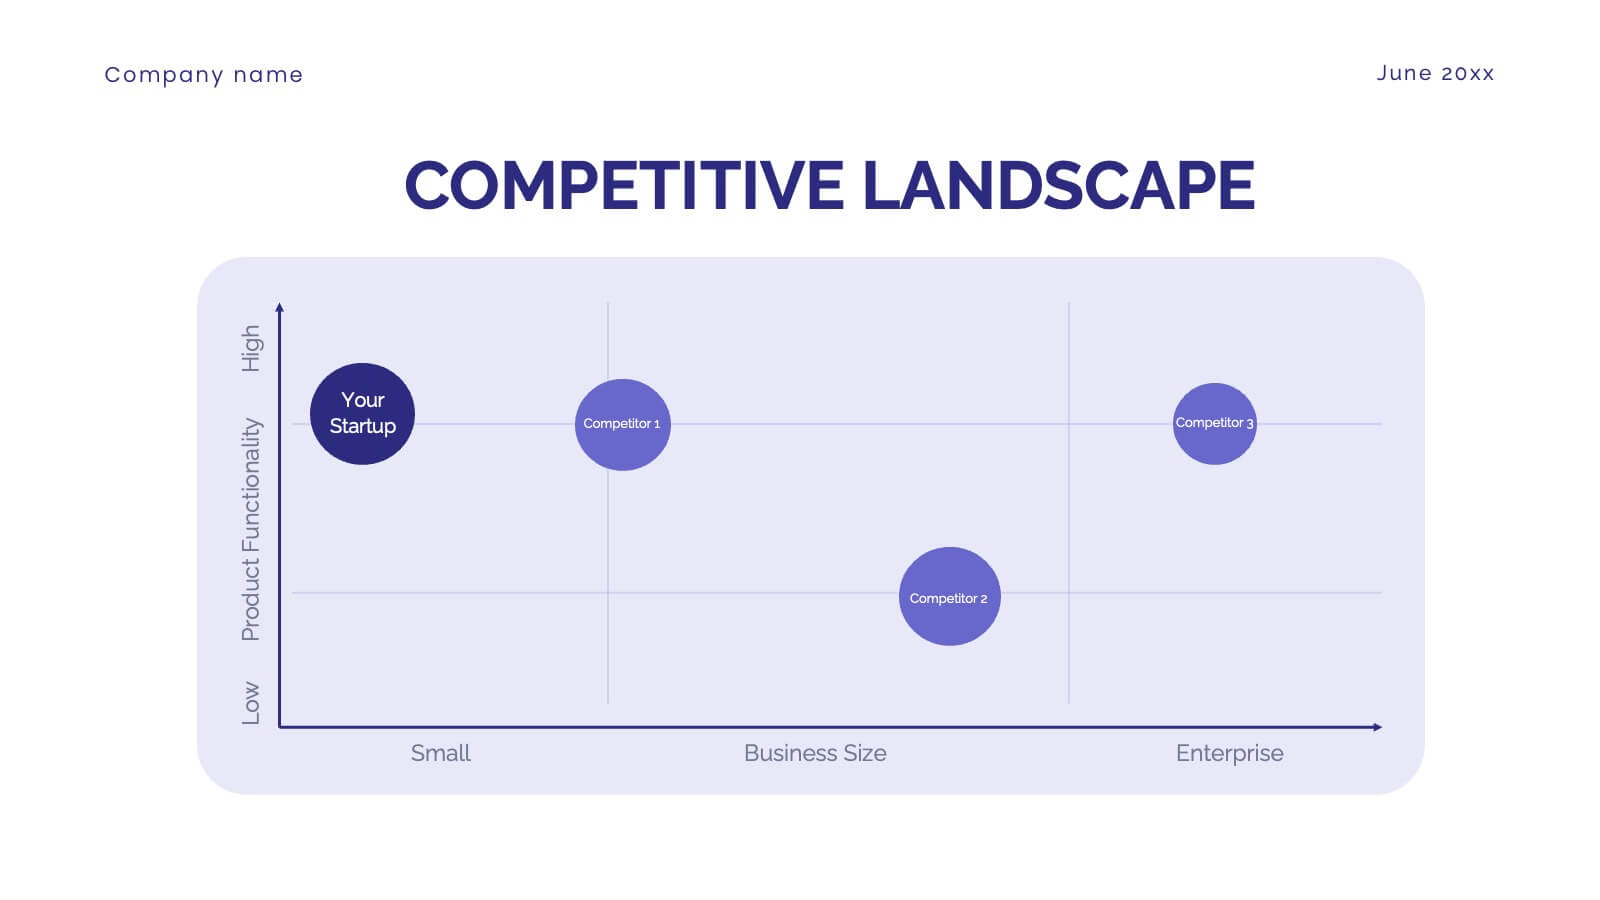
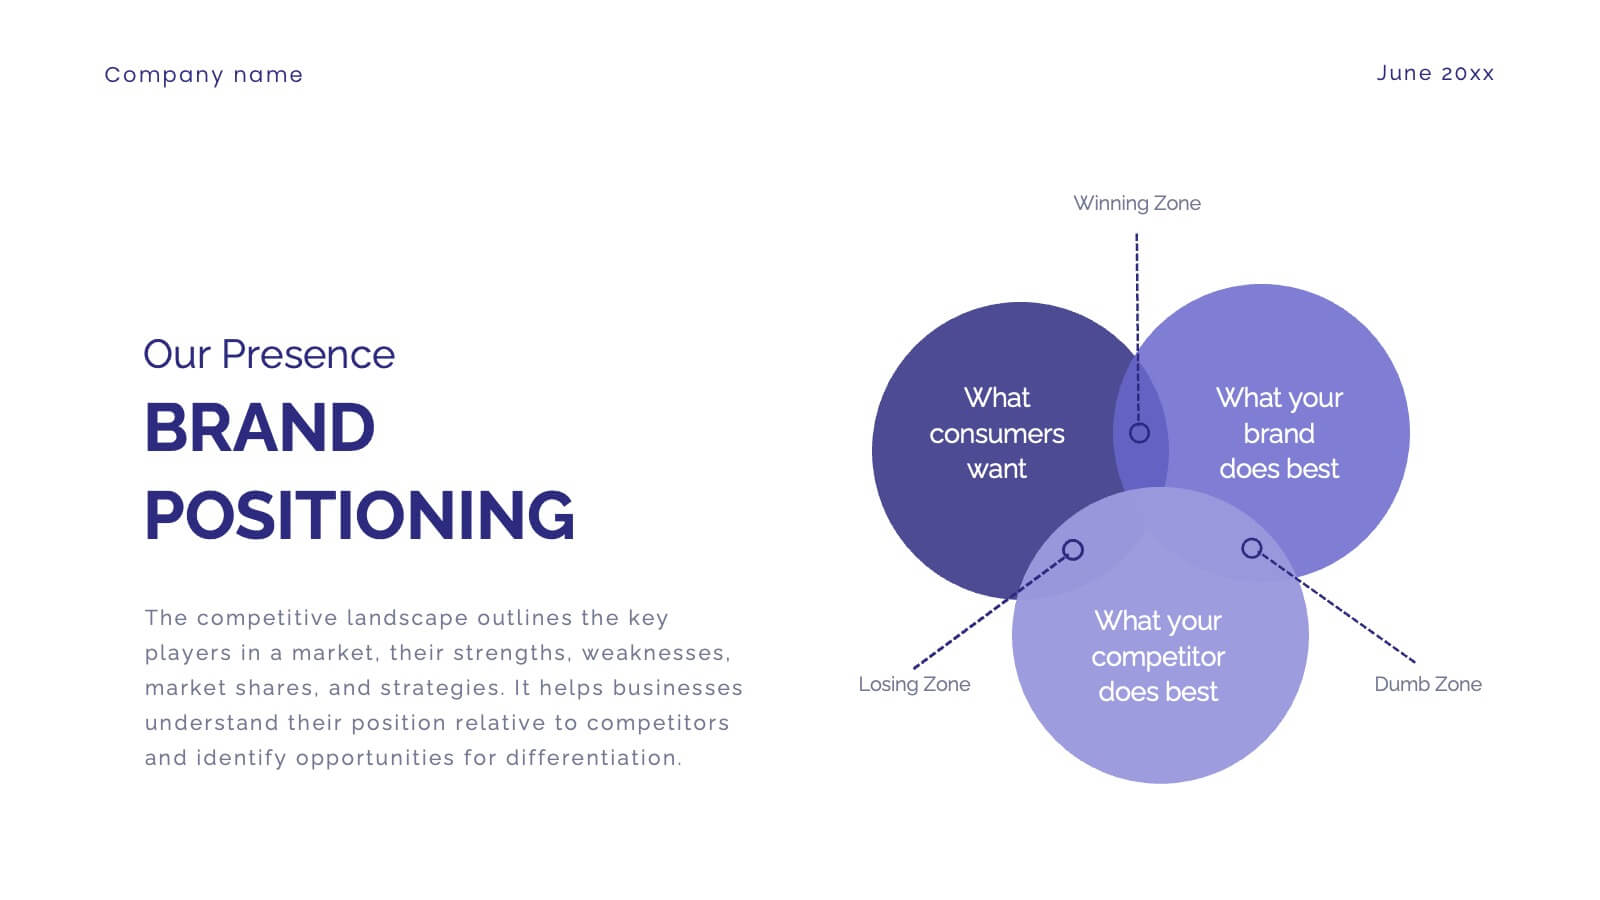
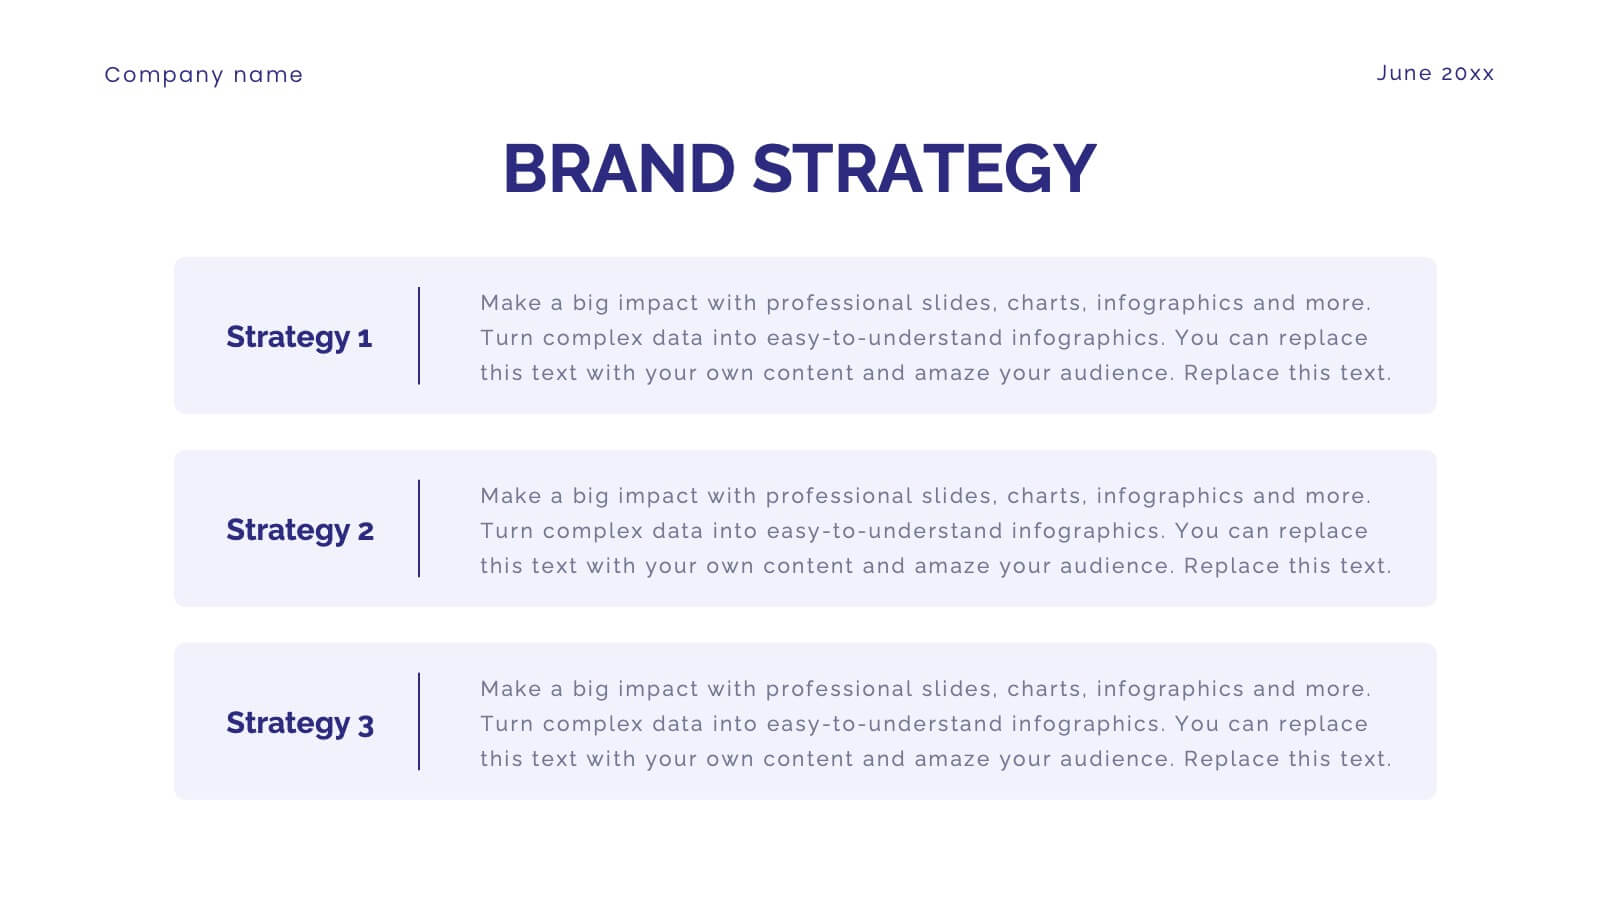
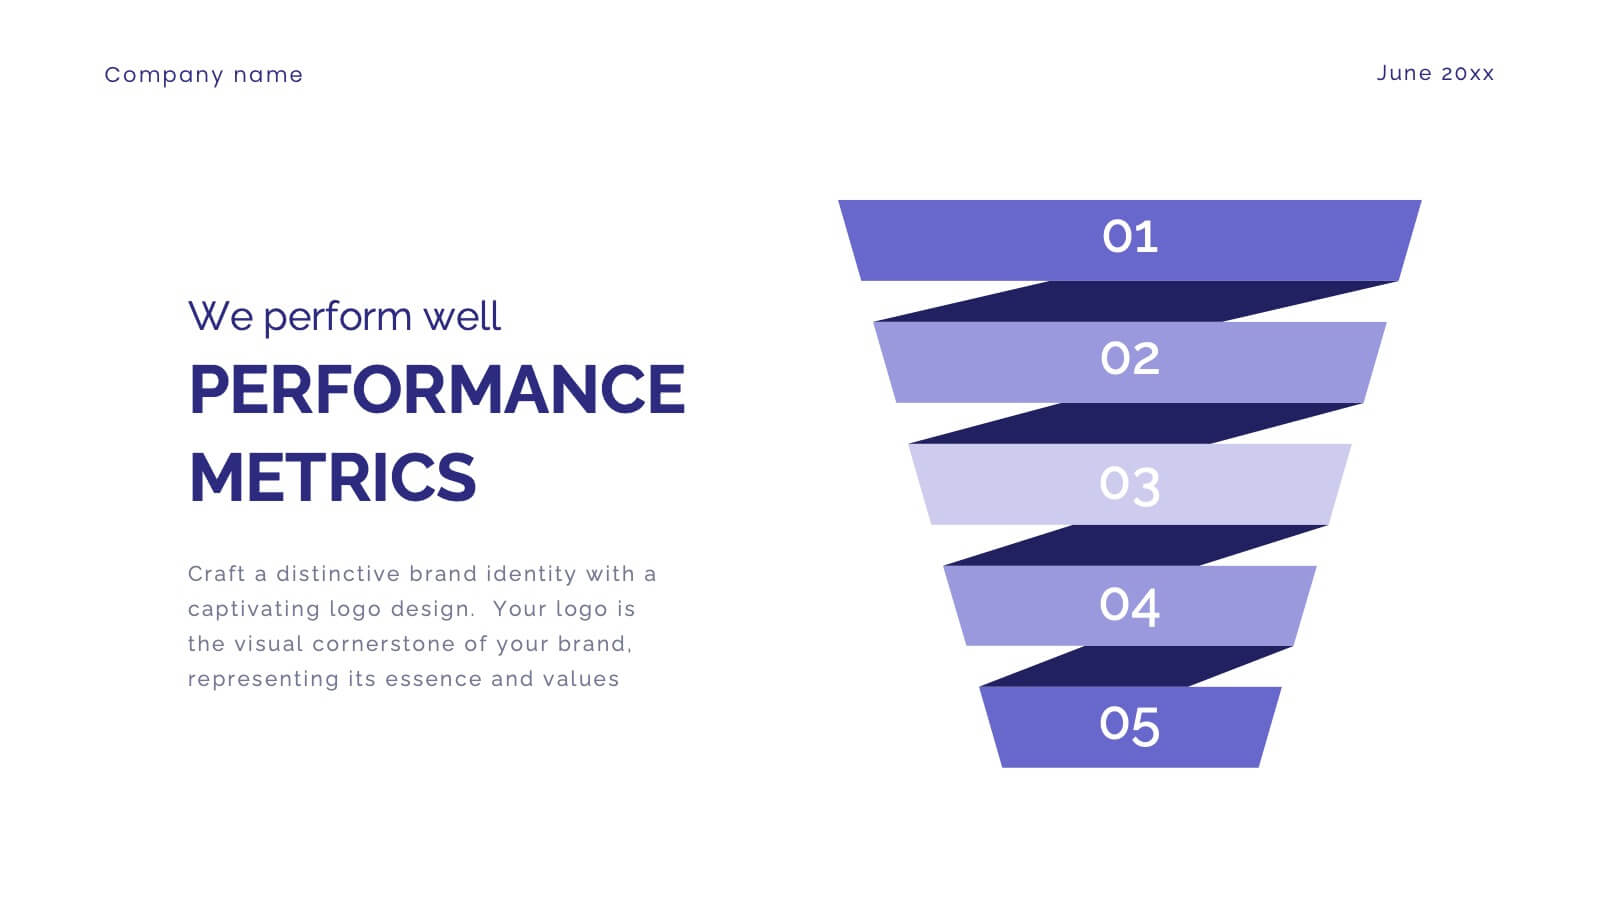
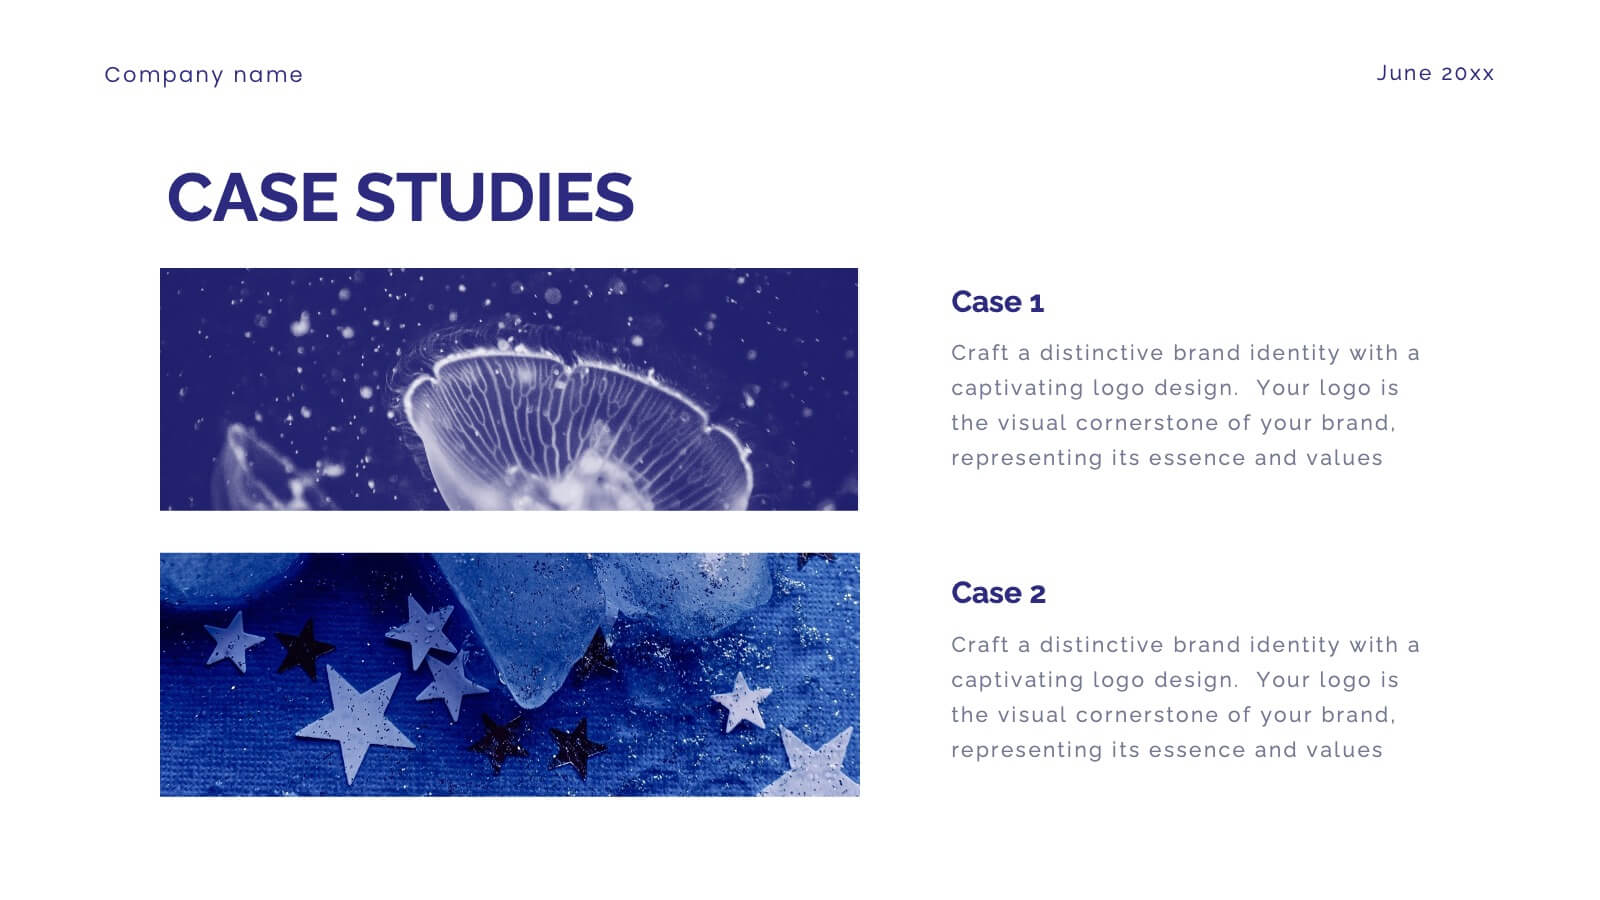
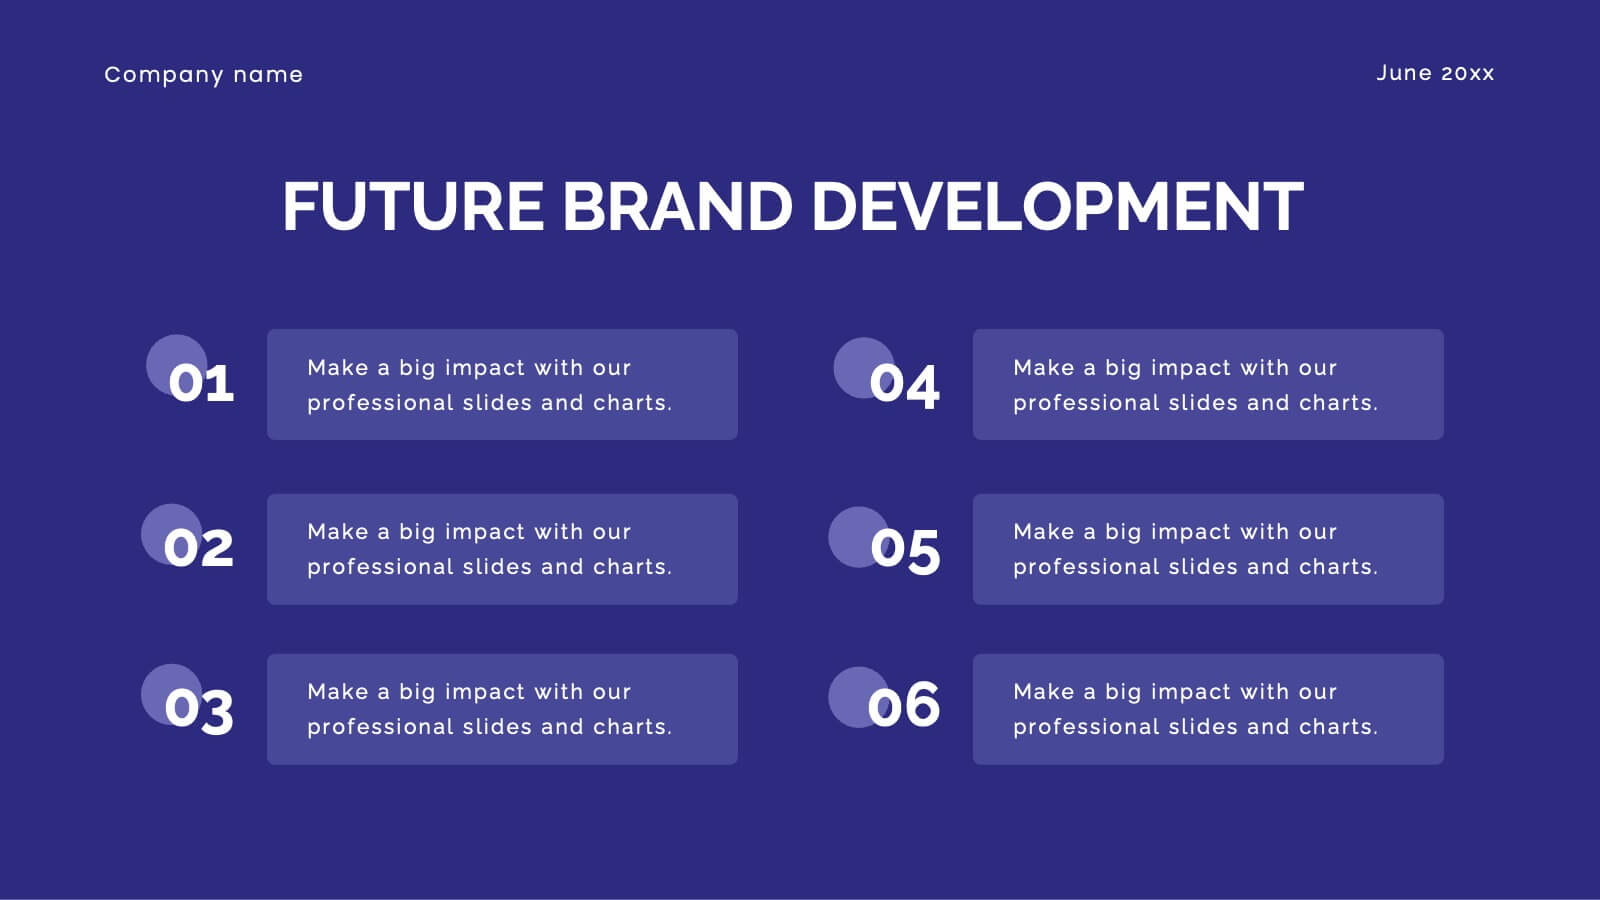
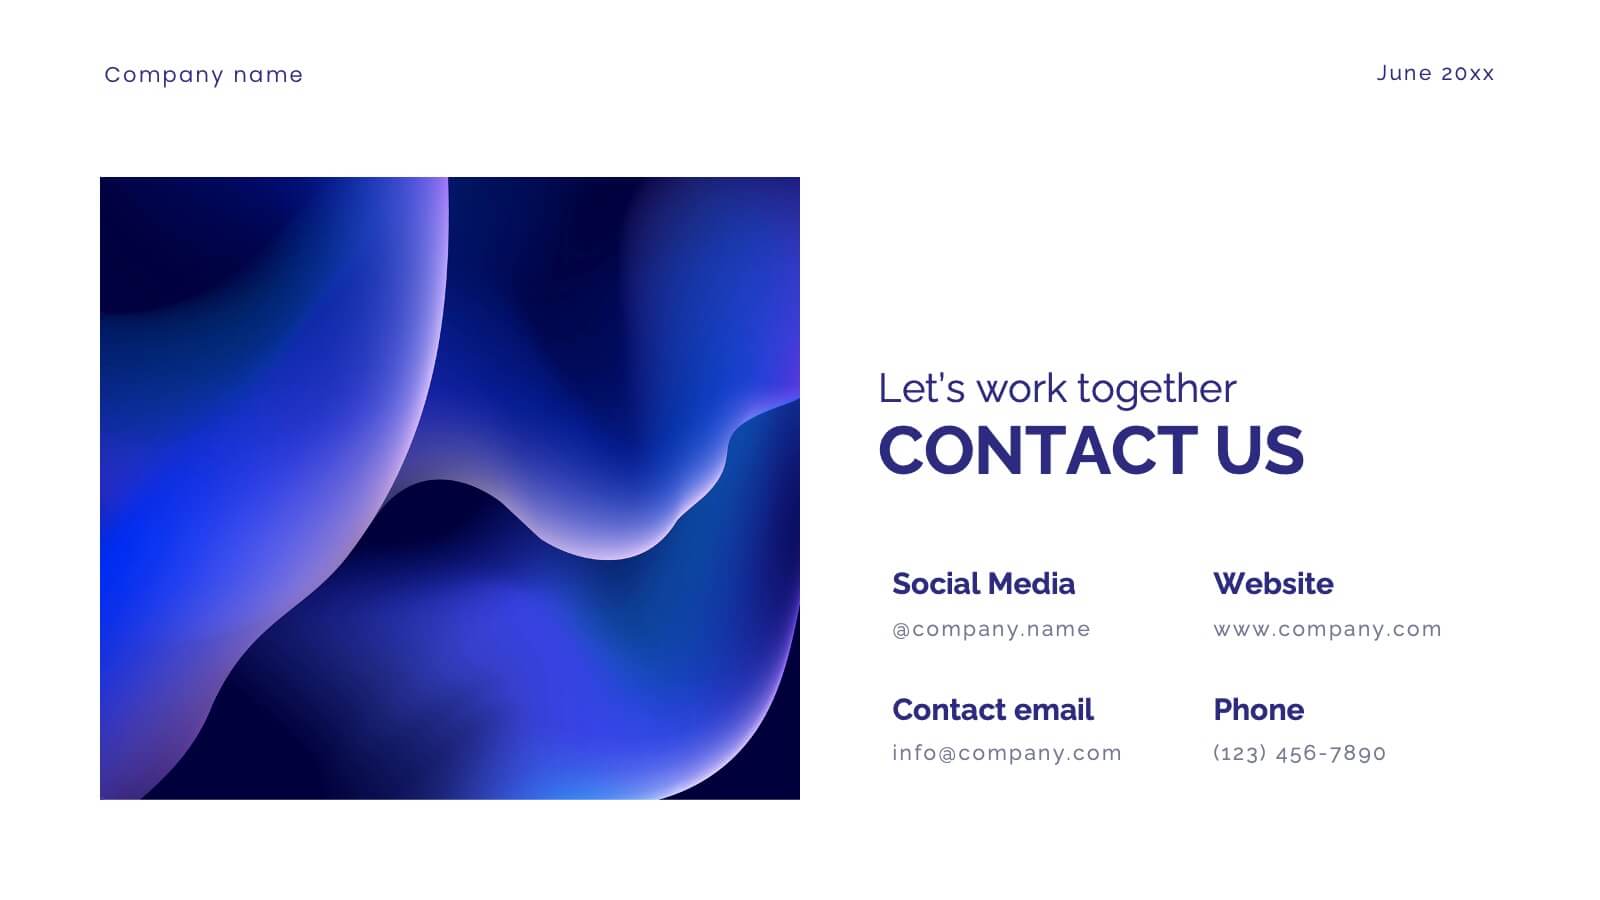
Glimmer Brand Development Pitch Deck Presentation
Elevate your brand with this comprehensive rebranding presentation template! Perfect for detailing your logo, color scheme, and market analysis, it includes slides for brand positioning, competitive landscape, and performance metrics. Engage your audience with clear visuals and structured content. Compatible with PowerPoint, Keynote, and Google Slides for seamless presentations on any platform.


6 slides
Key Points Overview Presentation
Bring your message to life with a slide that makes every key point feel clear, organized, and easy to follow. This presentation helps you highlight essential ideas, compare insights, and simplify complex information for any audience. Perfect for meetings, reports, or strategy updates. Fully compatible with PowerPoint, Keynote, and Google Slides.


6 slides
Effective Team Structure Guide Presentation
Visualize your team's structure with clarity using this team guide presentation. Designed for highlighting roles, connections, and reporting lines, each slide helps communicate responsibilities and hierarchy efficiently. Ideal for HR, managers, and team leads. Fully editable in PowerPoint, Keynote, and Google Slides—customize colors, names, and positions with ease.


4 slides
Stock Market Insights and Trends Presentation
Visualize complex financial data with ease using the Stock Market Insights and Trends presentation template. This layout features a bold line chart with labeled milestones to highlight key shifts in performance, market patterns, or strategic indicators. Ideal for investment reports, financial briefings, and economic updates. Perfect for analysts, finance professionals, and business strategists. Fully editable and compatible with PowerPoint, Keynote, and Google Slides.


8 slides
Training and Development Onboarding Presentation
Streamline the training and development process for new hires with a structured onboarding funnel. This Training and Development Onboarding template provides a clear, step-by-step visualization of how employees progress through the learning process. Perfect for HR managers, trainers, and corporate educators. Fully editable and compatible with PowerPoint, Keynote, and Google Slides for easy customization.


6 slides
Data Trends and Statistical Overview Presentation
Present your insights clearly with the Data Trends and Statistical Overview presentation. This template features a clean combination of bar charts and half-pie graphs to showcase metrics, comparisons, and progress at a glance. Ideal for monthly analytics, business reviews, or performance tracking. Fully editable in PowerPoint, Keynote, and Google Slides.


6 slides
Visual Business Concept Triangle
Communicate processes, concepts, or growth stages with this dynamic triangle layout. Perfect for highlighting five key ideas or steps in a sleek, professional way. Fully customizable in PowerPoint, Keynote, and Google Slides for easy personalization.


26 slides
Crypto Currency Dark Presentation
Navigate the dynamic world of digital finance with our Crypto Currency presentation template, compatible with PowerPoint, Keynote, and Google Slides. This template is an invaluable tool for financial analysts, crypto enthusiasts, and educators in the realm of digital currencies. The design boasts a bold and modern aesthetic, with cryptocurrency motifs that capture the essence of this revolutionary market. With this template, you can present complex financial data and crypto concepts with clarity. Its range of slides includes comparative analyses, timeline infographics, and process diagrams, enabling a thorough exploration of the cryptocurrency landscape. The vibrant colors and creative graphics make it easy to highlight market trends, investment opportunities, and the technology behind cryptocurrencies. By using our Crypto Currency template, you'll engage and educate your audience on the nuances of blockchain and digital assets. Download it today to deliver a presentation that's as innovative and forward-thinking as the topic itself.


6 slides
Budget and Expense Breakdown Presentation
Kickstart your financial story with a clean, energetic visual that makes every cost and category instantly understandable. This presentation helps you break down spending, compare expenses, and highlight key budget insights using a simple, structured layout. Perfect for reports and planning meetings. Fully compatible with PowerPoint, Keynote, and Google Slides.


20 slides
Falcon Digital Marketing Strategy Plan Presentation
Develop a winning marketing strategy with this dynamic template. Dive into current trends, consumer behavior, and innovative techniques. Perfect for social media, influencer marketing, and data-driven campaigns. Fully compatible with PowerPoint, Keynote, and Google Slides.


5 slides
Educational Planning & Class Activities Presentation
Organize your lessons with this creative education-themed layout. Featuring a playful stack of books and apple illustration, this slide is ideal for outlining academic plans, class objectives, or weekly activities. Fully editable in PowerPoint, Keynote, and Google Slides—perfect for teachers, homeschoolers, and education professionals seeking clarity and visual appeal.


4 slides
Customer Buyer Persona Profile Presentation
Bring your audience into the mind of your ideal customer with a clean, story-driven layout that highlights demographics, motivations, and everyday habits. This presentation helps you communicate who you’re targeting and why it matters, creating clarity for marketing and product teams. Fully compatible with PowerPoint, Keynote, and Google Slides.


12 slides
Understanding Digital Currencies Presentation
Simplify the complexity of crypto ecosystems with the Understanding Digital Currencies presentation template. Designed around a wallet-style visual, this layout highlights key features of various cryptocurrencies using six labeled touchpoints. Perfect for introducing Bitcoin, Ethereum, altcoins, and digital wallets in educational, financial, or blockchain-related presentations. Ideal for crypto educators, fintech startups, and investment analysts. Compatible with PowerPoint, Keynote, and Google Slides.


26 slides
Maki Presentation Template
Japanese cuisine is known all around the world, there is so much to try including all the different types of sushi. Maki is a 26 slide template made to help you market your services and products. The clean, simplistic design makes it easy for you to display your content in any modernized way. Maki is designed to showcase your packages, pricing and more. Help your customers feel comfortable purchasing your service or product using this template. Present your message clearly and effectively with this presentation. You can customize the design, photos, background and fonts to make it your own.